Stratégie de référence de tendance haussière de percée quantitative
Auteur:ChaoZhang est là., Date: 21 février 2024Les étiquettes:

Résumé
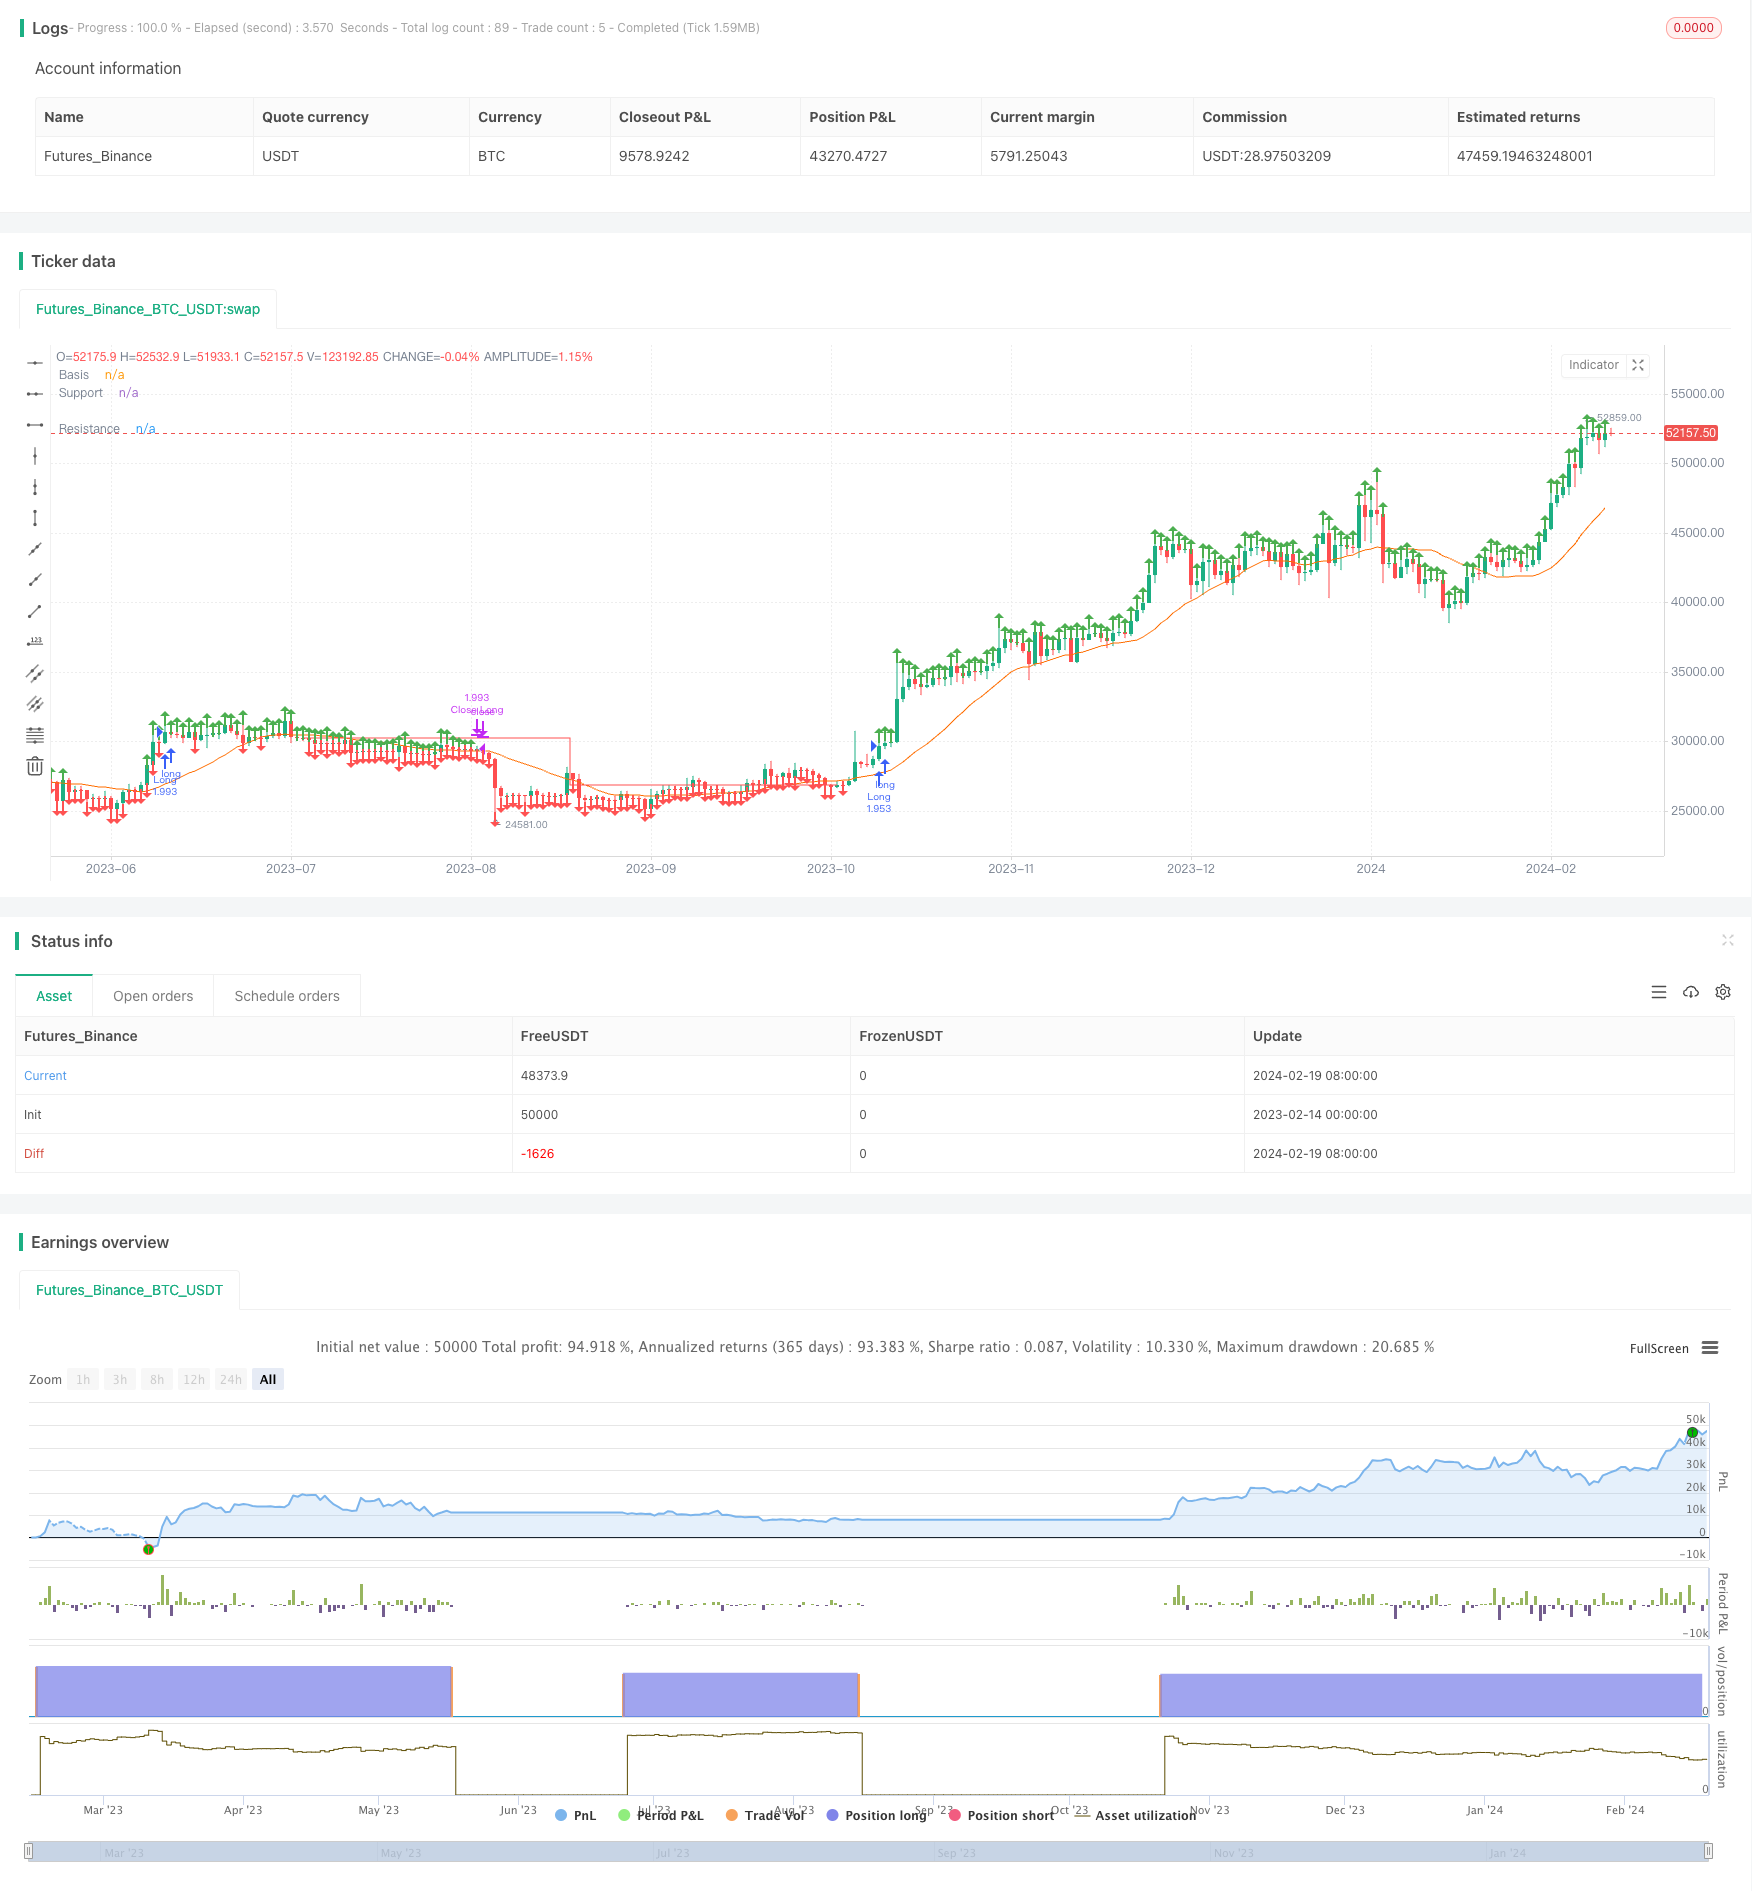
Cette stratégie est une stratégie de détention à long terme basée sur la détermination de la direction de la tendance avec des lignes moyennes mobiles simples et la formation de signaux de percée avec des lignes de résistance et de soutien.
Principe de stratégie
- Calculer la moyenne mobile simple à 20 jours comme référence pour déterminer la tendance
- Calculer les points Pivot High et Pivot Low basés sur les paramètres d'entrée utilisateur
- Tracez les lignes de résistance et de soutien basées sur les points Pivot High et Pivot Low
- Allez long lorsque le prix de clôture est supérieur à la ligne de résistance
- Fermeture des positions lorsque la ligne de support traverse la ligne de résistance
Cette stratégie utilise des moyennes mobiles simples pour déterminer la direction globale de la tendance, puis utilise les percées de points clés pour générer des signaux de trading, ce qui est une stratégie de rupture typique.
Analyse des avantages
- La stratégie présente suffisamment d'opportunités et convient aux actions à forte volatilité, ce qui facilite la capture des tendances
- Bon contrôle des risques pour les positions longues, rapport risque/rendement élevé
- Utiliser des signaux de rupture pour éviter le risque de fausses ruptures
- Paramètres personnalisables, grande adaptabilité
Analyse des risques
- Faites confiance à l'optimisation des paramètres, les paramètres incorrects augmenteront la probabilité de fausses ruptures
- Retard dans les signaux de percée, peut manquer certaines opportunités
- Facile à arrêter sur les marchés volatils
- L'absence d'ajustement de la ligne de soutien à temps peut entraîner des pertes.
Les risques peuvent être réduits en optimisant les paramètres par le biais du trading en direct et en incorporant des stratégies de stop loss/take profit.
Directions d'optimisation
- Optimiser les paramètres de la moyenne mobile
- Optimiser les paramètres des lignes de résistance et de soutien
- Ajouter des stratégies stop loss/take profit
- Améliorer les mécanismes de confirmation des percées
- Signaux filtrants avec volume de négociation et autres indicateurs
Résumé
Dans l'ensemble, cette stratégie est une stratégie de rupture typique qui repose sur l'optimisation des paramètres et la liquidité, adaptée aux traders de tendance.
/*backtest
start: 2023-02-14 00:00:00
end: 2024-02-20 00:00:00
period: 1d
basePeriod: 1h
exchanges: [{"eid":"Futures_Binance","currency":"BTC_USDT"}]
*/

// This source code is subject to the terms of the Mozilla Public License 2.0 at https://mozilla.org/MPL/2.0/
// © CheatCode1

//@version=5
strategy("Quantitative Trend Strategy- Uptrend long", 'Steady Uptrend Strategy', overlay=true, initial_capital = 1500, default_qty_value = 100, commission_type = strategy.commission.percent, commission_value = 0.01, default_qty_type = strategy.percent_of_equity)


length = input.int(20, minval=1)
src = input(close, title="Source")
basis = ta.sma(src, length)
offset = input.int(0, "Offset", minval = -500, maxval = 500)
plot(basis, "Basis", color=#FF6D00, offset = offset)

inp1 = input.int(46, 'LookbackLeft')
inp2 = input.int(32, 'LookbackRight')

l1 = ta.pivothigh(close, inp1, inp2)
S1 = ta.pivotlow(close, inp1, inp2)

// plot(l1, 'Pivothigh', color.red, 1)
// // plot(S1, 'Pivot Low', color.red)

l1V = ta.valuewhen(l1, close, 0)
S1V = ta.valuewhen(S1, close, 0)

Plotl1 = not na(l1) ? l1V : na
PlotS1 = not na(S1) ? S1V : na

plot(Plotl1, 'Resistance', color.green, 1, plot.style_stepline, true)
plot(PlotS1, 'Support', color.red, 1, plot.style_stepline, true)

Priceforlong = close > l1V ? true : na
Priceforshort = close < S1V ? true : na

plotshape(Priceforlong ? high : na, 'p', shape.arrowup, location.abovebar, color.green, size = size.small)
plotshape(Priceforshort ? low : na, 's', shape.arrowdown, location.belowbar, color.red, size = size.small)

vol = volume
volma = ta.sma(vol, 20)

Plotl1C = ta.valuewhen(na(Plotl1), l1V, 0)
PlotS1C = ta.valuewhen(na(PlotS1), S1V, 0)
//Strategy Execution
volc = volume > volma

Lc1 = Priceforlong

Sc1 = Priceforshort

sL = Plotl1 < PlotS1 ? close : na
sS = PlotS1 > Plotl1 ? close : na


if Lc1
    strategy.entry('Long', strategy.long)
// if Sc1 and C2
//     strategy.entry('Short', strategy.short)

if Priceforshort
    strategy.cancel('Long')
if Priceforlong
    strategy.cancel('Short')


// Stp1 = ta.crossover(k, d)
// Ltp1 = ta.crossunder(k, d)
// Ltp = d > 70  ? Ltp1 : na
// Stp = d < 30  ? Stp1 : na


if strategy.openprofit >= 0 and sL
    strategy.close('Long')
if strategy.openprofit >= 0 and sS
    strategy.close('Short')
takeP = input.float(2, title='Take Profit') / 100
stopL = input.float(1.75, title='Stop Loss') / 100


// // Pre Directionality

Stop_L = strategy.position_avg_price * (1 - stopL)

Stop_S = strategy.position_avg_price * (1 + stopL)

Take_S= strategy.position_avg_price * (1 - takeP)

Take_L = strategy.position_avg_price * (1 + takeP)

// sL = Plotl1 < PlotS1 ? close : na
// sS = PlotS1 < Plotl1 ? close : na

// //Post Excecution
if strategy.position_size > 0 and not (Lc1)
    strategy.exit("Close Long", stop = Stop_L, limit = Take_L)

if strategy.position_size < 0 and not (Sc1)
    strategy.exit("Close Short", stop = Stop_S, limit = Take_S)
- Stratégie de négociation d'agrégation des indicateurs de dynamique
- Stratégie de négociation quantitative multi-indicateur
- TradingVMA
Stratégie de négociation des moyennes mobiles variables - Stratégie de divergence des IRS
- Stratégie de rupture du canal de Donchian
- Stratégie de négociation de rupture des bandes de Bollinger
- Stratégie de piégeage de l'AEM
- Stratégie commerciale de la croix dorée et de la croix morte
- Stratégie de suivi des tendances sur plusieurs périodes de temps basée sur les supertendances
- Stratégie manuelle d'alerte d'achat et de vente
- Stratégie de négociation adaptative basée sur une plateforme de négociation quantitative
- Stratégie de négociation quantitative basée sur le nuage Ichimoku et la moyenne mobile
- Stratégie de suivi de l'inversion des moyennes mobiles doubles
- Stratégie d'inversion des bandes de Bollinger
- Ichimoku Kinko Hyo Cloud + QQE Stratégie quantitative
- Tout sur la stratégie de trading de l' élan avec Stop Loss pour l' or
- L'oscillateur de parabole à la recherche de stratégies de hauts et de bas
- Stratégie de rupture des bandes de Bollinger
- Stratégie révolutionnaire sur l'écart de valeur équitable
- Système de croisement de moyenne mobile adaptative avec rupture de momentum