Aperçu
Cette stratégie est un système de trading dynamique qui combine plusieurs indicateurs techniques et intègre un mécanisme de stop-loss flexible. La stratégie utilise principalement les signaux croisés des trois indicateurs techniques courants, le RSI, l’EMA et le MACD, pour juger de la tendance et de la dynamique du marché et prendre des décisions de trading sur cette base.
Principe de stratégie
Le principe central de cette stratégie est d’identifier les opportunités de trading potentielles par la synergie de plusieurs indicateurs.
- Le RSI (indicateur de la relative faiblesse) est utilisé pour déterminer si le marché est en survente ou en surachat.
- Le changement de tendance est confirmé par une croisée des EMA (moyennes mobiles indicielles) à court et à long terme.
- La relation entre les lignes de signaux et les diagrammes de colonnes du MACD permet de vérifier davantage la dynamique.
La stratégie déclenche un signal de transaction lorsque ces indicateurs répondent à des conditions spécifiques simultanément. Par exemple, un signal de multiplication est généré lorsque l’EMA à court terme est traversée par l’EMA à long terme, le RSI est en dessous du niveau de surachat et le tableau MACD est au-dessus de la ligne de signal. Les conditions opposées déclenchent un signal de short.
En outre, la stratégie intègre un mécanisme de stop-loss à pourcentage, permettant aux traders de définir des niveaux de stop-loss et de stop-loss appropriés en fonction de leurs préférences en matière de risque. L’introduction d’un ratio risque/rendement optimise encore davantage la stratégie de gestion des fonds.
Avantages stratégiques
- Synergie multi-indicateurs: en combinant le RSI, l’EMA et le MACD, la stratégie permet d’analyser le marché sous plusieurs angles et d’améliorer la fiabilité du signal.
- Gestion de fonds flexible: la définition du pourcentage de stop loss et du rapport entre le risque et le rendement permet de modifier la stratégie en fonction des différentes conditions du marché et des préférences de risque personnelles.
- Le suivi de la tendance est associé à la dynamique: les EMA croisées fournissent un signal de tendance, tandis que le RSI et le MACD complètent le facteur dynamique pour aider à capturer les tendances fortes du marché.
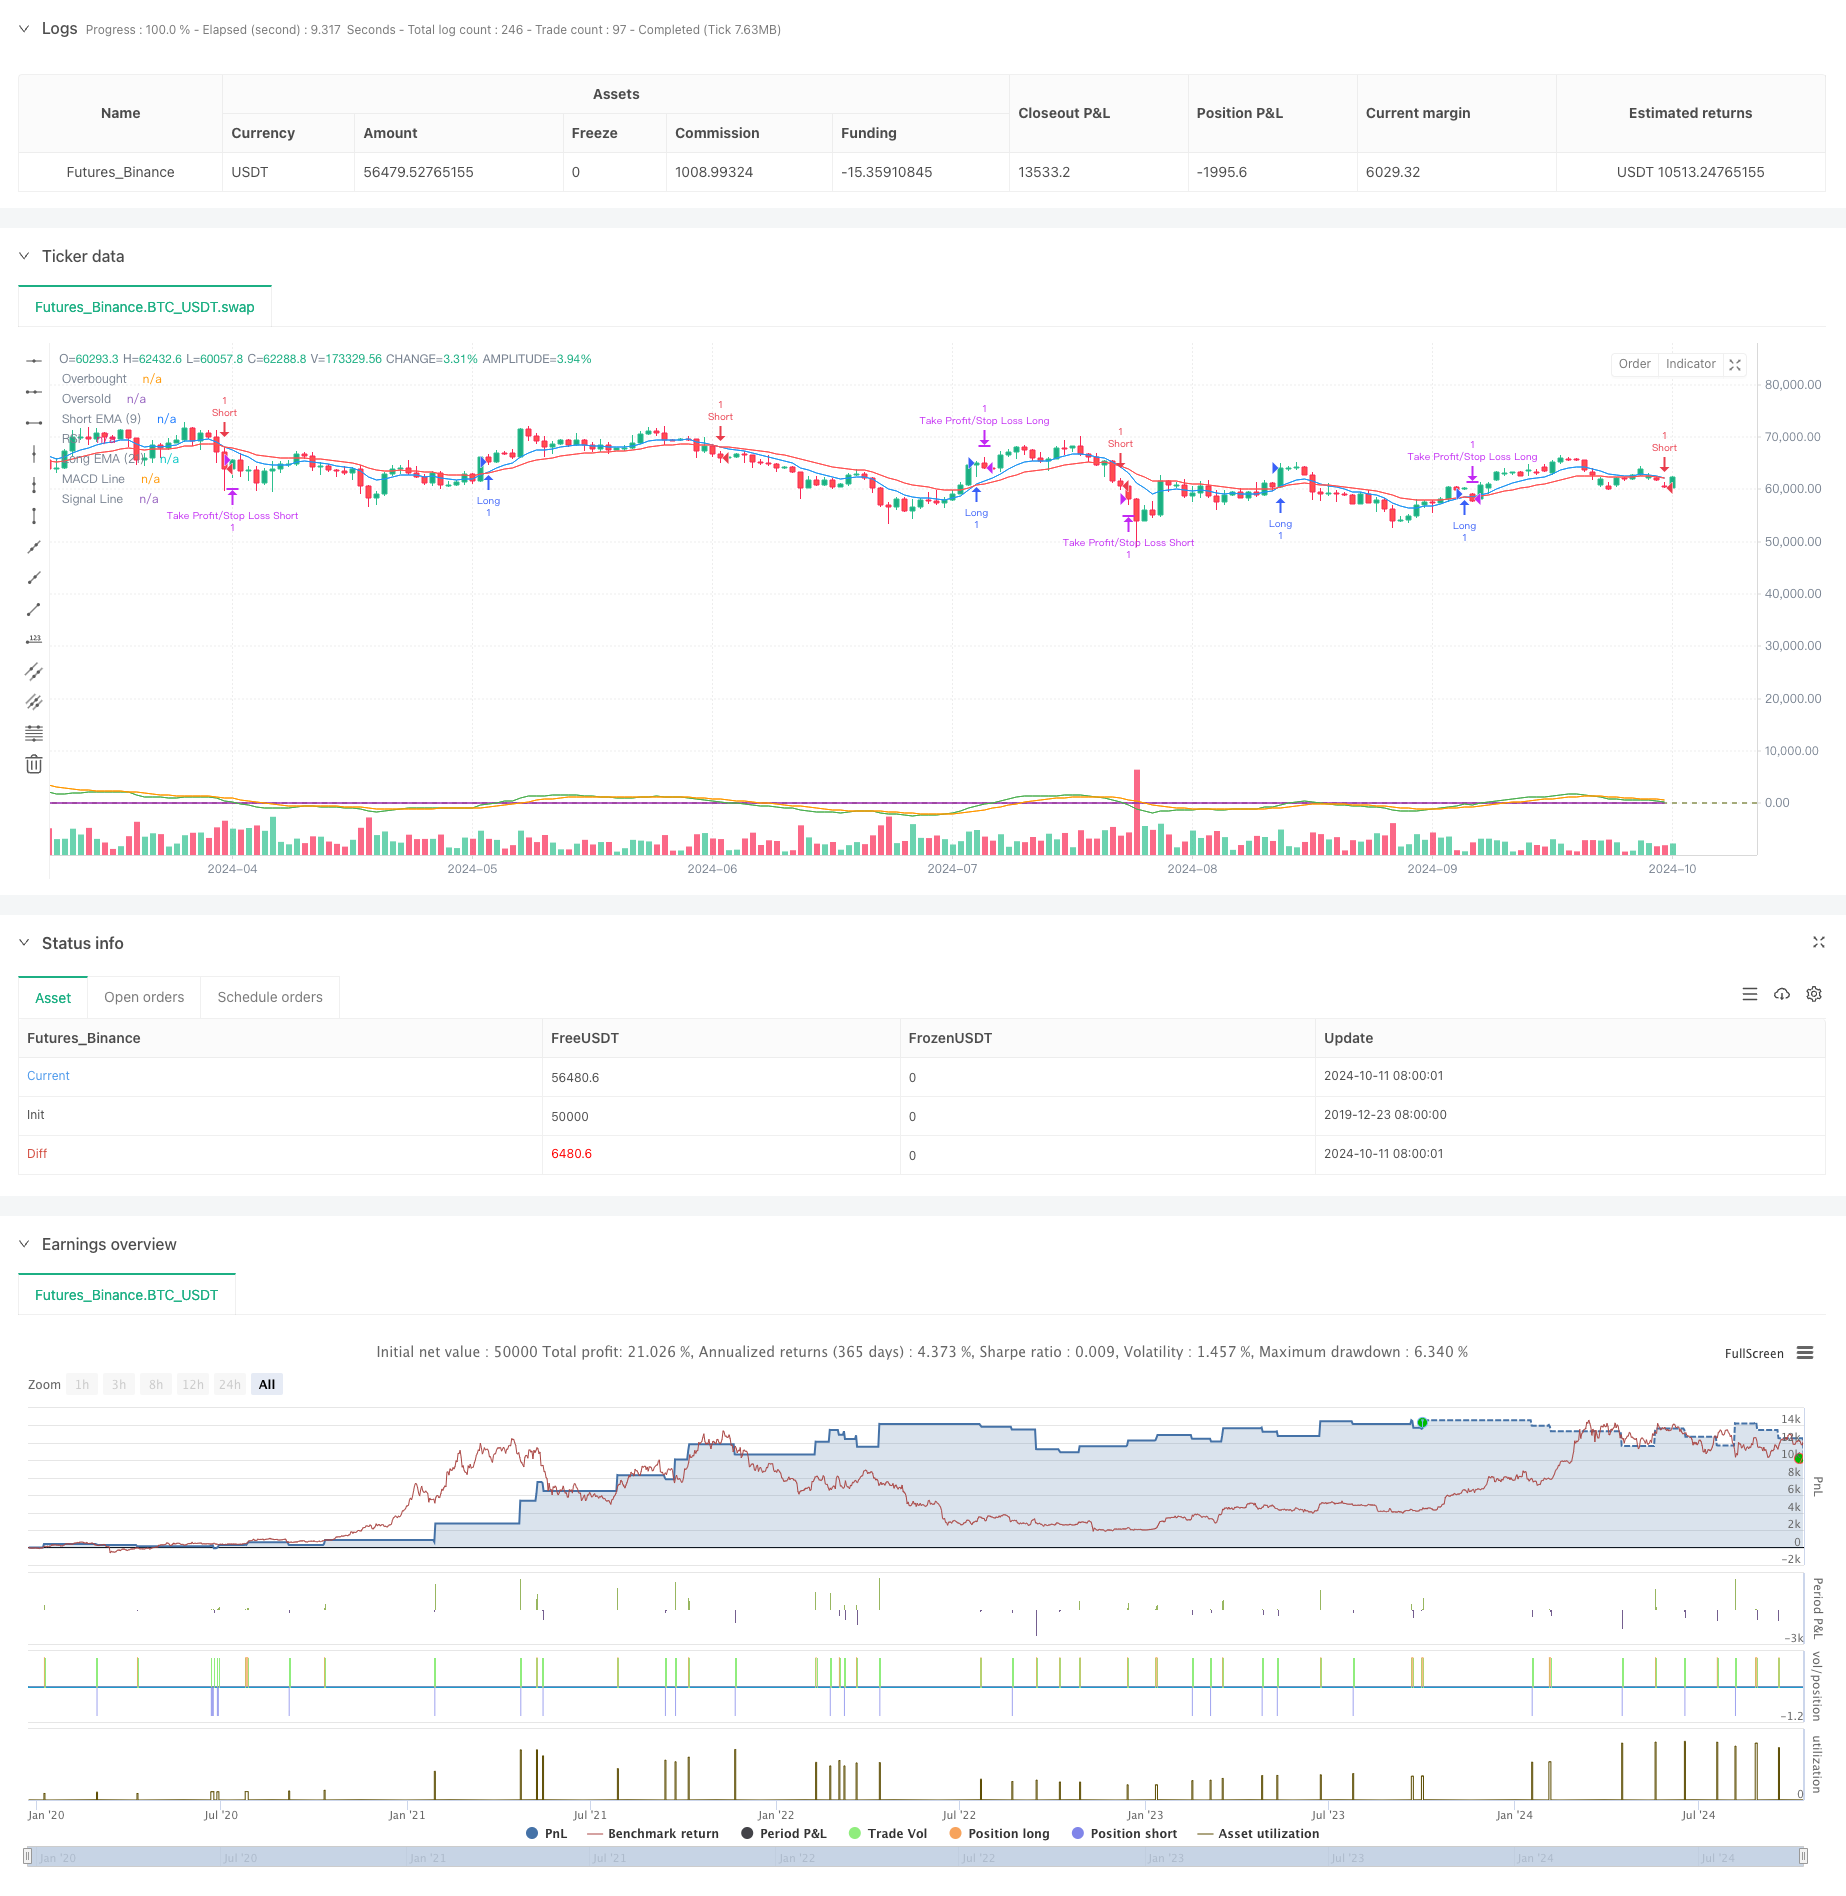
- Support visuel: la stratégie présente les indicateurs clés sur des graphiques pour aider les traders à comprendre intuitivement l’état du marché et la logique de la stratégie.
- Paramètres ajustables: les périodes et les seuils des indicateurs principaux peuvent être ajustés via des paramètres d’entrée, ce qui augmente l’adaptabilité de la stratégie.
Risque stratégique
- Surtrades: Dans un marché en crise, plusieurs indicateurs peuvent souvent émettre des signaux contradictoires, ce qui conduit à des surtrades.
- Rarité: tous les indicateurs utilisés sont essentiellement des indicateurs en retard, qui peuvent être en retard dans un marché en évolution rapide.
- Risque de fausse rupture: les stratégies croisées EMA sont vulnérables au bruit du marché et peuvent générer de fausses signaux de rupture.
- Sensitivité aux paramètres: la performance d’une stratégie est fortement dépendante des paramètres choisis, et différents paramètres peuvent être définis différemment selon les environnements de marché.
- Le manque de prise en compte de l’émotion du marché: la stratégie est basée sur des indicateurs techniques, sans tenir compte des facteurs fondamentaux et de l’émotion du marché, et pourrait mal fonctionner en cas d’événements majeurs.
Orientation de l’optimisation de la stratégie
- Introduction d’un filtre à volatilité: l’ajout de l’indicateur ATR (true amplitude) peut être envisagé pour réduire la fréquence des transactions dans un environnement à faible volatilité et améliorer la qualité du signal.
- Ajouter des filtres de force de tendance: par exemple, utiliser l’ADX (indicateur de tendance moyenne) pour s’assurer de ne négocier que dans les tendances fortes et éviter de négocier fréquemment dans les marchés en turbulence.
- Stop loss dynamique: le niveau de stop loss peut être ajusté en fonction de la dynamique de la volatilité du marché, par exemple en utilisant le multiple de l’ATR.
- Filtrage temporel: augmentation de la limite des fenêtres de temps de négociation, en évitant les périodes d’ouverture et de clôture plus volatiles.
- Ajouter l’analyse de la quantité de transaction: vérifier l’efficacité de la tendance des prix en combinant des indicateurs de la quantité de transaction, tels que l’OBV (l’onde d’énergie) ou le CMF (l’indicateur des flux de capitaux).
- Optimisation par apprentissage automatique: utilisation d’algorithmes d’apprentissage automatique pour ajuster et optimiser dynamiquement les paramètres de la stratégie afin de s’adapter à un environnement de marché en constante évolution.
Résumer
La stratégie offre aux traders un système de trading complet en utilisant des indicateurs techniques tels que le RSI, l’EMA et le MACD, combinés à un mécanisme de stop-loss flexible. L’avantage de la stratégie réside dans sa capacité à analyser le marché sous plusieurs angles et sa méthode de gestion du risque flexible. Cependant, comme toutes les stratégies de trading, elle est également exposée à des risques tels que l’excès de trading et la sensibilité aux paramètres.
/*backtest
start: 2019-12-23 08:00:00
end: 2024-10-12 08:00:00
period: 1d
basePeriod: 1d
exchanges: [{"eid":"Futures_Binance","currency":"BTC_USDT"}]
*/

//@version=5
strategy("Crypto Futures Day Trading with Profit/Limit/Loss", overlay=true, margin_long=100, margin_short=100)

// Parameters for the strategy
rsiPeriod = input.int(14, title="RSI Period")
rsiOverbought = input.int(70, title="RSI Overbought Level")
rsiOversold = input.int(30, title="RSI Oversold Level")
emaShortPeriod = input.int(9, title="Short EMA Period")
emaLongPeriod = input.int(21, title="Long EMA Period")
macdFastLength = input.int(12, title="MACD Fast Length")
macdSlowLength = input.int(26, title="MACD Slow Length")
macdSignalSmoothing = input.int(9, title="MACD Signal Smoothing")

// Parameters for Take Profit, Stop Loss, and Limit
takeProfitPercent = input.float(3, title="Take Profit %", step=0.1) // 3% by default
stopLossPercent = input.float(1, title="Stop Loss %", step=0.1) // 1% by default
limitRiskRewardRatio = input.float(2, title="Risk/Reward Ratio", step=0.1) // Example: 2:1 ratio

// Calculate RSI
rsi = ta.rsi(close, rsiPeriod)

// Calculate EMA (Exponential Moving Average)
emaShort = ta.ema(close, emaShortPeriod)
emaLong = ta.ema(close, emaLongPeriod)

// Calculate MACD
[macdLine, signalLine, _] = ta.macd(close, macdFastLength, macdSlowLength, macdSignalSmoothing)

// Calculate take profit and stop loss levels
takeProfitLong = strategy.position_avg_price * (1 + takeProfitPercent / 100)
stopLossLong = strategy.position_avg_price * (1 - stopLossPercent / 100)

takeProfitShort = strategy.position_avg_price * (1 - takeProfitPercent / 100)
stopLossShort = strategy.position_avg_price * (1 + stopLossPercent / 100)

// Entry conditions for long position
longCondition = ta.crossover(emaShort, emaLong) and rsi < rsiOverbought and macdLine > signalLine
if (longCondition)
    strategy.entry("Long", strategy.long)

// Exit conditions for long position based on stop loss and take profit
strategy.exit("Take Profit/Stop Loss Long", from_entry="Long", limit=takeProfitLong, stop=stopLossLong)

// Entry conditions for short position
shortCondition = ta.crossunder(emaShort, emaLong) and rsi > rsiOversold and macdLine < signalLine
if (shortCondition)
    strategy.entry("Short", strategy.short)

// Exit conditions for short position based on stop loss and take profit
strategy.exit("Take Profit/Stop Loss Short", from_entry="Short", limit=takeProfitShort, stop=stopLossShort)

// Plot EMA lines on the chart
plot(emaShort, color=color.blue, title="Short EMA (9)")
plot(emaLong, color=color.red, title="Long EMA (21)")

// Plot MACD and signal lines in a separate window
plot(macdLine, color=color.green, title="MACD Line")
plot(signalLine, color=color.orange, title="Signal Line")

// Plot RSI
hline(rsiOverbought, "Overbought", color=color.red)
hline(rsiOversold, "Oversold", color=color.green)
plot(rsi, color=color.purple, title="RSI")