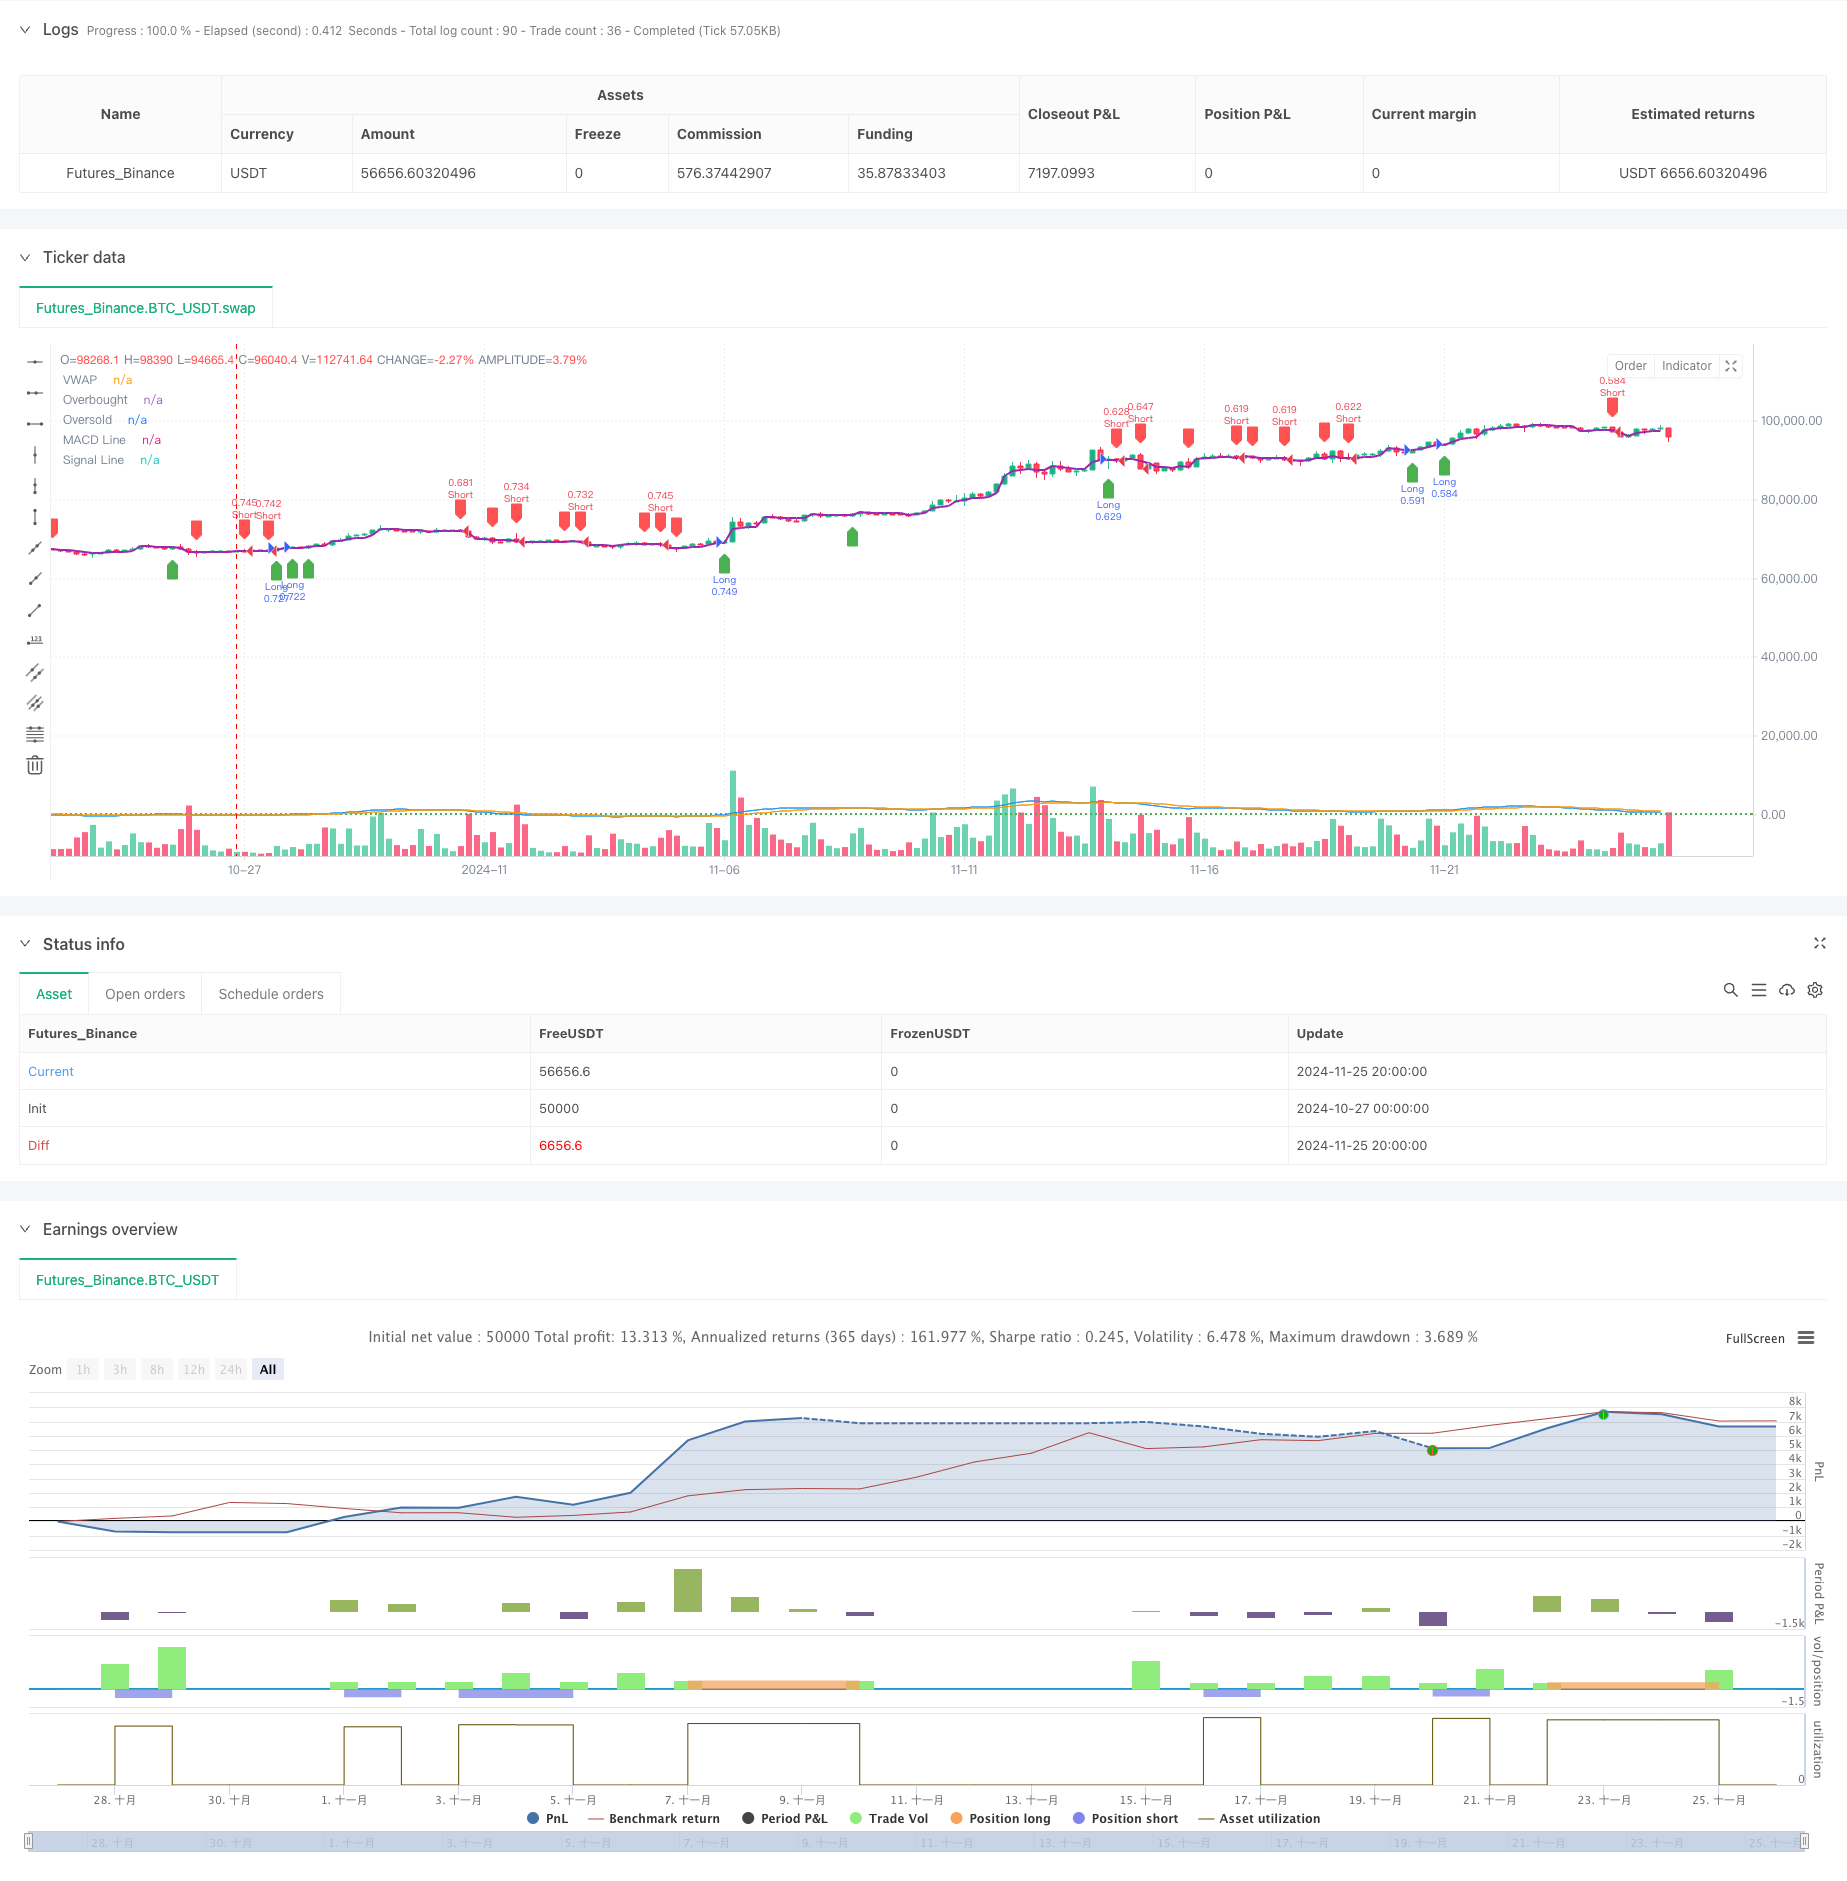
Aperçu
Il s’agit d’une stratégie de négociation quantitative basée sur le triple indicateur technique VWAP, MACD et RSI. La stratégie identifie les opportunités de vente et de vente sur le marché en combinant les signaux multiples de la moyenne pondérée de la transaction (VWAP), de la moyenne mobile convergente et diffuse (MACD) et de l’indicateur de la faiblesse relative (RSI). La stratégie utilise un mécanisme de stop-loss pour gérer le risque et utilise la gestion de position stratégique pour optimiser l’utilisation des fonds.
Principe de stratégie
La logique centrale de la stratégie est basée sur une analyse globale de trois indicateurs principaux:
- Utilisation du VWAP comme principale ligne de référence de tendance, considérée comme un signal de conversion de tendance potentielle lorsque le prix dépasse le VWAP
- Le graphique en colonnes du MACD est utilisé pour confirmer la force et la direction d’une tendance, une valeur positive indiquant une tendance à la hausse et une valeur négative indiquant une tendance à la baisse.
- Le RSI est utilisé pour identifier si le marché est en survente ou en survente, afin d’éviter une entrée dans des situations extrêmes.
Les conditions d’achat doivent être remplies:
- Les prix ont dépassé le VWAP
- Le MACD est positif.
- Le RSI n’a pas atteint le niveau de survente
Les conditions de vente doivent être remplies:
- Les prix ont dépassé le VWAP
- Le graphique MACD est négatif
- Le RSI n’a pas atteint le niveau de survente
Avantages stratégiques
- Vérification croisée de multiples indicateurs techniques pour améliorer la fiabilité du signal
- L’introduction d’un facteur de transaction permettant une analyse plus approfondie du marché grâce au VWAP
- Le RSI filtre les tendances extrêmes pour réduire le risque de faux-breech
- Le stop-loss est un pourcentage qui s’adapte dynamiquement à différentes gammes de prix.
- position sizing basé sur le ratio de valeur nette des comptes, permettant une gestion dynamique des positions
- La logique de la stratégie est claire, facile à comprendre et à maintenir
Risque stratégique
- La volatilité du marché pourrait entraîner des transactions fréquentes et augmenter les coûts de transaction
- Les multiples indicateurs peuvent entraîner des retards de signal et affecter le temps d’entrée.
- Le stop loss à pourcentage fixe peut ne pas être adapté à toutes les conditions du marché.
- Les variations de la volatilité du marché ne sont pas prises en compte et peuvent augmenter le risque pendant les périodes de forte volatilité.
- Le manque de filtrage de la force de la tendance peut générer trop de signaux dans un marché en tendance faible
Orientation de l’optimisation de la stratégie
- Introduction d’ATR dynamique pour ajuster la marge de stop-loss afin de mieux répondre aux fluctuations du marché
- Ajout d’un filtre d’intensité de tendance pour réduire les faux signaux de choc
- Optimiser les paramètres de cycle VWAP pour prendre en compte les combinaisons de cycles VWAP multiples
- Introduction d’un mécanisme de confirmation de la quantité de marchandises et amélioration de la fiabilité du signal de rupture
- Pensez à ajouter un filtrage temporel pour éviter de négocier pendant les périodes de faible liquidité
- Un mécanisme de dimensionnement de position adapté dynamiquement aux conditions du marché
Résumer
La stratégie a été conçue en mettant l’accent sur la fiabilité des signaux et la gestion des risques pour améliorer la qualité des transactions grâce à la vérification croisée de multiples indicateurs. Bien qu’il y ait des aspects à optimiser, le cadre global est raisonnable et a une bonne extensibilité. Il est recommandé aux traders de tester les performances de la stratégie de vérification dans différents environnements de marché et d’optimiser les paramètres en fonction des besoins spécifiques avant de l’utiliser dans le monde réel.
/*backtest
start: 2024-10-27 00:00:00
end: 2024-11-26 00:00:00
period: 4h
basePeriod: 4h
exchanges: [{"eid":"Futures_Binance","currency":"BTC_USDT"}]
*/

//@version=5
strategy("pbs", overlay=true, default_qty_type=strategy.percent_of_equity, default_qty_value=100)

// Input for take-profit and stop-loss
takeProfitPercent = input.float(0.5, title="Take Profit (%)", step=0.1) / 100
stopLossPercent = input.float(0.25, title="Stop Loss (%)", step=0.1) / 100


macdFastLength = input.int(12, title="MACD Fast Length")
macdSlowLength = input.int(26, title="MACD Slow Length")
macdSignalLength = input.int(9, title="MACD Signal Length")


rsiLength = input.int(14, title="RSI Length")
rsiOverbought = input.int(70, title="RSI Overbought Level", step=1)
rsiOversold = input.int(30, title="RSI Oversold Level", step=1)


vwap = ta.vwap(close)


[macdLine, signalLine, _] = ta.macd(close, macdFastLength, macdSlowLength, macdSignalLength)
macdHistogram = macdLine - signalLine

rsi = ta.rsi(close, rsiLength)


plot(vwap, color=color.purple, linewidth=2, title="VWAP")
hline(rsiOverbought, "Overbought", color=color.red, linestyle=hline.style_dotted)
hline(rsiOversold, "Oversold", color=color.green, linestyle=hline.style_dotted)
plot(macdLine, color=color.blue, title="MACD Line")
plot(signalLine, color=color.orange, title="Signal Line")

// Buy Condition
longCondition = ta.crossover(close, vwap) and macdHistogram > 0 and rsi < rsiOverbought

// Sell Condition
shortCondition = ta.crossunder(close, vwap) and macdHistogram < 0 and rsi > rsiOversold

// Execute trades based on conditions
if (longCondition)
    strategy.entry("Long", strategy.long)
    strategy.exit("Take Profit/Stop Loss", "Long", limit=close * (1 + takeProfitPercent), stop=close * (1 - stopLossPercent))

if (shortCondition)
    strategy.entry("Short", strategy.short)
    strategy.exit("Take Profit/Stop Loss", "Short", limit=close * (1 - takeProfitPercent), stop=close * (1 + stopLossPercent))

// Plot Buy/Sell Signals
plotshape(series=longCondition, location=location.belowbar, color=color.green, style=shape.labelup, title="Buy Signal")
plotshape(series=shortCondition, location=location.abovebar, color=color.red, style=shape.labeldown, title="Sell Signal")