कमोडिटी फ्यूचर्स वॉल्यूम फुटप्रिंट चार्ट का विश्लेषण और निष्पादन
लेखक:अच्छाई, बनाया गयाः 2020-07-03 11:06:48, अद्यतन किया गयाः 2023-10-28 15:30:11
सारांश
क्वांटम फुटप्रिंट चार्ट एक उन्नत चार्ट विश्लेषण उपकरण है, जिसका अंग्रेजी नाम
क्वांटम पदचिह्न क्या है?
सरल शब्दों में, क्वांटम फुटप्रिंट विभिन्न मूल्य स्तरों पर खरीदारों और विक्रेताओं के साथ क्या होता है, इसका सूक्ष्म विश्लेषण करके बाजार पारदर्शिता प्रदान करता है।
- के-लाइन मूल्य
- सक्रिय खरीद मात्रा (ASK)
- सक्रिय बिक्री मात्रा (बीआईडी)
- संतुलन अनुपात

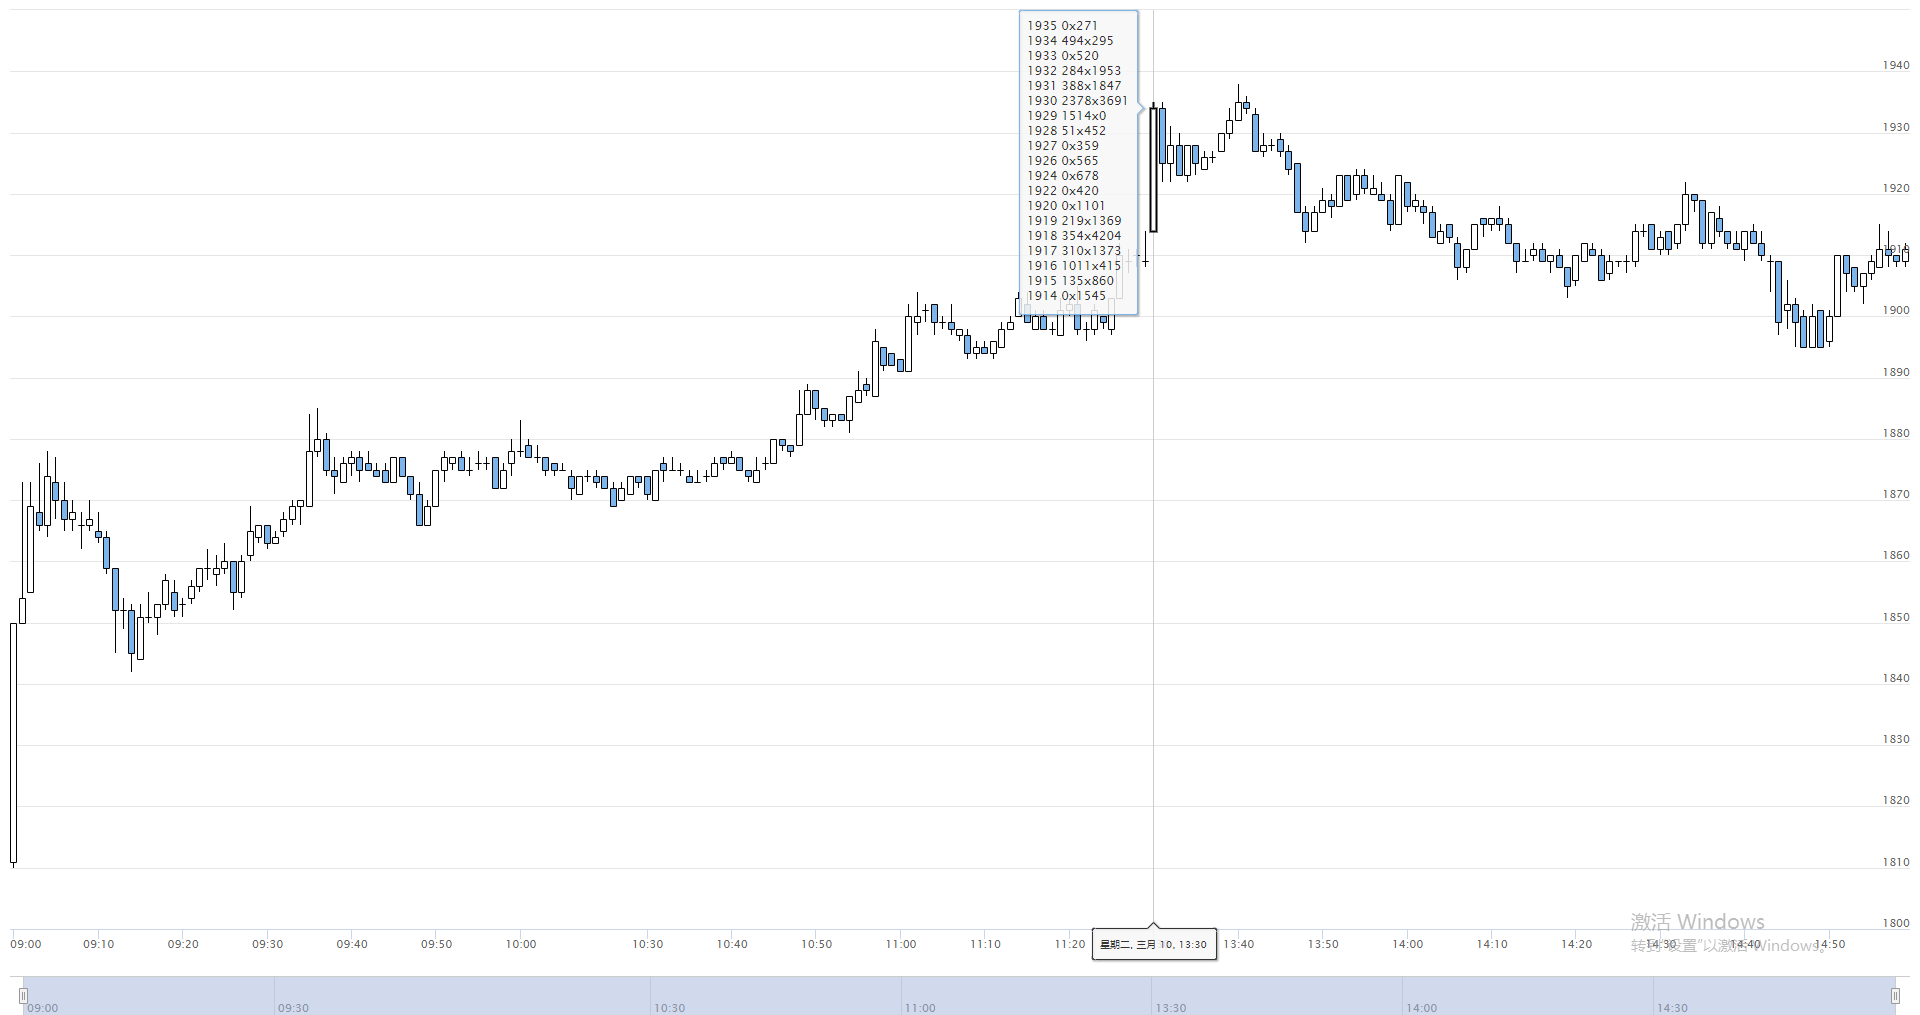
जैसा कि ऊपर चित्र में दिखाया गया है, यह ट्रेडिंग प्लेटफॉर्म पर लागू किए गए मात्रात्मक ऊर्जा पदचिह्न चार्ट का एक प्रदर्शन संस्करण हैFMZ.COMइसकी गणना वास्तविकtickबाजार. विस्तृत डेटा K रेखा से जुड़ा हुआ है. जब माउस K रेखा पर होवर करता है, तो मात्रात्मक ऊर्जा पदचिह्न डेटा प्रस्तुत किया जा सकता है। नीले वर्ग में डेटा इसकी गणना का परिणाम है, जो कुल मिलाकर दो स्तंभों में विभाजित है, और बाएं स्तंभ वर्तमान K रेखा के सभी मूल्य बिंदु हैं, जो बड़े से छोटे तक क्रम में व्यवस्थित हैं। दाएं स्तंभ प्रत्येक मूल्य स्तर के लिए व्यापारिक मात्रा है, जिसे खरीद व्यापारिक मात्रा और बिक्री व्यापारिक मात्रा में विभाजित किया गया है, जिसे
क्वांटम ऊर्जा पदचिह्न की भूमिका
सोचिए कि कीमत में वृद्धि का कारण क्या है? इसका उत्तर सरल है... खरीदार और विक्रेता। यदि विक्रेताओं की तुलना में अधिक खरीदार हैं, तो कीमत बढ़ेगी; यदि खरीदारों की तुलना में अधिक विक्रेता हैं, तो कीमत गिर जाएगी। यदि विक्रेताओं की वर्तमान संख्या खरीद की कीमतों की संख्या के लगभग बराबर है, तो बाजार एक अस्थिर प्रवृत्ति दिखाएगा, अर्थात बाजार संतुलित स्थिति में है। एक बार बड़े खरीदार या विक्रेता दिखाई देने के बाद, यह संतुलन टूट जाएगा, और फिर ऊर्जा पदचिह्न मानचित्र सक्रिय खरीद और बिक्री का एक चरम अनुपात दिखाएगा।
ऊर्जा पदचिह्न गतिशील रूप से टिक डेटा के आधार पर प्रदर्शित किया जाता है, इसलिए यह विशेष रूप से अल्पकालिक इंट्राडे ट्रेडिंग के लिए उपयुक्त है। ट्रेडर मूल्य में उतार-चढ़ाव के कारणों या कानूनों की व्याख्या करने और अपनी खुद की ट्रेडिंग रणनीतियों को अनुकूलित करने के लिए प्रत्येक मूल्य पर सक्रिय व्यापारिक मात्रा को सटीक रूप से देख सकते हैं। उदाहरण के लिएः यदि बाएं ओर की खरीद मात्रा दाईं ओर की बिक्री मात्रा से बहुत अधिक है, तो इसका मतलब है कि बाजार के प्रतिभागी सक्रिय रूप से खरीद रहे हैं, और भविष्य में कीमत बढ़ सकती है; अन्यथा, यदि दाईं ओर की बिक्री मात्रा बाएं ओर की खरीद मात्रा से बहुत अधिक है, तो इसका मतलब है कि बाजार के प्रतिभागियों के सक्रिय रूप से बेचने के साथ, भविष्य में कीमतें गिर सकती हैं।
क्वांटम ऊर्जा पदचिह्न का सिद्धांत
क्वांटम एनर्जी फुटप्रिंट का गणना सिद्धांत वॉल्यूम और बाजार डेटा से आता है। बाजार के मूल्य परिवर्तन के अनुसार वास्तविक समय में वर्तमान वॉल्यूम की गणना की जाती है। यदि बाजार मूल्य बढ़ता है, तो वॉल्यूम को सक्रिय खरीद के रूप में दर्ज किया जाता है; यदि बाजार मूल्य गिरता है, तो वॉल्यूम को सक्रिय रूप से बेचने के रूप में दर्ज किया जाता है। एफएमजेड ऊर्जा फुटप्रिंट ग्राफ में,Tickवास्तविक समय में गणना की जाएगी ताकि प्रत्येक कंपनी के कारोबार की सटीक गणना की जा सके।Tick.
क्वांटम ऊर्जा पदचिह्न कोड कार्यान्वयन
/*backtest
start: 2020-03-10 00:00:00
end: 2020-03-10 23:59:00
period: 1h
exchanges: [{"eid":"Futures_CTP","currency":"FUTURES"}]
mode: 1
*/

var NewFuturesTradeFilter = function (period) {
    var self = {} // Create an object
    self.c = Chart({ // Create "Chart" chart
        tooltip: {
            xDateFormat:'%Y-%m-%d %H:%M:%S, %A',
            pointFormat:'{point.tips}'
        },
        series: [{
            name: exchange.GetName(),
            type:'candlestick',
            data: []
        }]
    })
    self.c.reset() // clear chart data
    self.pre = null // used to record the last data
    self.records = []
    self.feed = function (ticker) {
        if (!self.pre) {// If the previous data is not true
            self.pre = ticker // Assign the latest data
        }
        var action ='' // Mark as empty string
        Log('ticker', ticker)
        Log('pre', self.pre)
        if (ticker.Last >= self.pre.Sell) {// If the last price of the latest data is greater than or equal to the selling price of the previous data
            action ='buy' // mark as buy
        } else if (ticker.Last <= self.pre.Buy) {// If the last price of the latest data is less than or equal to the bid price of the previous data
            action ='sell' // mark as sell
        } else {
            if (ticker.Last >= ticker.Sell) {// If the last price of the latest data is greater than or equal to the selling price of the latest data
                action ='buy' // mark as buy
            } else if (ticker.Last <= ticker.Buy) {// If the last price of the latest data is less than or equal to the buying price of the latest data
                action ='sell' // mark as "sell"
            } else {
                action ='both' // Mark as "both"
            }
        }
        // reset volume
        if (ticker.Volume <self.pre.Volume) {// If the volume of the latest data is less than the volume of the previous data
            self.pre.Volume = 0 // Assign the volume of the previous data to 0
        }
        var amount = ticker.Volume-self.pre.Volume // the volume of the latest data minus the volume of the previous data
        if (action !='' && amount> 0) {// If the tag is not an empty string and the action is greater than 0
            var epoch = parseInt(ticker.Time / period) * period // Calculate the K-line timestamp and round it
            var bar = null
            var pos = undefined
            if (
                self.records.length == 0 || // If the K-line length is 0 or the last K-line timestamp is less than "epoch"
                self.records[self.records.length-1].time <epoch
            ) {
                bar = {
                    time: epoch,
                    data: {},
                    open: ticker.Last,
                    high: ticker.Last,
                    low: ticker.Last,
                    close: ticker.Last
                } // Assign the latest data to bar
                self.records.push(bar) // Add bar to the records array
            } else {// reassign bar
                bar = self.records[self.records.length-1] // the last bar of the previous data
                bar.high = Math.max(bar.high, ticker.Last) // the maximum price of the last bar of the previous data and the maximum value of the last price of the latest data
                bar.low = Math.min(bar.low, ticker.Last) // The minimum price of the last bar of the previous data and the minimum value of the last price of the latest data
                bar.close = ticker.Last // last price of latest data
                pos = -1
            }
            if (typeof bar.data[ticker.Last] ==='undefined') {// If the data is empty
                bar.data[ticker.Last] = {// reassign value
                    buy: 0,
                    sell: 0
                }
            }
            if (action =='both') {// If the token is equal to both
                bar.data[ticker.Last]['buy'] += amount // buy accumulation
                bar.data[ticker.Last]['sell'] += amount // sell accumulated
            } else {
                bar.data[ticker.Last][action] += amount // mark accumulation
            }
            var tips =''
            Object.keys(bar.data) // Put the keys in the object into an array
                .sort() // sort
                .reverse() // Reverse the order in the array
                .forEach(function (p) {// traverse the array
                    tips +='<br>' + p + '' + bar.data[p].sell +'x' + bar.data[p].buy
                })
            self.c.add( // Add data
                0, {
                    x: bar.time,
                    open: bar.open,
                    high: bar.high,
                    low: bar.low,
                    close: bar.close,
                    tips: tips
                },
                pos
            )
        }
        self.pre = ticker // reassign
    }
    return self // return object
}


// program entry
function main() {
    Log(_C(exchange.SetContractType,'MA888')) // subscription data
    var filt = NewFuturesTradeFilter(60000) // Create an object
    while (true) {// Enter loop mode
        var ticker = exchange.GetTicker() // Get exchange tick data
        if (ticker) {// If the Tick data is successfully obtained
            filt.feed(ticker) // Start processing data
        }
    }
}
क्वांटम पदचिह्न कोड डाउनलोड करें
मात्रात्मक कोड फुटप्रिंट चार्ट रणनीति कोड कोFMZ.comमंच, और साधारण उपयोगकर्ता इसे सेटिंग के बिना उपयोग कर सकते हैं।https://www.fmz.com/strategy/189965
संक्षेप में
वास्तविक उपयोग में, ऊर्जा पदचिह्न मानचित्र मात्रा के परिप्रेक्ष्य से धन के प्रवाह का विश्लेषण भी कर सकता है। चाहे वह बड़े पैमाने पर रुझानों की दिशा या दिन की अल्पकालिक दिशा का विश्लेषण करने के लिए हो, यह एक महत्वपूर्ण भूमिका निभाता है। हालांकि, यह ध्यान दिया जाना चाहिए कि तथाकथित पूंजी प्रवाह यहां धन के प्रवेश और निकास को संदर्भित नहीं करता है, बल्कि बाजार की खरीद और बिक्री की इच्छा और मुख्य खिलाड़ियों और खुदरा निवेशकों के खेल व्यवहार को दर्शाता है।
- DEX एक्सचेंज क्वांटिफाइड प्रैक्टिस ((1)-- dYdX v4 उपयोग गाइड
- डिजिटल मुद्रा में लीड-लैग सूट का परिचय (3)
- क्रिप्टोकरेंसी में लीड-लैग आर्बिट्रेज का परिचय (2)
- डिजिटल मुद्राओं में लीड-लैग सूट का परिचय (2)
- एफएमजेड प्लेटफॉर्म के बाहरी सिग्नल रिसेप्शन पर चर्चाः रणनीति में अंतर्निहित एचटीपी सेवा के साथ सिग्नल प्राप्त करने के लिए एक पूर्ण समाधान
- एफएमजेड प्लेटफॉर्म के लिए बाहरी सिग्नल प्राप्त करने का अन्वेषणः रणनीति अंतर्निहित एचटीटीपी सेवा के लिए सिग्नल प्राप्त करने के लिए पूर्ण समाधान
- क्रिप्टोकरेंसी में लीड-लैग आर्बिट्रेज का परिचय (1)
- डिजिटल मुद्रा में लीड-लैग सूट का परिचय (1)
- एफएमजेड प्लेटफॉर्म के बाहरी सिग्नल रिसेप्शन पर चर्चाः विस्तारित एपीआई बनाम रणनीति अंतर्निहित एचटीटीपी सेवा
- एफएमजेड प्लेटफॉर्म के लिए बाहरी संकेत प्राप्त करने की खोजः विस्तार एपीआई बनाम रणनीति अंतर्निहित एचटीटीपी सेवा
- रैंडम टिकर जनरेटर पर आधारित रणनीति परीक्षण पद्धति पर चर्चा
- ग्राफिकल मार्टिंगेल ट्रेडिंग रणनीति
- पायथन संस्करण आइसबर्ग आयोग की रणनीति
- क्रिप्टो मुद्रा वायदा व्यापार का तर्क
- नीचे का आकार ZDZB रणनीति
- मल्टी-रोबोट बाजार साझा समाधान
- ARMA-EGARCH मॉडल के आधार पर बिटकॉइन की अस्थिरता का मॉडलिंग और विश्लेषण
- जावास्क्रिप्ट रणनीति डिजाइन में संख्यात्मक गणना सटीकता समस्या का समाधान
- एक स्थानीय फ़ाइल में पायथन रणनीति को कैप्सूल करने के लिए आप सिखाएँ
- एफएमईएक्स ट्रेडिंग से ऑर्डर वॉल्यूम का अनुकूलन होता है भाग 2
- एफएमईएक्स ट्रेडिंग ऑर्डर वॉल्यूम अनुकूलन को अनलॉक करती है
- एफएमईएक्स क्रमबद्ध अनलॉक अधिकतम न्यूनतम मात्रा अनुकूलन
- चिपचिपा इंटरफेस को बुलाकर रोबोट संदेश भेजने में सक्षम
- एफएमईएक्स लेन-देन को अनलॉक करने के लिए सबसे कम मात्रा में अनुकूलन
- सरल अस्थिरता ईएमवी रणनीति
- हाथ से हाथ मिलाकर आप एक पायथन नीति पैकेज लागत प्रभावी रूप से फ़ाइल
- विचलन दर BIAS व्यापार रणनीति
- "पाइफोलियो" उपकरण का उपयोग करके बैकटेस्ट पूंजी वक्र का मूल्यांकन
- FMZ क्वांटिफाइड माइ भाषा - इंटरफ़ेस ग्राफ
- कमोडिटी फ्यूचर्स इंटरटेम्पोरल बोलिंगर हेज रणनीति का पायथन संस्करण (केवल अध्ययन उद्देश्य)
- "ट्रेडिंग व्यू" संकेतक का उपयोग करके एफएमजेड रोबोट के साथ इंटरफेस करना