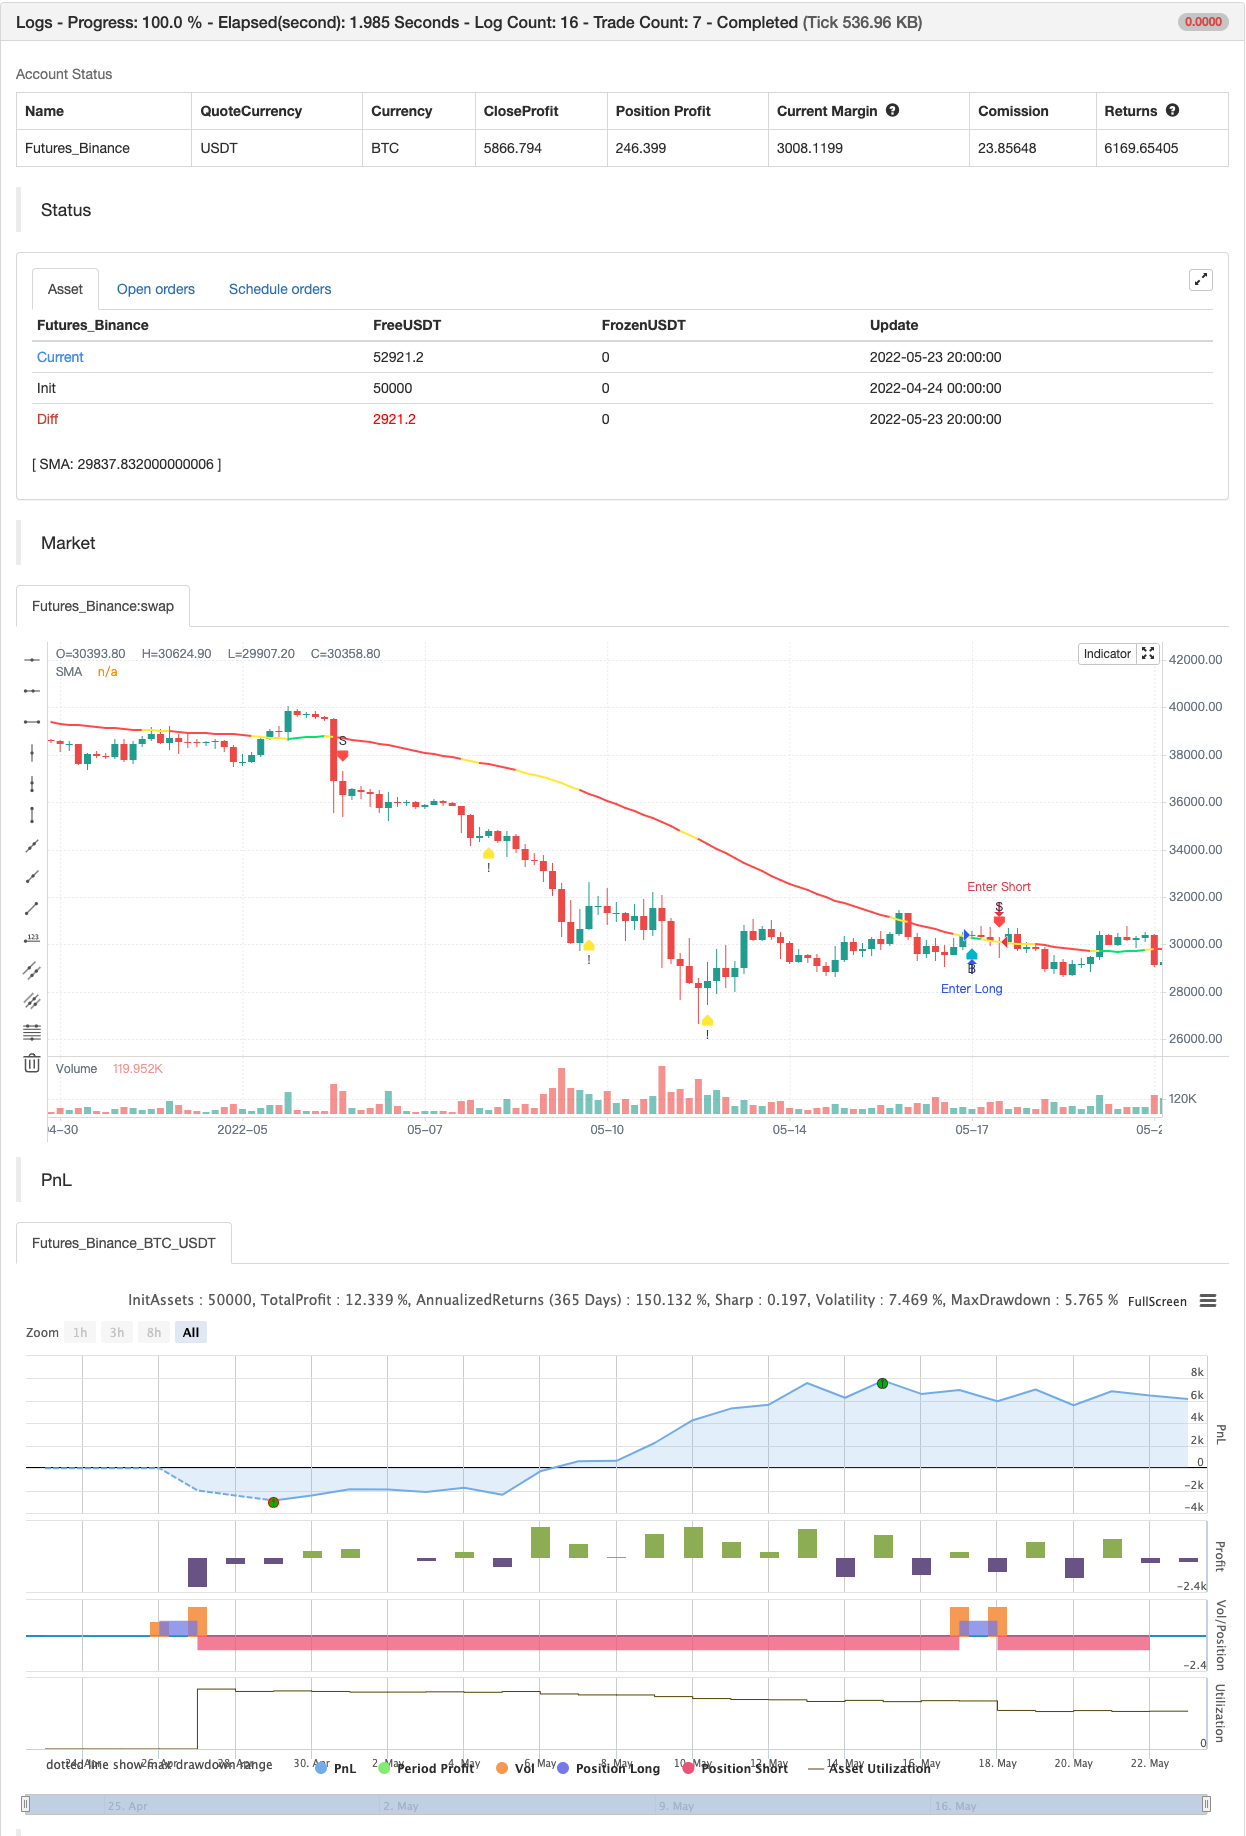
दिन के भीतर खरीद/बिक्री
लेखक:चाओझांग, दिनांकः 2022-05-25 17:44:23टैगःआरएसआईएसएमए
क्रूड ऑयल फ्यूचर कॉन्ट्रैक्ट्स के लिए एसएमए और आरएसआई ओवरबॉट/ओवरसोल्ड अलर्ट (!) के आधार पर क्रूड ऑयल फ्यूचर कॉन्ट्रैक्ट्स के लिए एसएमए और आरएसआई ओवरबॉट/ओवरसोल्ड अलर्ट (!) के आधार पर स्कैल्प सिग्नल (या इसका उपयोग अच्छी मात्रा में वॉल्यूम वाले किसी भी स्क्रिप के साथ किया जा सकता है) संभावित उलट संकेत के लिए।
यदि मोमबत्ती अलर्ट मोमबत्ती के उच्च स्तर को तोड़ती है तो ही खरीदें और यदि मोमबत्ती अलर्ट मोमबत्ती के निम्न स्तर को तोड़ती है तो बिक्री करें।
कच्चे तेल वायदा पर 3 मिनट के समय के साथ प्रदर्शन करने के लिए सबसे अच्छा
बैकटेस्ट

/*backtest
start: 2022-04-24 00:00:00
end: 2022-05-23 23:59:00
period: 4h
basePeriod: 15m
exchanges: [{"eid":"Futures_Binance","currency":"BTC_USDT"}]
*/

// This source code is subject to the terms of the Mozilla Public License 2.0 at https://mozilla.org/MPL/2.0/
// © nicks1008

//@version=4
study(title="CRUDE OIL BUY/SELL",shorttitle="CRUDE Scalp |3 Min",precision=2,overlay=true)

Rsi_value=input(14,title="RSI Length",step=1)
hl=input(75,title="Higher Value of RSI",step=1)
ll=input(25,title="Lower value of RSI",step=1)
rs=rsi(close,Rsi_value)

sma_value=input(50,title="SMA Length",step=1)
sma1=sma(close,sma_value)

dist_SMA=1
candle_length=1

mycolor= iff(rs>=hl or rs<=ll,color.yellow,iff(low> sma1,color.lime,iff(high<sma1,color.red,color.yellow)))
gaps=sma1+dist_SMA  //Gap between price and SMA for Sell
gapb=sma1-dist_SMA  //Gap between price and SMA for Buy
chartgap=gaps or gapb  //for both below or above the SMA
gap1=sma1+5
gapvalue=(open/100)*candle_length     //setting % with its Share price
gapp=(high-low)>gapvalue //or rs<50     // Condition for Min candle size to be eligible for giving signal - Buy Calls
gapp2=(high-low)>gapvalue //or rs>55    // Condition for Min candle size to be eligible for giving signal - Sell Calls
bull=open<close and (high-low)>2*gapvalue and close>(high+open)/2
bear=open>close and (high-low)>2*gapvalue and close<(low+open)/2


rev1=rs>68 and open>close and open>gaps and (high-low)>gapvalue+0.5 and low!=close      //over red candles  "S" - uptrend
rev1a=rs>90 and open<close and close>gaps and high!=close and open!=low                             // over green candles"S" - uptrend
sellrev= rev1 or rev1a

rev2=rs<50 and open<close and open<gapb and open==low  //over green candles"B"
rev3=rs<30 and open>close and high>gapb and open!=high and barstate.isconfirmed!=bear  //over red candles"B"
rev4=rs<85 and close==high and (high-low)>gapvalue and open<close    //over green candle in both trends
hlrev_s=crossunder(rs,hl)
llrev_b=crossover(rs,ll) and open<close

buycall=open<close and open>sma1 and cross(close[1],sma1) and close>sma1
sellcall=cross(close,sma1) and open>close
BUY=crossover(close[1],sma1) and close[1]>open[1] and high[0]>high[1] and close[0]>open[0]
SELL=crossunder(low[1],sma1) and close[1]<open[1] and low[0]<low[1] and close[0]<open[0]

plotshape(SELL,title="SELL",style=shape.labeldown,color=color.red,text="S",textcolor=color.black,transp=30)
plotshape(BUY,title="BUY",style=shape.labelup,color=color.aqua,text="B",textcolor=color.black,transp=30,location=location.belowbar)

plotshape(hlrev_s,title="Reversal1",style=shape.labeldown,color=color.yellow,text="!",textcolor=color.black,transp=20)
plotshape(llrev_b,title="Reversal2",style=shape.labelup,color=color.yellow,text="!",textcolor=color.black,transp=20,location=location.belowbar)

plot(sma1,title="SMA",color=mycolor,linewidth=2)
alertcondition(hlrev_s or llrev_b,title="Reversal Signal", message="Reversal Alert")
alertcondition(SELL or BUY,title="Buy/Sale Signal", message="Buy/Sell Alert")

if BUY
    strategy.entry("Enter Long", strategy.long)
else if SELL
    strategy.entry("Enter Short", strategy.short)
संबंधित सामग्री
- गतिशील स्टॉप-लॉस स्टॉप-पंप के लिए द्वि-समान-रेखा रुझान ट्रैकिंग और फ़िल्टरिंग प्रतिक्रिया रणनीति
- तुलनात्मक रूप से मजबूत और कमजोर सूचकांक औसत मूल्य रिवर्स रणनीति
- एसएमए क्रॉस रणनीति आरएसआई फ़िल्टर और अलर्ट के साथ संयुक्त है
- ब्लिंक्स ने आरएसआई तटस्थ बाजारों में व्यापार की रणनीति को मापा
- त्रिकोणीय अपेक्षाकृत मजबूत और कमजोर सूचकांक मात्रात्मक व्यापार रणनीति
- RSI ट्रेंडिंग गति ट्रेडिंग रणनीति दोहरे औसत और लेनदेन की पुष्टि के साथ
- गतिशील तंत्रिका नेटवर्क आरएसआई ट्रेड ट्रैक ट्रेडिंग रणनीति
- आरएसआई 2 रणनीति के दिन के भीतर रिवर्स जीत की दर का पुनरावलोकन
- ब्लिंक बैंड आरएसआई ट्रेडिंग रणनीति
- मल्टीपल औसत गति ट्रेंड ट्रैकिंग रणनीतियाँ
अधिक जानकारी
- सुपर ट्रेंड डेली 2.0 BF
- पतवार चलती औसत स्विंग ट्रेडर
- एफटीएसएमए - ट्रेंड आपका दोस्त है
- रेंज फ़िल्टर खरीदें और बेचें
- एसएसएल चैनल
- हुल सुइट रणनीति
- पैराबोलिक एसएआर खरीदें और बेचें
- पिवोट आधारित अनुवर्ती अधिकतम और न्यूनतम
- निक राइपॉक ट्रैलिंग रिवर्स (एनआरटीआर)
- ज़िगज़ैग पीए रणनीति V4.1
- टूटा हुआ फ्रैक्टल: किसी के टूटे हुए सपने से आपका लाभ होता है!
- मुनाफा अधिकतम करनेवाला PMax
- निर्दोष विजय रणनीति
- स्टोकैस्टिक + आरएसआई, डबल रणनीति
- स्विंग हॉल/आरएसआई/ईएमए रणनीति
- स्केलिंग स्विंग ट्रेडिंग टूल R1-4
- बेस्ट एग्लोविंग + ब्रेकआउट रणनीति
- Bollinger भयानक चेतावनी R1
- बहु-विनिमय प्लगइन
- त्रिभुज लाभ (छोटी मुद्राओं के बाजार मूल्य में अंतर)