Desain strategi lindung nilai spot cryptocurrency ((2)
Penulis:FMZ~Lydia, Dibuat: 2022-07-19 15:19:52, Diperbarui: 2023-09-24 19:34:38
Desain strategi lindung nilai spot cryptocurrency (2)
Dalam artikel sebelumnya, kita menerapkan strategi lindung nilai sederhana bersama, dan kemudian kita akan belajar bagaimana untuk meningkatkan strategi ini. Perubahan strategi tidak besar, tetapi rincian perubahan perlu perhatian. definisi beberapa tempat dalam kode telah berubah dari yang sebelumnya, yang perlu dipahami.
Kebutuhan untuk meningkatkan strategi ini
- Mengganti mode leverage objek pertukaran spot Perubahan ini hanya terkait dengan bot yang sebenarnya. Beberapa bursa spot memiliki antarmuka leverage spot, yang juga dikemas pada FMZ. Untuk objek pertukaran yang telah dikemas langsung di FMZ dan mendukung leverage spot, modus dapat beralih langsung.
- Tambahkan tampilan grafik spread
Tambahkan tampilan grafik spread, karena itu hanya menggambar garis spread dari
A exchange -> B exchange,B exchange -> A exchange, dan menggambar garis horizontal yang memicu penyebaran.line drawing class libraryuntuk menangani secara langsung, keuntungannya adalah bahwa itu mudah digunakan, di sini kita juga belajar bagaimana menggunakantemplate class libraryfungsi FMZ. - Fungsi lindung nilai satu sisi Perubahan ini bisa sangat signifikan, karena sulit untuk sepenuhnya membalikkan perbedaan harga antara dua bursa selama transaksi lindung nilai tertentu. Sebagian besar waktu harga di satu bursa secara konsisten lebih tinggi dari harga di bursa lain. Pada saat ini, jika aset kita telah sepenuhnya dilindung nilai (yaitu, koin-koin semuanya berada di bursa dengan harga rendah, dan uang berada di bursa dengan harga tinggi). lindung nilai stagnan, dan tidak lagi mungkin bergantung pada fluktuasi spread untuk menghasilkan keuntungan. Pada saat ini, kita perlu membuat strategi sehingga Anda dapat kehilangan sedikit uang untuk lindung nilai kembali (biarkan koin ada di bursa dengan harga tinggi lagi), dan ketika perbedaan harga menjadi lebih besar lagi, kita dapat terus lindung nilai dan mendapatkan keuntungan.
- Memodifikasi parameter secara interaktif seperti garis spread lindung nilai Tambahkan fungsi interaktif ke strategi untuk memodifikasi garis pemicu spread secara real time.
- Atur informasi bilah status dan tampilkannya dalam format tabel Atur data yang perlu ditampilkan agar mudah dilihat.
Selanjutnya, mari kita menerapkan desain ini satu per satu.
Ganti mode leverage objek pertukaran spot
Ambil Binance spot real bot sebagai contoh, beralih ke mode leveraged spot, gunakan kodeexchanges[i].IO, masukkan parametertrade_normaluntuk beralih ke posisi leverage per posisi, dan inputtrade_super_marginuntuk beralih ke posisi penuh leverage, backtesting tidak didukung.
Tambahkan ke fase persiapan di awalmainFungsi:
    // Switch leverage mode
    for (var i = 0 ; i < exchanges.length ; i++) {   // Traverse and detect all added exchange objects
        if (exchanges[i].GetName() == "Binance" && marginType != 0) {   //If the exchange object represented by the current i-index is Binance spot, and the parameter marginType of the strategy interface is not the option of "common currency", execute the switch operation
            if (marginType == 1) {
                Log(exchanges[i].GetName(), "Set to leveraged position-by-position")
                exchanges[i].IO("trade_normal")
            } else if (marginType == 2) {
                Log(exchanges[i].GetName(), "Set to leveraged full position")
                exchanges[i].IO("trade_super_margin")
            }
        }
    }
Strategi di sini hanya menambahkan kode untuk beralih mode leverage koin ke koin Binance spot, jadi pengaturan switch pada parameter strategi hanya berlaku untuk Binance spot.
Tambah tampilan grafik spread
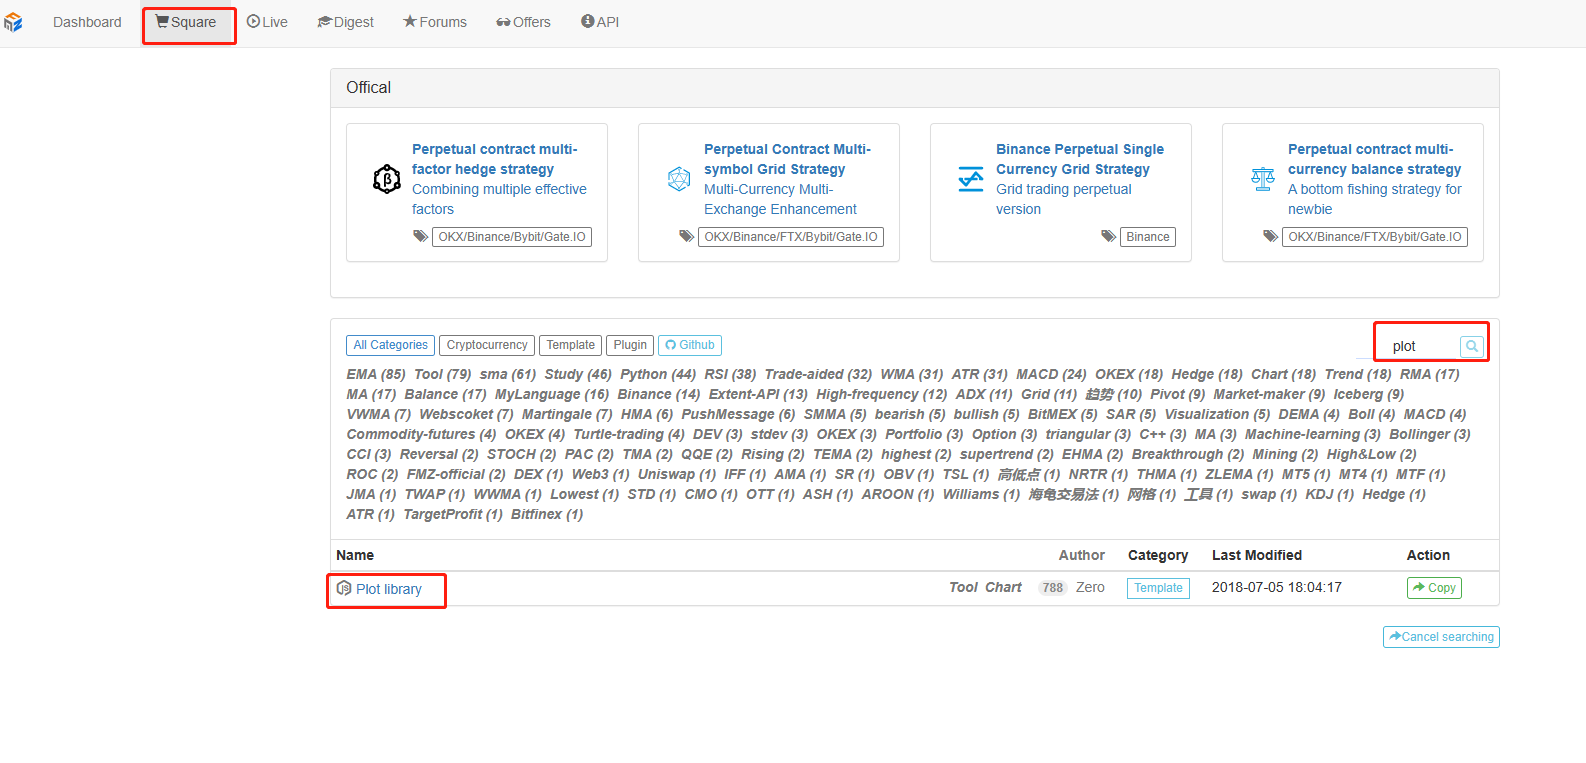
Sangat mudah untuk menggunakan template gambar yang sudah dibungkus.Line Drawing LibraryHal ini dapat diperoleh dengan mencari langsung di platform FMZ strategi persegi.

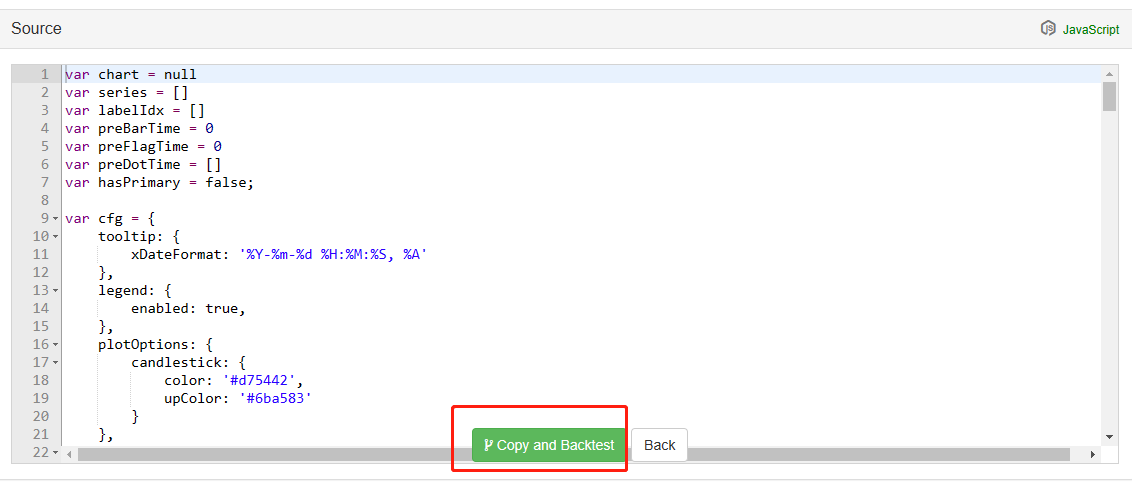
Atau klik tautan langsung:https://www.fmz.com/strategy/27293untuk melompat ke halaman salinan untuk template ini.

Klik tombol untuk menyalin perpustakaan kelas templat ini ke perpustakaan strategi Anda sendiri.

Kemudian Anda dapat memeriksa perpustakaan kelas template yang akan digunakan di kolom template di halaman pengeditan strategi. Simpan strategi setelah memeriksanya, dan strategi akan merujuk ke template ini. Ini hanya deskripsi singkat tentang penggunaan perpustakaan kelas template. Strategi ini sudah merujuk ke template ini, jadi tidak perlu mengulangi operasi. Ketika Anda menyalin strategi ini di kotak strategi, Anda dapat melihat bahwaLine Drawing Librarytelah dirujuk di bilah template di halaman pengeditan strategi.
Kita akan belajar bagaimana menggunakan fungsi dariLine Drawing Libraryuntuk menggambar grafik.

Kami berencana untuk menarik penyebaranA->B, penyebaranB->A, dan garis pemicu spread. kita perlu menggambar dua kurva (A arus ke B, B ke A spread), dua garis horizontal (garis pemicu spread), seperti yang ditunjukkan pada gambar di atas.
Karena kita ingin merancang lindung nilai sepihak, garis pemicu dariA->BdanB->AKita tidak bisa menggunakan desain dalam artikel sebelumnya.
Dalam artikel sebelumnya:
      var targetDiffPrice = hedgeDiffPrice
      if (diffAsPercentage) {
          targetDiffPrice = (depthA.Bids[0].Price + depthB.Asks[0].Price + depthB.Bids[0].Price + depthA.Asks[0].Price) / 4 * hedgeDiffPercentage
      }
Hanya ada satu penyebaran pemicutargetDiffPriceAku tidak tahu.
Jadi di sini kita harus mengubah kode, mengubah parameter pertama.

Lalu ubah kode:
        var targetDiffPriceA2B = hedgeDiffPriceA2B
        var targetDiffPriceB2A = hedgeDiffPriceB2A
        if (diffAsPercentage) {
            targetDiffPriceA2B = (depthA.Bids[0].Price + depthB.Asks[0].Price + depthB.Bids[0].Price + depthA.Asks[0].Price) / 4 * hedgeDiffPercentageA2B
            targetDiffPriceB2A = (depthA.Bids[0].Price + depthB.Asks[0].Price + depthB.Bids[0].Price + depthA.Asks[0].Price) / 4 * hedgeDiffPercentageB2A
        }
Dengan cara ini, garis pemicu perbedaan telah berubah dari sebelumnyatargetDiffPricesampai duatargetDiffPriceA2B, targetDiffPriceB2AAku tidak tahu.
Langkah selanjutnya adalah menggambar data ini pada grafik dengan menggunakan fungsi garis gambar dari perpustakaan gambar garis.
        // drawing
        $.PlotHLine(targetDiffPriceA2B, "A->B")  // The first parameter of this function is the value of the horizontal line in the Y-axis direction, and the second parameter is the display text
        $.PlotHLine(targetDiffPriceB2A, "B->A")
Ketika strategi berjalan, ada grafik seperti ini.

Selanjutnya gambar kurva spread real-time, untuk menghindari overdrawing garis.
        if (ts - lastKeepBalanceTS > keepBalanceCyc * 1000) {
            nowAccs = _C(updateAccs, exchanges)
            var isBalance = keepBalance(initAccs, nowAccs, [depthA, depthB])
            cancelAll()
            if (isBalance) {
                lastKeepBalanceTS = ts
                if (isTrade) {
                    var nowBalance = _.reduce(nowAccs, function(sumBalance, acc) {return sumBalance + acc.Balance}, 0)
                    var initBalance = _.reduce(initAccs, function(sumBalance, acc) {return sumBalance + acc.Balance}, 0)
                    LogProfit(nowBalance - initBalance, nowBalance, initBalance, nowAccs)
                    isTrade = false
                }
            }

            $.PlotLine("A2B", depthA.Bids[0].Price - depthB.Asks[0].Price)  // Draw real-time spread curves
            $.PlotLine("B2A", depthB.Bids[0].Price - depthA.Asks[0].Price)  // The first parameter is the name of the curve, and the second parameter is the value of the curve at the current moment, that is, the value in the Y-axis direction at the current moment
        }
Dengan cara ini, kode gambar hanya 4 baris, memungkinkan strategi untuk memiliki grafik ditampilkan pada saat runtime.
Fungsi lindung nilai satu sisi
Seperti yang disebutkan di atas, garis pemicu spread telah dimodifikasi menjadi dua, mengendalikan pemicu lindung nilai dariA->BdanB->ADengan cara ini, algoritma harga pesanan sebelumnya tidak dapat digunakan, dan metode penambahan harga slip ke harga pasar digunakan sebagai gantinya.
        if (depthA.Bids[0].Price - depthB.Asks[0].Price > targetDiffPriceA2B && Math.min(depthA.Bids[0].Amount, depthB.Asks[0].Amount) >= minHedgeAmount) {          // A -> B market conditions are met
            var priceSell = depthA.Bids[0].Price - slidePrice
            var priceBuy = depthB.Asks[0].Price + slidePrice
            var amount = Math.min(depthA.Bids[0].Amount, depthB.Asks[0].Amount)
            if (nowAccs[0].Stocks > minHedgeAmount && nowAccs[1].Balance * 0.8 / priceSell > minHedgeAmount) {
                amount = Math.min(amount, nowAccs[0].Stocks, nowAccs[1].Balance * 0.8 / priceSell, maxHedgeAmount)
                Log("trigger A->B:", depthA.Bids[0].Price - depthB.Asks[0].Price, priceBuy, priceSell, amount, nowAccs[1].Balance * 0.8 / priceSell, nowAccs[0].Stocks)  // Tips
                hedge(exB, exA, priceBuy, priceSell, amount)
                cancelAll()
                lastKeepBalanceTS = 0
                isTrade = true
            }
        } else if (depthB.Bids[0].Price - depthA.Asks[0].Price > targetDiffPriceB2A && Math.min(depthB.Bids[0].Amount, depthA.Asks[0].Amount) >= minHedgeAmount) {   // B -> A market conditions are met
            var priceBuy = depthA.Asks[0].Price + slidePrice
            var priceSell = depthB.Bids[0].Price - slidePrice
            var amount = Math.min(depthB.Bids[0].Amount, depthA.Asks[0].Amount)
            if (nowAccs[1].Stocks > minHedgeAmount && nowAccs[0].Balance * 0.8 / priceBuy > minHedgeAmount) {
                amount = Math.min(amount, nowAccs[1].Stocks, nowAccs[0].Balance * 0.8 / priceBuy, maxHedgeAmount)
                Log("trigger B->A:", depthB.Bids[0].Price - depthA.Asks[0].Price, priceBuy, priceSell, amount, nowAccs[0].Balance * 0.8 / priceBuy, nowAccs[1].Stocks)  //Tips
                hedge(exA, exB, priceBuy, priceSell, amount)
                cancelAll()
                lastKeepBalanceTS = 0
                isTrade = true
            }
        }
Karena harga beli dan jual dipisahkan menjadi dua data, fungsi lindung nilaihedgejuga perlu dimodifikasi.
function hedge(buyEx, sellEx, priceBuy, priceSell, amount) {
    var buyRoutine = buyEx.Go("Buy", priceBuy, amount)
    var sellRoutine = sellEx.Go("Sell", priceSell, amount)
    Sleep(500)
    buyRoutine.wait()
    sellRoutine.wait()
}
Ada juga beberapa penyesuaian kecil berdasarkan perubahan ini, yang tidak akan diulang di sini.
Memodifikasi parameter secara interaktif seperti garis spread lindung nilai
Tambahkan interaksi ke strategi, sehingga strategi dapat memodifikasi garis pemicu penyebaran secara real time. Desain strategi interaksi juga sangat sederhana. Pertama, tambahkan kontrol interaksi ke strategi di halaman pengeditan strategi.

Ditambahkan dua kontrol, satu yang disebut A2B dan satu yang disebut B2A. Setelah memasukkan nilai di kotak input kontrol, klik tombol di sebelah kanan kotak input. Instruksi akan dikirim ke strategi segera, misalnya: masukkan nilai123di kotak input, klikA2Btombol, dan instruksi akan dikirim ke strategi segera.
A2B:123
Desain interaktif deteksi dan pengolahan kode dalam kode strategi.
        // interact
        var cmd = GetCommand()   // Every time the loop is executed here, it checks whether there is an interactive command, and returns to an empty string if not.
        if (cmd) {               // An interactive command was detected, such as A2B:123
            Log("command received:", cmd)
            var arr = cmd.split(":")   // Split out the interactive control name and the value in the input box, arr[0] is A2B, arr[1] is 123
            if (arr[0] == "A2B") {     // Determine whether the triggered interactive control is A2B
                Log("Modify the parameters of A2B, ", diffAsPercentage ? "The parameter is the difference percentage" : "The parameter is the difference:", arr[1])
                if (diffAsPercentage) {
                    hedgeDiffPercentageB2A = parseFloat(arr[1])     // Modify the trigger spread line
                } else {
                    hedgeDiffPriceA2B = parseFloat(arr[1])          // Modify the trigger spread line
                }
            } else if (arr[0] == "B2A") {           // Triggered control detected is B2A
                Log("Modify the parameters of B2A, ", diffAsPercentage ? "The parameter is the difference percentage" : "The parameter is the difference:", arr[1])
                if (diffAsPercentage) {
                    hedgeDiffPercentageA2B = parseFloat(arr[1])
                } else {
                    hedgeDiffPriceB2A = parseFloat(arr[1])
                }
            }
        }
Atur informasi bilah status dan tampilkannya dalam format tabel
Membuat tampilan data bar status lebih teratur dan mudah diamati.
        var tbl = {
            "type" : "table",
            "title" : "data",
            "cols" : ["exchange", "coin", "freeze coin", "denominated currency", "freeze denominated currency", "trigger spread", "current spread"],
            "rows" : [],
        }
        tbl.rows.push(["A:" + exA.GetName(), nowAccs[0].Stocks, nowAccs[0].FrozenStocks, nowAccs[0].Balance, nowAccs[0].FrozenBalance, "A->B:" + targetDiffPriceA2B, "A->B:" + (depthA.Bids[0].Price - depthB.Asks[0].Price)])
        tbl.rows.push(["B:" + exB.GetName(), nowAccs[1].Stocks, nowAccs[1].FrozenStocks, nowAccs[1].Balance, nowAccs[1].FrozenBalance, "B->A:" + targetDiffPriceB2A, "B->A:" + (depthB.Bids[0].Price - depthA.Asks[0].Price)])

        LogStatus(_D(), "\n", "`" + JSON.stringify(tbl) + "`")

Pengujian balik
Backtesting hanya strategi uji, fungsi deteksi awal, dan banyak bug dapat diuji di tahap backtesting sebenarnya. tidak perlu terlalu memperhatikan hasil backtesting. strategi akhir masih perlu diuji di lingkungan nyata.

Kode sumber strategi:https://www.fmz.com/strategy/302834
- Praktik Kuantitatif Bursa DEX (2) -- Panduan Pengguna Hyperliquid
- DEX Exchange Quantitative Practice ((2) -- Hyperliquid Panduan Penggunaan
- Praktik Kuantitatif Bursa DEX (1) -- DYdX v4 Panduan Pengguna
- Pengantar ke Lead-Lag Arbitrage dalam Cryptocurrency (3)
- Praktik Kuantitatif DEX Exchange ((1)-- dYdX v4 Panduan Penggunaan
- Penjelasan tentang suite Lead-Lag dalam mata uang digital (3)
- Pengantar ke Lead-Lag Arbitrage dalam Cryptocurrency (2)
- Penjelasan tentang suite Lead-Lag dalam mata uang digital (2)
- Pembahasan Penerimaan Sinyal Eksternal Platform FMZ: Solusi Lengkap untuk Penerimaan Sinyal dengan Layanan Http Terbina dalam Strategi
- FMZ platform eksplorasi penerimaan sinyal eksternal: strategi built-in https layanan solusi lengkap untuk penerimaan sinyal
- Pengantar ke Lead-Lag Arbitrage dalam Cryptocurrency (1)
- Cryptocurrency Quantitative Trading for Beginners - Membawa Anda Lebih Dekat dengan Cryptocurrency Quantitative (8)
- Cryptocurrency Quantitative Trading for Beginners - Membawa Anda Lebih Dekat dengan Cryptocurrency Quantitative (7)
- Cryptocurrency Quantitative Trading for Beginners - Membawa Anda Lebih Dekat dengan Cryptocurrency Quantitative (6)
- Gambaran umum dan arsitektur antarmuka utama Platform Perdagangan Kuantum FMZ
- Desain strategi Martingale untuk berjangka cryptocurrency
- Cryptocurrency Quantitative Trading for Beginners - Membawa Anda Lebih Dekat dengan Cryptocurrency Quantitative (5)
- Cryptocurrency Quantitative Trading for Beginners - Membawa Anda Lebih Dekat dengan Cryptocurrency Quantitative (4)
- Cryptocurrency Quantitative Trading for Beginners - Membawa Anda Lebih Dekat dengan Cryptocurrency Quantitative (3)
- Cryptocurrency Quantitative Trading for Beginners - Membawa Anda Lebih Dekat dengan Cryptocurrency Quantitative (2)
- Cryptocurrency Quantitative Trading for Beginners - Membawa Anda Lebih Dekat dengan Cryptocurrency Quantitative (1)
- Contoh kontrak akses protokol umum di FMZ
- Multi-Exchange Spot Spread Arbitrage Strategi Logic Sharing
- Modul visualisasi untuk membangun strategi perdagangan - mendalam
- Gunakan fungsi KLineChart untuk membuat desain strategi gambar lebih mudah
- Gunakan fungsi KlineChart untuk mendesain grafik strategi yang lebih sederhana
- Perdagangan Forex di Bursa Efek Rumah Kaca
- JavaScript strategi backtesting adalah debugged di DevTools dari browser Chrome
- Debugging kebijakan JavaScript di browser Chrome
- Modul visualisasi membangun strategi transaksi - lebih dalam
- Strategi keseimbangan berkelanjutan yang cocok untuk pasar beruang