Kombinasi strategi multi-faktor
Berikut ini adalah analisis strategi terperinci yang saya buat berdasarkan kode strategi trading yang Anda berikan:
Ringkasan
Strategi ini terdiri dari beberapa kombinasi faktor yang bertujuan untuk memanfaatkan keuntungan dari berbagai faktor untuk membangun strategi perdagangan yang komprehensif.
- Stoch.RSI - Indeks acak rata-rata bergerak lurus
- RSI - Indeks Relatif Lemah
- Double Strategy - Strategi ganda untuk indikator acak dan RSI
- CM Williams Vix Fix - Williams Volatility Fix, Mencari Bagian Bawah Pasar
- DMI - Indikator tren
Dengan menggabungkan beberapa faktor, Anda dapat memanfaatkan keuntungan dari masing-masing faktor, mendapatkan lebih banyak peluang perdagangan, dan mengurangi risiko ketergantungan pada satu faktor.
Prinsip Strategi
Strategi ini menggunakan beberapa indikator teknis:
Stoch.RSI- Indikator RSI acak, yang menggabungkan keunggulan RSI dan indikator acak. Ini menggunakan nilai RSI sebagai input dari indikator acak untuk menilai apakah pasar berada dalam kondisi overbought atau oversold.
RSI- Indeks relatif kuat, menilai kondisi pasar overbought oversold. RSI lebih besar dari 70 adalah zona overbought, lebih kecil dari 30 adalah zona oversold. RSI bergoyang di antara 30-70, yang mewakili pasar berada di posisi horizontal.
Double Strategy- Strategi ganda dengan menggunakan indikator acak dan RSI. Bila indikator acak% K melintasi garis% D dari bawah zona oversold dan RSI melintasi dari bawah zona oversold, lakukan over; Bila indikator acak% K melintasi garis% D dari atas zona oversold dan RSI melintasi dari zona oversold, lakukan over.
CM Williams Vix Fix- Indikator perbaikan volatilitas Williams, menilai apakah pasar berada di titik balik dengan menghitung rentang persentase dari volatilitas harga dalam periode waktu terakhir.
DMI- Indikator tren, untuk menilai arah tren pasar dengan menghitung perbedaan + DI dan - DI. Indeks ADX dapat digunakan untuk menilai kekuatan tren.
Menggunakan kekuatan masing-masing indikator secara komprehensif, menilai tren pasar dan titik jual dari sudut pandang yang berbeda, dapat meningkatkan stabilitas dan tingkat keberhasilan strategi.
Keunggulan Strategis
- Di sisi lain, ada beberapa hal yang perlu diperhatikan, yaitu:
- Dengan adanya berbagai jenis sinyal trading seperti trend, reversal, dan lain-lain, peluang lebih besar.
- Pada saat yang sama, menilai zona overbought dan oversold, dan menemukan terjadinya dan terbaliknya kondisi ekstrem dalam waktu yang tepat;
- Menggunakan parameter yang dioptimalkan untuk menetapkan indikator yang lebih sesuai dengan kondisi pasar yang berbeda;
- Menggunakan indikator tren untuk menilai kekuatan tren dan menghindari perdagangan berlawanan arah.
Analisis risiko
- Di antara faktor-faktor tersebut, ada beberapa faktor yang harus diperhatikan, yaitu:
- Beberapa indikator memiliki masalah dengan homogenisasi, yang memungkinkan untuk lebih mengoptimalkan kombinasi;
- Jika sinyal multirumah muncul pada saat yang sama, maka harus ada prinsip yang jelas untuk memilih arah strategi.
- Pengaturan parameter membutuhkan pengoptimalan pengembalian yang ketat, tidak cocok untuk mengubah parameter secara acak;
- Efektifitas jangka panjang mungkin tidak baik, perlu waktu yang tepat untuk menghentikan kerugian.
Arah optimasi
- Menyaring lebih lanjut dari indikator dalam portofolio untuk mempertahankan faktor-faktor yang unik;
- Mengoptimalkan pengaturan parameter untuk setiap indikator agar lebih sesuai dengan target pasar;
- Membangun prinsip masuk dan keluar yang jelas;
- Menggunakan metode stop loss, profit withdrawal, dan lain-lain untuk mengendalikan risiko;
- Uji pengaruh jangka waktu kepemilikan yang berbeda terhadap kinerja.
Meringkaskan
Strategi ini menggabungkan keunggulan dari berbagai indikator teknis untuk membentuk sinyal perdagangan melalui faktor-faktor seperti Stoch.RSI, RSI, Double Strategy, CM Williams Vix Fix dan DMI. Ini memberikan dasar penilaian yang lebih komprehensif dan stabil, tetapi juga membuat optimasi parameter strategi menjadi lebih rumit.
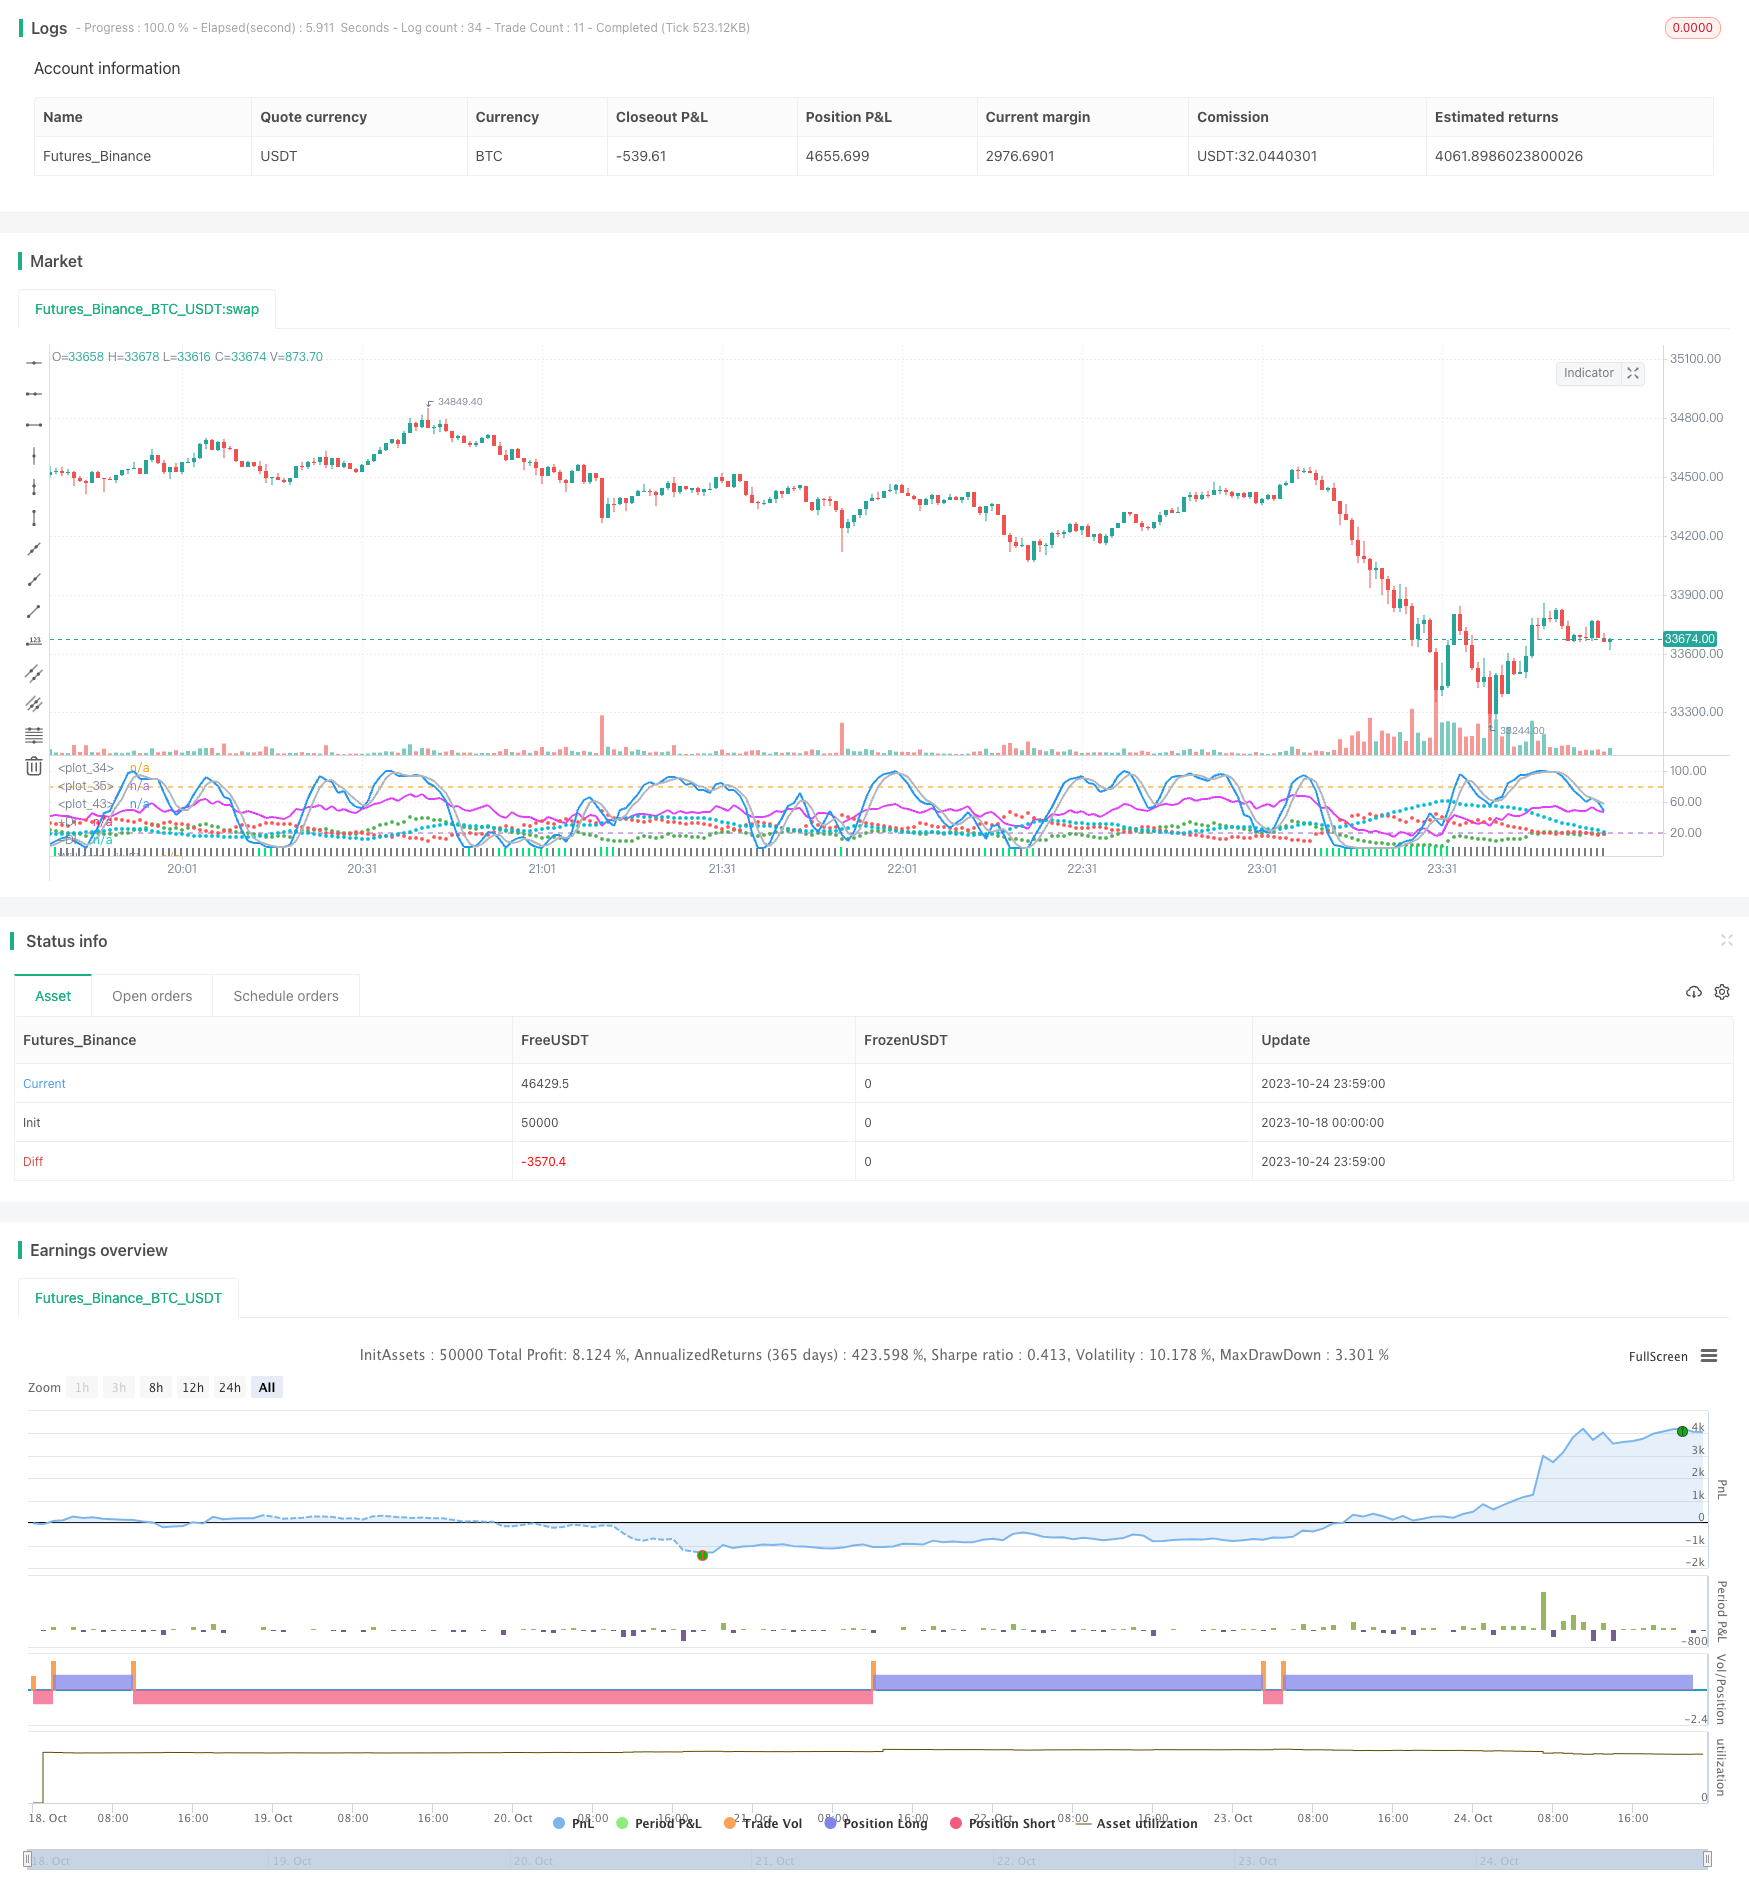
/*backtest
start: 2023-10-18 00:00:00
end: 2023-10-25 00:00:00
period: 1m
basePeriod: 1m
exchanges: [{"eid":"Futures_Binance","currency":"BTC_USDT"}]
*/


     //////////////////////////////////////////////////////////////////////
    ////  STOCHASTIC_RSI+RSI+DOUBLE_STRATEGY+CM_WILLIAMS_VIX_FIX+DMI  ////
   //////////////////////////////////////////////////////////////////////


//  This is a simple combination of integrated and published scripts, useful
//  if you don't have a PRO account and want to bypass the 3 indicator limit.
//  It includes:
//  1) Stoch.RSI
//  2) Relative strenght index
//  3) Stochastic + RSI, Double Strategy (by ChartArt)
//  4) CM_Williams_Vix_Fix Finds Market Bottoms (by ChrisMoody)
//  5) Directional Movement Index (DMI)
//  For more details about 3) and 4) check the original scripts.


//@version=3

strategy(title="Stoch.RSI+RSI+DoubleStrategy+CMWilliamsVixFix+DMI", shorttitle="Stoch.RSI+RSI+DoubleStrategy+CMWilliamsVixFix+DMI")


///STOCH.RSI///
smoothK = input(3, minval=1, title="Stochastic %K Smoothing")
smoothD = input(3, minval=1, title="Stochastic %K Moving Average")
lengthRSI = input(14, minval=1, title="RSI Lenght")
lengthStoch = input(14, minval=1, title="Stochastic Lenght")
RSIprice = close
rsi1 = rsi(RSIprice, lengthRSI)
k = sma(stoch(rsi1, rsi1, rsi1, lengthStoch), smoothK)
d = sma(k, smoothD)
plot(k, color=blue, linewidth=2)
plot(d, color=silver, linewidth=2)
h0 = hline(80)
h1 = hline(20)
fill(h0, h1, color=purple, transp=78)


///RSI///
up = rma(max(change(RSIprice), 0), lengthRSI)
down = rma(-min(change(RSIprice), 0), lengthRSI)
rsi2 = down == 0 ? 100 : up == 0 ? 0 : 100 - (100 / (1 + up / down))
plot(rsi2, color=fuchsia, linewidth=2)
// band0 = hline(70, linestyle=dotted)
// band1 = hline(30, linestyle=dotted)
// fill(band0, band1, color=purple, transp=100)


///OVERBOUGHT-OVERSOLD STRATEGY///
StochOverBought = input(80, title="Stochastic overbought condition")
StochOverSold = input(20, title="Stochastic oversold condition")
ks = sma(stoch(close, high, low, lengthStoch), smoothK)
ds = sma(k, smoothD)
RSIOverBought = input( 70  , title="RSI overbought condition")
RSIOverSold = input( 30  , title="RSI oversold condition")
vrsi = rsi(RSIprice, lengthRSI)
if (not na(ks) and not na(ds))
    if (crossover(ks,ds) and k < StochOverSold)
        if (not na(vrsi)) and (crossover(vrsi, RSIOverSold))
            strategy.entry("LONG", strategy.long, comment="LONG")
if (crossunder(ks,ds) and ks > StochOverBought)
    if (crossunder(vrsi, RSIOverBought))
        strategy.entry("SHORT", strategy.short, comment="SHORT")


///CM WILLIAMS VIX FIX///
pd = input(22, title="LookBack Period Standard Deviation High")
bbl = input(20, title="Bollinger Band Length")
mult = input(2.0    , minval=1, maxval=5, title="Bollinger Band Standard Devaition Up")
lb = input(50  , title="Look Back Period Percentile High")
ph = input(.85, title="Highest Percentile - 0.90=90%, 0.95=95%, 0.99=99%")
pl = input(1.01, title="Lowest Percentile - 1.10=90%, 1.05=95%, 1.01=99%")
hp = input(false, title="Show High Range (Based on Percentile and LookBack Period)?")
sd = input(false, title="Show Standard Deviation Line?")
wvf = ((highest(close, pd)-low)/(highest(close, pd)))*100
sDev = mult * stdev(wvf, bbl)
midLine = sma(wvf, bbl)
lowerBand = midLine - sDev
upperBand = midLine + sDev
rangeHigh = (highest(wvf, lb)) * ph
rangeLow = (lowest(wvf, lb)) * pl
col = wvf >= upperBand or wvf >= rangeHigh ? lime : gray
plot(hp and rangeHigh ? rangeHigh : na, title="Range High Percentile", style=line, linewidth=4, color=orange)
plot(hp and rangeLow ? rangeLow : na, title="Range High Percentile", style=line, linewidth=4, color=orange)
plot(wvf, title="Williams Vix Fix", style=columns, linewidth = 4, color=col, transp=85)
plot(sd and upperBand ? upperBand : na, title="Upper Band", style=line, linewidth = 3, color=aqua)


///DIRECTIONAL MOVEMENT INDEX///
len3 = input(14, minval=1, title="DI Length")
lensig3 = input(14, title="ADX Smoothing", minval=1, maxval=50)
up3 = change(high)
down3 = -change(low)
plusDM3 = na(up3) ? na : (up3 > down3 and up3 > 0 ? up3 : 0)
minusDM3 = na(down3) ? na : (down3 > up3 and down3 > 0 ? down3 : 0)
trur3 = rma(tr, len3)
plus3 = fixnan(100 * rma(plusDM3, len3) / trur3)
minus3 = fixnan(100 * rma(minusDM3, len3) / trur3)
sum3 = plus3 + minus3
adx3 = 100 * rma(abs(plus3 - minus3) / (sum3 == 0 ? 1 : sum3), lensig3)
plot(plus3, color=green, style=circles, linewidth=2, title="+DI")
plot(minus3, color=red, style=circles, linewidth=2, title="-DI")
plot(adx3, color=aqua, style=circles, linewidth=3, title="ADX")