Strategi Bipolar Pengembalian Bulanan
Tanggal Pembuatan:
2023-11-06 16:06:55
Akhirnya memodifikasi:
2023-11-06 16:06:55
menyalin:
0
Jumlah klik:
385
1
fokus pada
1212
Pengikut
Ringkasan
Strategi ini menggunakan titik pivot pada garis K untuk menilai pembalikan tren, dan dengan demikian sinyal untuk perdagangan multihead. Jika menguntungkan, strategi ini akan mengunci keuntungan yang telah tercapai pada bulan itu, untuk mencegah kerugian yang lebih besar pada periode penarikan balik.
Prinsip-prinsip Strategi
- Penggunaan
pivothigh()Danpivotlow()Fungsi menghitung titik pivot pada garis K. Titik pivot dapat menentukan pembalikan tren. - Bila harga melebihi titik sumbu atas, lakukan posisi overhead. Bila harga turun di bawah titik sumbu bawah, lakukan posisi short head.
- Pada awal setiap bulan, perhitungkan hasil bulan sebelumnya dan simpan ke dalam array.
- Pada awal setiap tahun, perhitungkan tingkat pendapatan tahun lalu dan simpan ke dalam array.
- Membuat tabel yield, Anda dapat melihat secara intuitif setiap bulan dan tahun.
Analisis Keunggulan
- Dengan menggunakan pivot point untuk menentukan trend reversal, Anda dapat menyaring beberapa sinyal perdagangan noise.
- Penguncian pendapatan setiap bulan dapat mengurangi dampak bulan yang merugikan, dan keuntungan yang dipolarisasi.
- Tabel pendapatan secara intuitif menunjukkan pendapatan setiap bulan, sehingga Anda dapat dengan jelas melihat periode yang baik dan buruk dari strategi tersebut.
Analisis Risiko
- Perubahan pada pivot point dapat menyebabkan kesalahan reverse opening. Parameter dapat dioptimalkan sesuai atau kondisi filter dapat ditambahkan.
- Jika Anda melakukan penutupan posisi pada awal bulan, Anda akan kehilangan kesempatan untuk mendapatkan keuntungan di bulan berikutnya. Anda dapat mempertimbangkan untuk mengunci hanya sebagian dari posisi Anda.
- Tabel ini tidak dapat menampilkan indikator risiko seperti pengembalian maksimum. Anda dapat mempertimbangkan untuk menambahkan indikator lain yang mengukur risiko strategi.
Optimalisasi arah
- Kondisi filter dapat ditambahkan di dekat titik pivot untuk menghindari seringnya reversal yang tidak valid.
- Anda dapat mengunci hanya sebagian dari posisi, bukan semua posisi kosong, mengurangi kemungkinan kehilangan.
- Indikator risiko kuantitatif seperti Maximum Withdrawal, Sharpe Ratio dapat ditambahkan untuk ditampilkan dalam tabel.
Kesimpulannya
Strategi ini menggunakan pivot point untuk menentukan trend reversal untuk berdagang, dan mengunci keuntungan pada akhir bulan. Namun, beberapa parameter dan logika strategi masih dapat dioptimalkan lebih lanjut, membuat sinyal perdagangan lebih akurat, kontrol risiko lebih stabil.
Kode Sumber Strategi
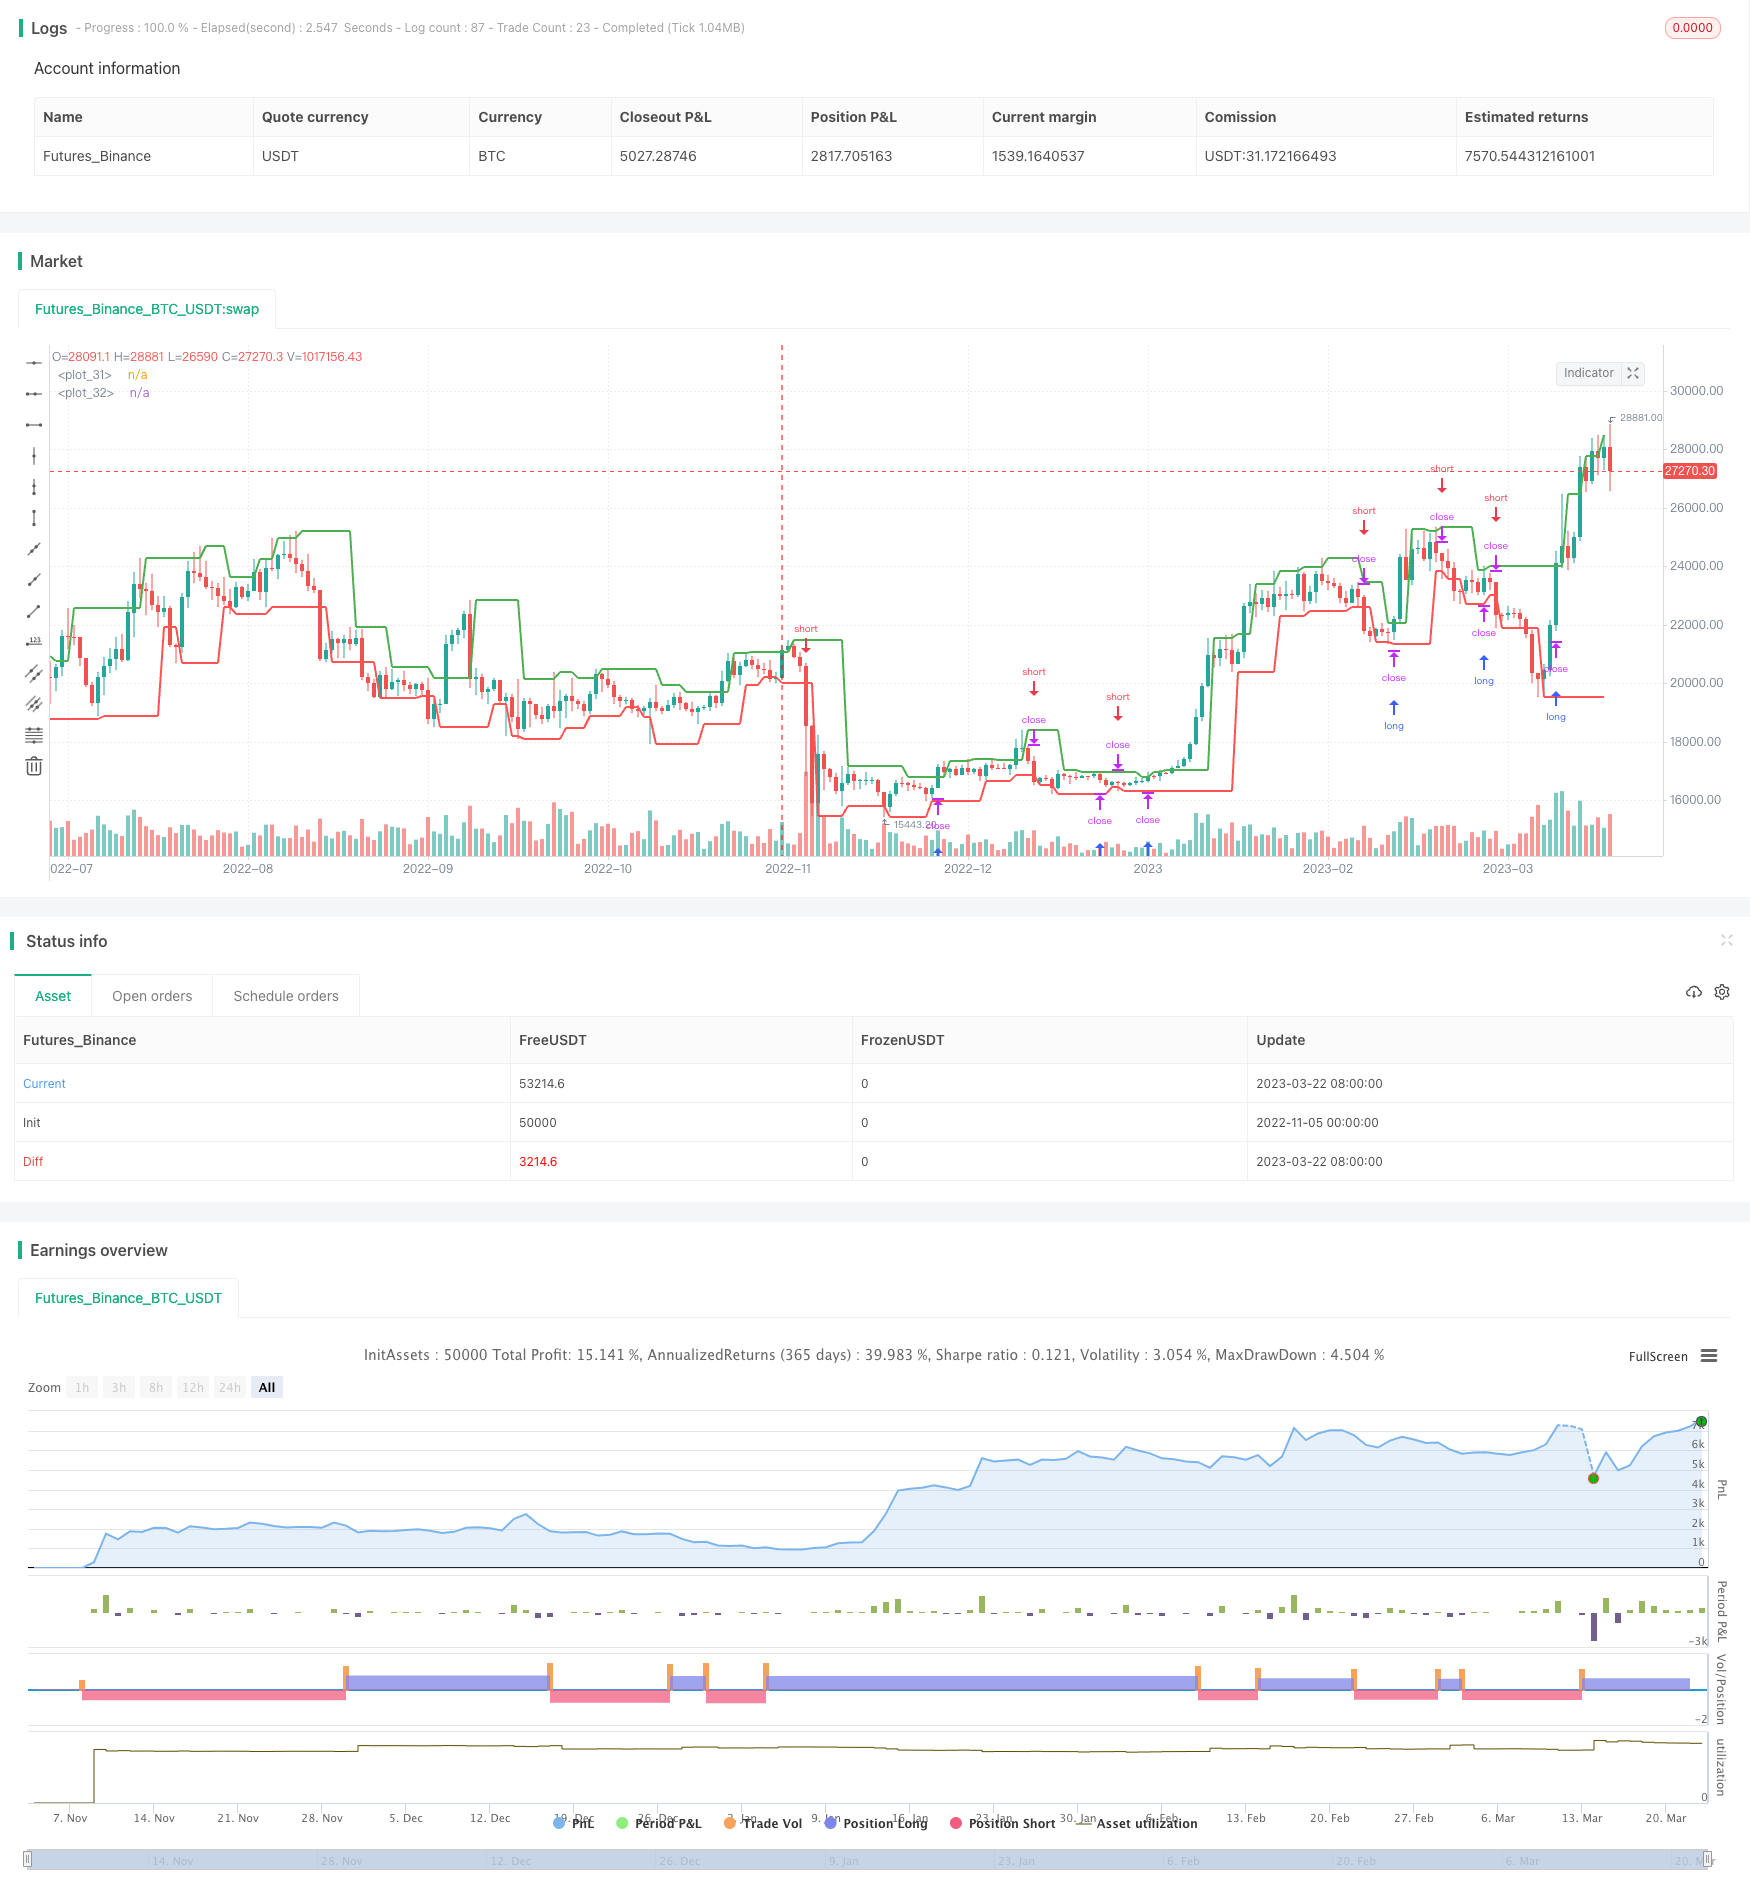
/*backtest
start: 2022-11-05 00:00:00
end: 2023-03-23 05:20:00
period: 1d
basePeriod: 1h
exchanges: [{"eid":"Futures_Binance","currency":"BTC_USDT"}]
*/

//@version=4
strategy("Monthly Returns in PineScript Strategies", overlay = true, default_qty_type = strategy.percent_of_equity, default_qty_value = 25, calc_on_every_tick = true, commission_type = strategy.commission.percent, commission_value = 0.1)

// Inputs
leftBars  = input(2)
rightBars = input(1)
prec      = input(2, title = "Return Precision")

// Pivot Points
swh = pivothigh(leftBars, rightBars)
swl = pivotlow(leftBars, rightBars)

hprice = 0.0
hprice := not na(swh) ? swh : hprice[1]

lprice = 0.0
lprice := not na(swl) ? swl : lprice[1]

le = false
le := not na(swh) ? true : (le[1] and high > hprice ? false : le[1])

se = false
se := not na(swl) ? true : (se[1] and low < lprice ? false : se[1])

if (le)
	strategy.entry("PivRevLE", strategy.long, comment="PivRevLE", stop=hprice + syminfo.mintick)

if (se)
	strategy.entry("PivRevSE", strategy.short, comment="PivRevSE", stop=lprice - syminfo.mintick)

plot(hprice, color = color.green, linewidth = 2)
plot(lprice, color = color.red,   linewidth = 2)

///////////////////
// MONTHLY TABLE //

new_month = month(time) != month(time[1])
new_year  = year(time)  != year(time[1])

eq = strategy.equity

bar_pnl = eq / eq[1] - 1

cur_month_pnl = 0.0
cur_year_pnl  = 0.0

// Current Monthly P&L
cur_month_pnl := new_month ? 0.0 :
                 (1 + cur_month_pnl[1]) * (1 + bar_pnl) - 1

// Current Yearly P&L
cur_year_pnl := new_year ? 0.0 :
                 (1 + cur_year_pnl[1]) * (1 + bar_pnl) - 1

// Arrays to store Yearly and Monthly P&Ls
var month_pnl  = array.new_float(0)
var month_time = array.new_int(0)

var year_pnl  = array.new_float(0)
var year_time = array.new_int(0)

if (not na(cur_month_pnl[1]) and (new_month or barstate.islast))
    array.push(month_pnl , cur_month_pnl[1])
    array.push(month_time, time[1])

if (not na(cur_year_pnl[1]) and (new_year or barstate.islast))
    array.push(year_pnl , cur_year_pnl[1])
    array.push(year_time, time[1])

// Monthly P&L Table
var monthly_table = table(na)

if (barstate.islast)
    monthly_table := table.new(position.bottom_right, columns = 14, rows = array.size(year_pnl) + 1, border_width = 1)

    table.cell(monthly_table, 0,  0, "",     bgcolor = #cccccc)
    table.cell(monthly_table, 1,  0, "Jan",  bgcolor = #cccccc)
    table.cell(monthly_table, 2,  0, "Feb",  bgcolor = #cccccc)
    table.cell(monthly_table, 3,  0, "Mar",  bgcolor = #cccccc)
    table.cell(monthly_table, 4,  0, "Apr",  bgcolor = #cccccc)
    table.cell(monthly_table, 5,  0, "May",  bgcolor = #cccccc)
    table.cell(monthly_table, 6,  0, "Jun",  bgcolor = #cccccc)
    table.cell(monthly_table, 7,  0, "Jul",  bgcolor = #cccccc)
    table.cell(monthly_table, 8,  0, "Aug",  bgcolor = #cccccc)
    table.cell(monthly_table, 9,  0, "Sep",  bgcolor = #cccccc)
    table.cell(monthly_table, 10, 0, "Oct",  bgcolor = #cccccc)
    table.cell(monthly_table, 11, 0, "Nov",  bgcolor = #cccccc)
    table.cell(monthly_table, 12, 0, "Dec",  bgcolor = #cccccc)
    table.cell(monthly_table, 13, 0, "Year", bgcolor = #999999)


    for yi = 0 to array.size(year_pnl) - 1
        table.cell(monthly_table, 0,  yi + 1, tostring(year(array.get(year_time, yi))), bgcolor = #cccccc)

        y_color = array.get(year_pnl, yi) > 0 ? color.new(color.green, transp = 50) : color.new(color.red, transp = 50)
        table.cell(monthly_table, 13, yi + 1, tostring(round(array.get(year_pnl, yi) * 100, prec)), bgcolor = y_color)

    for mi = 0 to array.size(month_time) - 1
        m_row   = year(array.get(month_time, mi))  - year(array.get(year_time, 0)) + 1
        m_col   = month(array.get(month_time, mi))
        m_color = array.get(month_pnl, mi) > 0 ? color.new(color.green, transp = 70) : color.new(color.red, transp = 70)

        table.cell(monthly_table, m_col, m_row, tostring(round(array.get(month_pnl, mi) * 100, prec)), bgcolor = m_color)