Strategi multi-tren
Ringkasan
Strategi ini menggunakan berbagai indikator untuk mengidentifikasi arah tren, menggunakan metode pelacakan tren, dan menangkap peluang tren di garis tengah dan pendek. Strategi ini dirancang khusus untuk melacak tren, dengan tujuan untuk meningkatkan tingkat kemenangan dan mengurangi kemunduran.
Prinsip Strategi
Menggunakan indikator WVAP untuk menentukan proporsi harga;
Indeks RSI menilai pergerakan udara yang berlebihan;
Indikator QQE mengidentifikasi terobosan harga;
Indikator ADX menilai kekuatan tren;
Indikator Coral Trend mengevaluasi pergerakan fundamental.
Indeks LSMA membantu menilai tren;
Sinyal perdagangan yang digabungkan dengan berbagai indikator.
Strategi ini terutama bergantung pada beberapa indikator untuk menentukan arah dan kekuatan tren, seperti RSI, QQE, ADX, dan menggunakan kurva Coral Trend Indicator sebagai standar dasar untuk menentukan tren. Ketika indikator seperti RSI mengirimkan sinyal beli, jika Coral Trend Indicator juga menunjukkan kurva naik, maka kemungkinan tinggi sesuai dengan tren ke atas, maka strategi ini akan memilih untuk membeli.
Keunggulan Strategis
Ini adalah kombinasi dari beberapa indikator untuk meningkatkan keakuratan penilaian.
Menekankan untuk melacak tren dan meningkatkan probabilitas keuntungan;
Dengan menggunakan ide-ide inovatif, mereka memilah-milah pasar Trading Range.
Menghindari perdagangan berlawanan dengan indikator fundamental;
Pengaturan waktu dan jam trading yang masuk akal untuk mengurangi risiko;
Strategi yang jelas, mudah dipahami dan dioptimalkan.
Keuntungan terbesar dari strategi ini adalah penilaian kombinasi multi-indikator, yang dapat mengurangi probabilitas salah penilaian satu indikator dan meningkatkan akurasi penilaian. Selain itu, strategi ini menambahkan indikator fundamental untuk menghindari operasi berlawanan. Desain ini meningkatkan stabilitas strategi dan probabilitas keuntungan.
Risiko Strategis
Di sisi lain, ada beberapa hal yang perlu diperhatikan, antara lain:
Pengendalian penarikan tidak sempurna dan ada risiko penarikan yang lebih besar;
Strategi dapat melewatkan sinyal ketika fundamental berbalik;
Tidak mempertimbangkan biaya transaksi, ada risiko penurunan pendapatan jika diterapkan secara praktis.
Risiko terbesar dari strategi ini adalah bahwa penilaian kombinasi multi-indikator mungkin ada lag, yang menyebabkan kehilangan waktu masuk yang optimal, sehingga mempengaruhi ruang keuntungan. Selain itu, kontrol penarikan kembali strategi tidak ideal, ada risiko penarikan kembali yang lebih besar.
Arah optimasi strategi
Ini adalah salah satu strategi yang paling efektif untuk mengurangi risiko kerugian dan mengurangi risiko kerugian.
Optimalkan pengaturan parameter untuk mempersingkat keterlambatan indikator.
Meningkatkan penggunaan dan akurasi indikator-indikator dasar;
Optimalisasi parameter dinamis dengan algoritma pembelajaran mesin.
Fokus optimasi dari strategi ini harus mempertimbangkan pengendalian penarikan, dapat bergabung dengan strategi stop loss bergerak untuk mengunci keuntungan, mengurangi penarikan. Selain itu, dapat meningkatkan penentuan indikator dasar, meningkatkan akurasi. Jika dapat menerapkan metode pembelajaran mesin untuk mengoptimalkan dinamika parameter, juga akan meningkatkan stabilitas strategi secara signifikan.
Meringkaskan
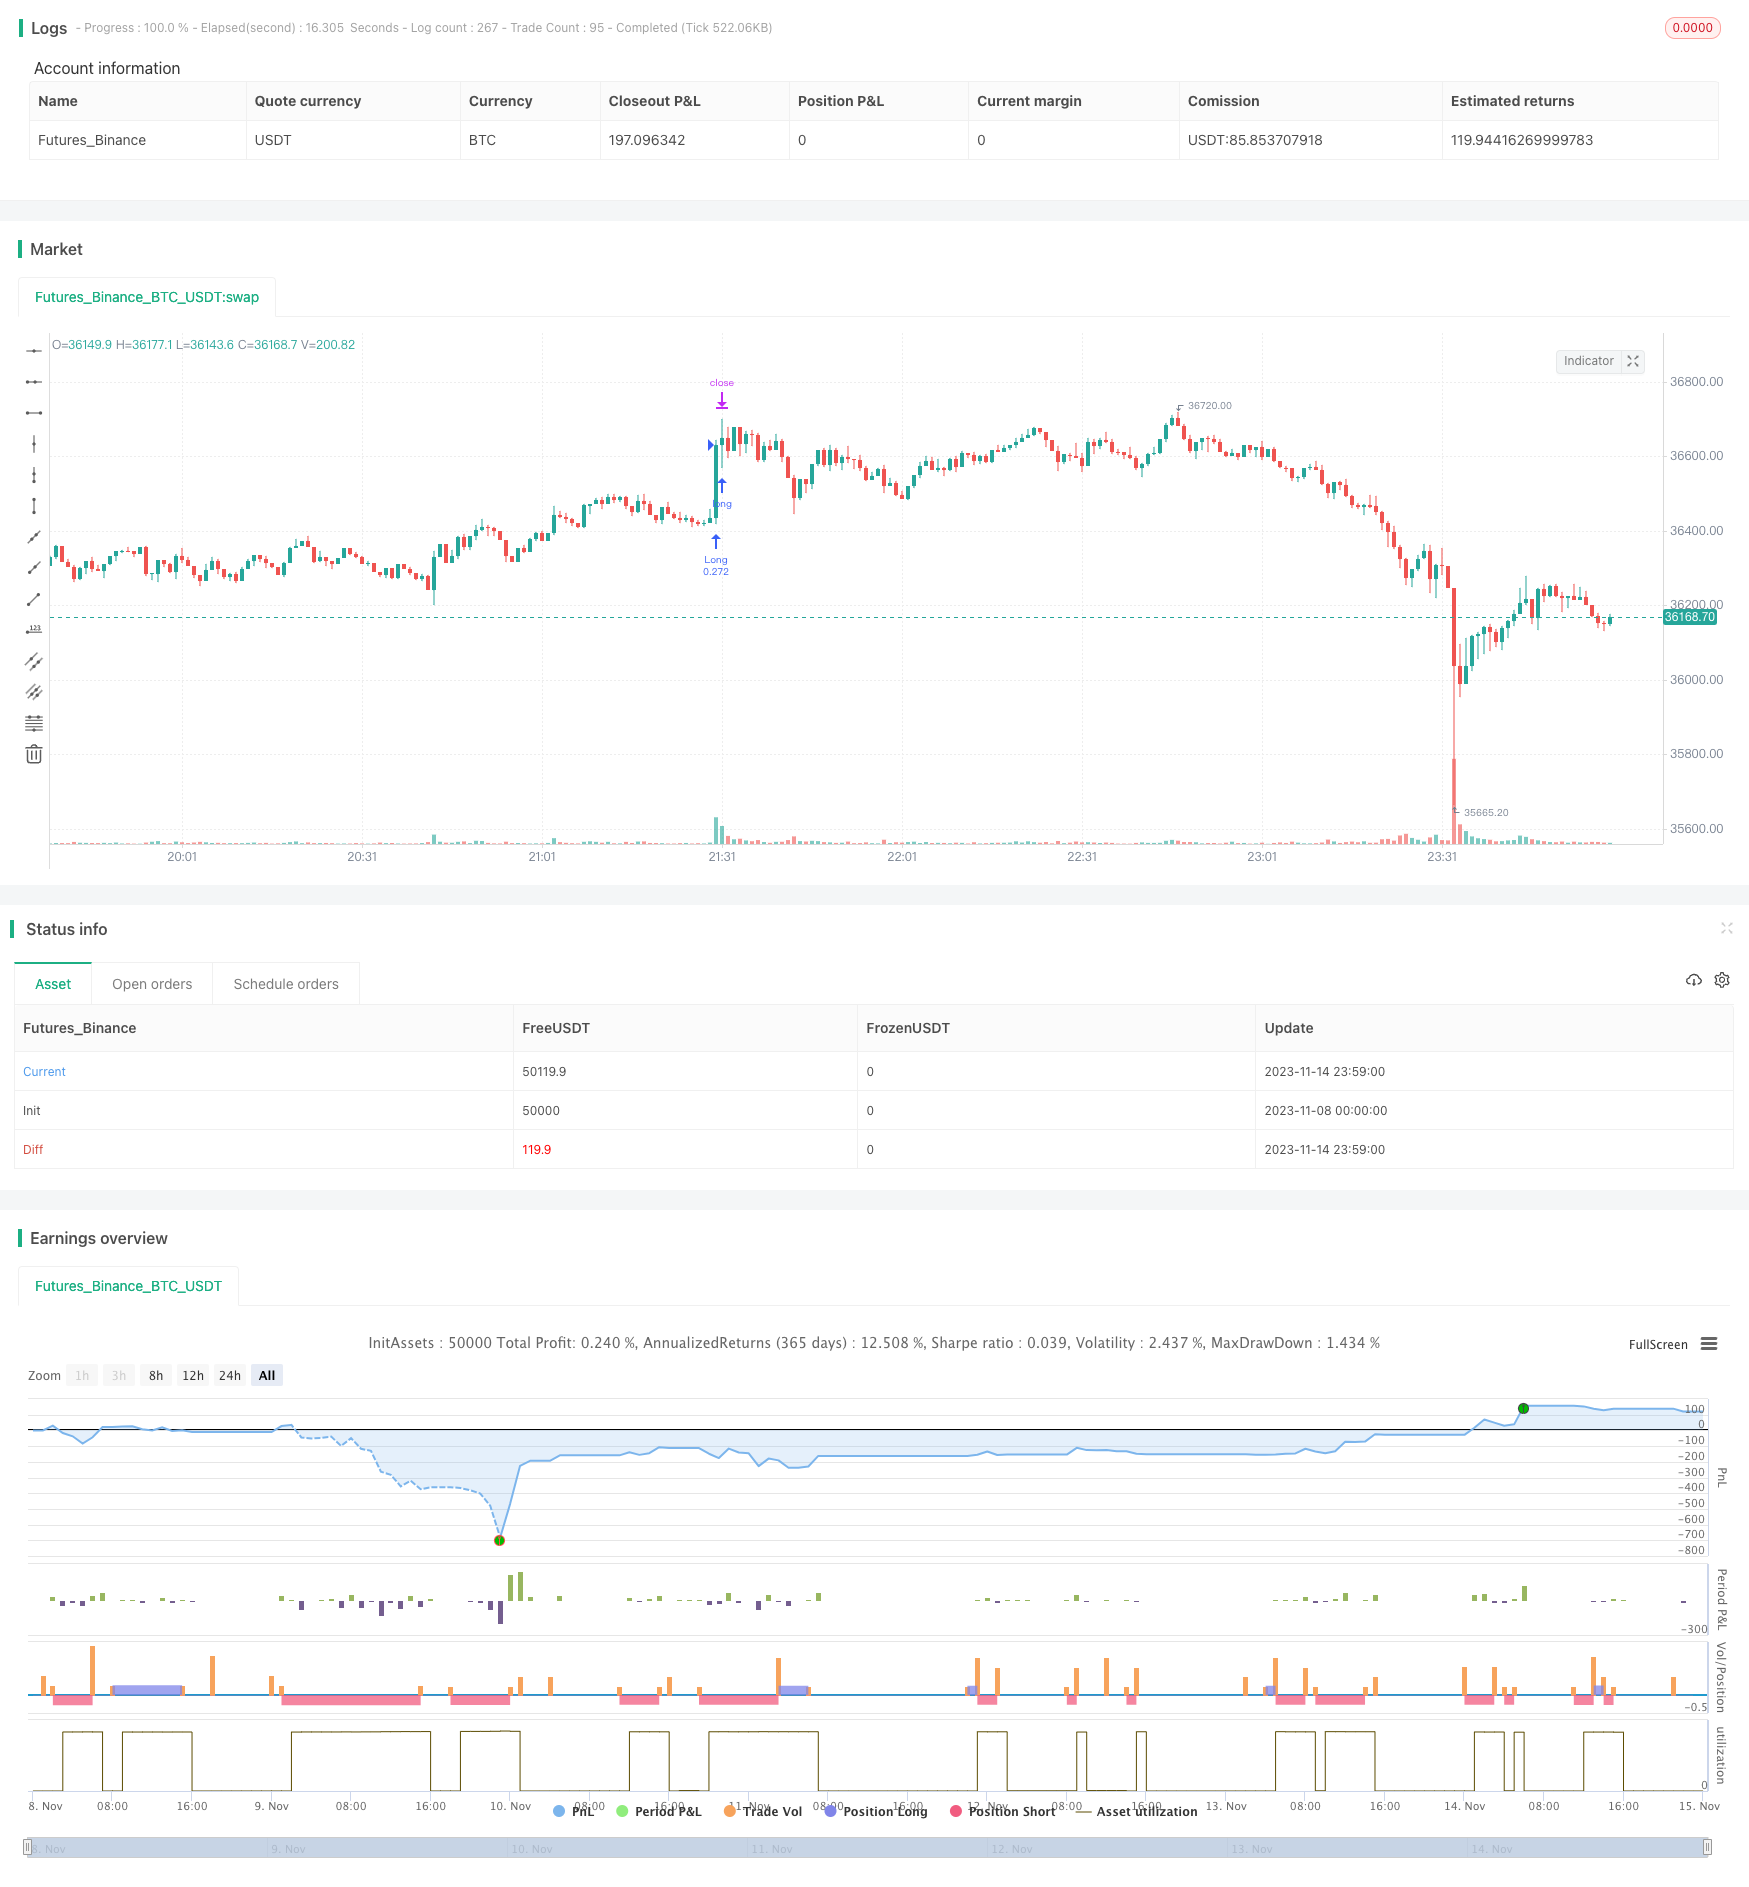
Strategi ini mengintegrasikan berbagai indikator untuk menentukan arah tren, menggunakan desain strategi pelacakan tren, yang bertujuan untuk meningkatkan akurasi penilaian, meningkatkan probabilitas keuntungan. Strategi ini memiliki penilaian kombinasi indikator, menekankan pelacakan tren, menggabungkan dasar-dasar, tetapi juga memiliki masalah seperti kesalahan penilaian, lag, dan kurangnya kontrol penarikan kembali. Di masa depan, strategi dapat ditingkatkan dengan cara mengatur parameter optimasi, memperbaiki strategi stop loss, dan menambahkan indikator dasar, sehingga strategi dapat mencapai efek yang lebih baik dalam aplikasi nyata.
/*backtest
start: 2023-11-08 00:00:00
end: 2023-11-15 00:00:00
period: 1m
basePeriod: 1m
exchanges: [{"eid":"Futures_Binance","currency":"BTC_USDT"}]
*/

// This source code is subject to the terms of the Mozilla Public License 2.0 at https://mozilla.org/MPL/2.0/
// © RolandoSantos

//@version=4
strategy(title = "VWAP Candles Strategy", overlay=true, shorttitle = "VWAP Cndl",  default_qty_type=strategy.cash, default_qty_value=10000, initial_capital=10000)

//Make inputs that set the take profit %
longProfitPerc = input(title="Take Long Profit % ", minval=0.0, step=0.1, defval=0.3) / 100
shortProfitPerc = input(title="Take Short Profit % ", minval=0.0, step=0.1, defval=0.95) / 100

tp = input(100, "Take Profit % QTY (How much profit you want to take after take profit target is triggered)")

// Figure out take profit price
longExitPrice  = strategy.position_avg_price * (1 + longProfitPerc)
shortExitPrice  = strategy.position_avg_price * (1 - shortProfitPerc)

//Use NYSE for Copp Curve entries and exits//
security = input("", title="Change this if you want to see Copp Curve calculated for current ticker. All Copp Curve calculations are base on NYSE Composite")
ticker = security(security,"", close)

///Copp Curve////

period_ = input(21, title="Length", minval=1)
isCentered = input(false, title="Centered")
barsback = period_/2 + 1
ma = sma(close, period_)
dpo = isCentered ? close[barsback] - ma : close - ma[barsback]


instructions =input(title="Standard Copp settings are (10, 14, 11) however, DOUBLE these lengths as alternate settings to (20,28,22) and you will find it may produce better results, but less trades", defval="-")
wmaLength = input(title="WMA Length (Experiment changing this to longer lengths for less trades, but higher win %)", type=input.integer, defval=20)
longRoCLength = input(title="Long RoC Length", type=input.integer, defval=28)
shortRoCLength = input(title="Short RoC Length", type=input.integer, defval=22)
source = ticker
curve = wma(roc(source, longRoCLength) + roc(source, shortRoCLength), wmaLength)

//////////// QQE////////////QQE///////////////////QQE////////////////////////

// This source code is subject to the terms of the Mozilla Public License 2.0 at https://mozilla.org/MPL/2.0/
// © KivancOzbilgic

//@version=4
src=input(close)
length = input(25,"RSI Length", minval=1)
SSF=input(9, "SF RSI SMoothing Factor", minval=1)
showsignals = input(title="Show Crossing Signals?", type=input.bool, defval=true)
highlighting = input(title="Highlighter On/Off ?", type=input.bool, defval=true)
RSII=ema(rsi(src,length),SSF)
TR=abs(RSII-RSII[1])
wwalpha = 1/ length
WWMA = 0.0
WWMA := wwalpha*TR + (1-wwalpha)*nz(WWMA[1])
ATRRSI=0.0
ATRRSI := wwalpha*WWMA + (1-wwalpha)*nz(ATRRSI[1])
QQEF=ema(rsi(src,length),SSF)
QUP=QQEF+ATRRSI*4.236
QDN=QQEF-ATRRSI*4.236
QQES=0.0
QQES:=QUP<nz(QQES[1]) ? QUP : QQEF>nz(QQES[1]) and QQEF[1]<nz(QQES[1]) ? QDN :  QDN>nz(QQES[1]) ? QDN : QQEF<nz(QQES[1]) and QQEF[1]>nz(QQES[1]) ? QUP : nz(QQES[1])
//QQF=plot(QQEF,"FAST",color.maroon,2)
//QQS=plot(QQES,"SLOW",color=color.blue, linewidth=1)
buySignalr = crossover(QQEF, QQES)
sellSignalr = crossunder(QQEF, QQES)
buyr = QQEF > QQES


////QQE////////////////QQE/////////////////QQE/////////////////

//////////////LSMA//////////////////////////


//  LSMA 1 Settings & Plot
lsma1Length = input(100, minval=1, title="LSMA 1")
lsma1Offset = input(title="LSMA 1 Offset", type=input.integer, defval=0)
lsma1Source = input(close, title="LSMA 1 Source")
lsma1 = linreg(lsma1Source, lsma1Length, lsma1Offset)
lsma1_std_dev = stdev(abs(lsma1[1] - lsma1), lsma1Length)
//plot(lsma1, color=(lsma1 > lsma1[1] ? color.yellow : color.blue), title="LSMA 1", linewidth=2, transp=0)

////////////LSMA///////////////////


//////////////////ADX////////////////////

len = input(14)
th = input(20)

TrueRange = max(max(high-low, abs(high-nz(close[1]))), abs(low-nz(close[1])))
DirectionalMovementPlus = high-nz(high[1]) > nz(low[1])-low ? max(high-nz(high[1]), 0): 0
DirectionalMovementMinus = nz(low[1])-low > high-nz(high[1]) ? max(nz(low[1])-low, 0): 0

SmoothedTrueRange = 0.0
SmoothedTrueRange := nz(SmoothedTrueRange[1]) - (nz(SmoothedTrueRange[1])/len) + TrueRange

SmoothedDirectionalMovementPlus = 0.0
SmoothedDirectionalMovementPlus := nz(SmoothedDirectionalMovementPlus[1]) - (nz(SmoothedDirectionalMovementPlus[1])/len) + DirectionalMovementPlus

SmoothedDirectionalMovementMinus = 0.0
SmoothedDirectionalMovementMinus := nz(SmoothedDirectionalMovementMinus[1]) - (nz(SmoothedDirectionalMovementMinus[1])/len) + DirectionalMovementMinus

DIPlus = SmoothedDirectionalMovementPlus / SmoothedTrueRange * 100
DIMinus = SmoothedDirectionalMovementMinus / SmoothedTrueRange * 100
DX = abs(DIPlus-DIMinus) / (DIPlus+DIMinus)*100
ADX = sma(DX, len)

///////////////////ADX/////////////////////


/////////////sqz momentum/////////////////////////

//
// @author LazyBear & ChrisMoody complied by GIS_ABC
//
lengthBB = input(20, title="BB Length")
mult = input(2.0,title="BB MultFactor")
lengthKC=input(20, title="KC Length")
multKC = input(1.5, title="KC MultFactor")

useTrueRange = input(true, title="Use TrueRange (KC)")

// Calculate BB
sourceBB = close
basis = sma(sourceBB, lengthBB)
dev = multKC * stdev(source, lengthBB)
upperBB = basis + dev
lowerBB = basis - dev

// Calculate KC
maKC = sma(sourceBB, lengthKC)
rangeKC = useTrueRange ? tr : (high - low)
rangema = sma(rangeKC, lengthKC)
upperKC = maKC + rangema * multKC
lowerKC = maKC - rangema * multKC

sqzOn  = (lowerBB > lowerKC) and (upperBB < upperKC)
sqzOff = (lowerBB < lowerKC) and (upperBB > upperKC)
noSqz  = (sqzOn == false) and (sqzOff == false)

val = linreg(source  -  avg(avg(highest(high, lengthKC), lowest(low, lengthKC)),sma(close,lengthKC)),lengthKC,0)


////////////////////////////

/////// RSI on EMA/////////////////

lenrsi = input(13, minval=1, title="Length")
srcrsi = linreg(hlc3,100,0)
up = rma(max(change(srcrsi), 0), lenrsi)
down = rma(-min(change(srcrsi), 0), lenrsi)
rsi = down == 0 ? 100 : up == 0 ? 0 : 100 - (100 / (1 + up / down))
rsicolor = rsi > rsi[1] ? color.green : color.red
//plot(rsi,color = rsicolor)
//hline(20,color=color.green)
//hline(80,color=color.red)
vwaprsi = rsi(vwap(hlc3),13)
vwaprsicolor = vwaprsi > vwaprsi[1] ? color.blue : color.yellow
emarsi = ema(rsi,13)
emarsicolor = emarsi > emarsi[1] ? color.green : color.red
//plot(emarsi,color=emarsicolor)
//plot(vwaprsi,color=vwaprsicolor)

/////// RSI on VWMA/////////////////

lenrsiv = input(23, minval=1, title="Length RSI VWMA")
srcrsiv = vwma(linreg(close,23,0),23)
upv = rma(max(change(srcrsiv), 0), lenrsiv)
downv = rma(-min(change(srcrsiv), 0), lenrsiv)
rsiv = downv == 0 ? 100 : upv == 0 ? 0 : 100 - (100 / (1 + upv / downv))
rsicolorv = rsiv > rsiv[1] ? color.green : color.red

/////////////////////////////////////

/////////////////////////////////////

////////////////coral trend////////////////////
//
// @author LazyBear
// List of all my indicators:
// https://docs.google.com/document/d/15AGCufJZ8CIUvwFJ9W-IKns88gkWOKBCvByMEvm5MLo/edit?usp=sharing
//
//study(title="Coral Trend Indicator [LazyBear]", shorttitle="CTI_LB", overlay=true)
srcCT=close
i1 = 1.0
i2 = 1.0
i3 = 1.0
i4 = 1.0
i5 = 1.0
i6 = 1.0

sm =input(21, title="Smoothing Period")
cd = input(0.4, title="Constant D")
ebc=input(false, title="Color Bars")
ribm=input(false, title="Ribbon Mode")
di = (sm - 1.0) / 2.0 + 1.0
c1 = 2 / (di + 1.0)
c2 = 1 - c1
c3 = 3.0 * (cd * cd + cd * cd * cd)
c4 = -3.0 * (2.0 * cd * cd + cd + cd * cd * cd)
c5 = 3.0 * cd + 1.0 + cd * cd * cd + 3.0 * cd * cd
i1 := c1*srcCT + c2*nz(i1[1])
i2 := c1*i1 + c2*nz(i2[1])
i3 := c1*i2 + c2*nz(i3[1])
i4 := c1*i3 + c2*nz(i4[1])
i5 := c1*i4 + c2*nz(i5[1])
i6 := c1*i5 + c2*nz(i6[1])

bfr = -cd*cd*cd*i6 + c3*(i5) + c4*(i4) + c5*(i3)
// --------------------------------------------------------------------------
// For the Pinescript coders: Determining trend based on the mintick step.
// --------------------------------------------------------------------------
//bfrC = bfr - nz(bfr[1]) > syminfo.mintick ? green : bfr - nz(bfr[1]) < syminfo.mintick ? red : blue
//bfrC = bfr > nz(bfr[1]) ? green : bfr < nz(bfr[1])  ? red : blue
//tc=ebc?gray:bfrC
//plot(ribm?na:bfr, title="Trend", linewidth=3)
//bgcolor(ribm?bfrC:na, transp=50)
//barcolor(ebc?bfrC:na)
////////////////////////////////////////////////////////////////

///////////////////VWAP///////////////////


//------------------------------------------------

//------------------------------------------------
NormalVwap=vwap(hlc3)
H = vwap(high)
L = vwap(low)
O = vwap(open)
C = vwap(close)

left = 30

left_low = lowest(left)
left_high = highest(left)
newlow = low <= left_low
newhigh = high >= left_high

q = barssince(newlow)
w = barssince(newhigh)
col2 = q < w ?  #8B3A3A : #9CBA7F
col2b=O > C?color.red:color.lime


AVGHL=avg(H,L)
AVGOC=avg(O,C)
col=AVGHL>AVGOC?color.lime:color.red
col3=open > AVGOC?color.lime:color.red
//plotcandle(O,H,L,C,color=col2b)
//plot(H, title="VWAP", color=red)
//plot(L, title="VWAP", color=lime)
//plot(O, title="VWAP", color=blue)
//plot(C, title="VWAP", color=black)

//plot(NormalVwap, color=col2b)


/////////////////////////////////////////////////////////////////////////////


///Trade Conditions///
t = time(timeframe.period, "0930-1500")

long = vwaprsi > vwaprsi[1] and rsi>rsi[1] and vwaprsi < 20 //vwaprsi > 98 and rsi > 50 and rsi[1] < rsi and rsi[1] < rsi[2] //crossover(rsi,20)//O<C  and O > linreg(hlc3,100,0) and linreg(hlc3,100,0) > linreg(hlc3,100,0)[1] and AVGHL>AVGOC and t //O < C  and close > vwap(hlc3) and ADX > ADX[1]  //and val > nz(val[1]) and close > vwap(hlc3) and open > sma(close,23) and close > vwap(hlc3)  and t  //and rsi > rsi[1] and open > ema(close,13) and open > bfr and bfr > bfr[1]
close_long = crossover(vwaprsi,99.8)  //C < O // linreg(hlc3,100,0) and linreg(hlc3,100,0) < linreg(hlc3,100,0)[1] //O > C and val < nz(val[1]) // and close < vwap(hlc3)
close_short = rsiv > rsiv[1] and rsiv[2] > rsiv[1]//vwaprsi > vwaprsi[1] or rsi > rsi[1] // vwaprsi > 99 and rsi > 99 and rsi > rsi[1] and vwaprsi > vwaprsi[1]//vwaprsi > vwaprsi[1] and rsi>rsi[1] and vwaprsi < 20 //vwaprsi > 98 and rsi > 50 and rsi[1] < rsi and rsi[1] < rsi[2] //crossover(rsi,20)//O<C  and O > linreg(hlc3,100,0) and linreg(hlc3,100,0) > linreg(hlc3,100,0)[1] and AVGHL>AVGOC and t //O < C  and close > vwap(hlc3) and ADX > ADX[1]  //and val > nz(val[1]) and close > vwap(hlc3) and open > sma(close,23) and close > vwap(hlc3)  and t  //and rsi > rsi[1] and open > ema(close,13) and open > bfr and bfr > bfr[1]
short = rsiv > 95 and rsiv < rsiv[1] and rsiv[2] < rsiv[1] //vwaprsi < 1 and rsi < 1 and rsi < rsi[1] and vwaprsi < vwaprsi[1] and t //crossover(vwaprsi,99.8)  //C < O // linreg(hlc3,100,0) and linreg(hlc3,100,0) < linreg(hlc3,100,0)[1] //O > C and val < nz(val[1]) // and close < vwap(hlc3)

//long = vwaprsi > vwaprsi[1] and emarsi > emarsi[1] and emarsi[2] > emarsi[1] and ADX > 25//O<C  and O > linreg(hlc3,100,0) and linreg(hlc3,100,0) > linreg(hlc3,100,0)[1] and AVGHL>AVGOC and t //O < C  and close > vwap(hlc3) and ADX > ADX[1]  //and val > nz(val[1]) and close > vwap(hlc3) and open > sma(close,23) and close > vwap(hlc3)  and t  //and rsi > rsi[1] and open > ema(close,13) and open > bfr and bfr > bfr[1]
//close_long = vwaprsi < vwaprsi[1] or emarsi < emarsi[1]//C < O // linreg(hlc3,100,0) and linreg(hlc3,100,0) < linreg(hlc3,100,0)[1] //O > C and val < nz(val[1]) // and close < vwap(hlc3)
//close_long = O>C  or lsma1 < H  //  or O > linreg(hlc3,100,0) //and linreg(hlc3,100,0) > linreg(hlc3,100,0)[1] and AVGHL>AVGOC and t //O < C  and close > vwap(hlc3) and ADX > ADX[1]  //and val > nz(val[1]) and close > vwap(hlc3) and open > sma(close,23) and close > vwap(hlc3)  and t  //and rsi > rsi[1] and open > ema(close,13) and open > bfr and bfr > bfr[1]
//long = rsi > rsi[1] and rsi[1] >rsi[2] and lsma1 > lsma1[1] and bfr > bfr[1] and O<C and lsma1 > L  and close > close[1] and ADX > ADX[1] and ADX[1] > ADX[2] and ADX > 20 and rsi > rsi[1] and t   // linreg(hlc3,100,0) and linreg(hlc3,100,0) < linreg(hlc3,100,0)[1] //O > C and val < nz(val[1]) // and close < vwap(hlc3)

//close_short = O<C  or lsma1 > H  //  or O > linreg(hlc3,100,0) //and linreg(hlc3,100,0) > linreg(hlc3,100,0)[1] and AVGHL>AVGOC and t //O < C  and close > vwap(hlc3) and ADX > ADX[1]  //and val > nz(val[1]) and close > vwap(hlc3) and open > sma(close,23) and close > vwap(hlc3)  and t  //and rsi > rsi[1] and open > ema(close,13) and open > bfr and bfr > bfr[1]
//short = rsi < rsi[1] and rsi[1] <rsi[2] and lsma1 < lsma1[1] and bfr < bfr[1] and O>C and lsma1 < L  and close < close[1] and ADX > ADX[1] and ADX[1] > ADX[2] and ADX > 20 and rsi < rsi[1] and t   // linreg(hlc3,100,0) and linreg(hlc3,100,0) < linreg(hlc3,100,0)[1] //O > C and val < nz(val[1]) // and close < vwap(hlc3)


/// Start date
startDate = input(title="Start Date", defval=1, minval=1, maxval=31)
startMonth = input(title="Start Month", defval=1, minval=1, maxval=12)
startYear = input(title="Start Year", defval=2021, minval=1800, maxval=2100)


// See if this bar's time happened on/after start date
afterStartDate = true


///Entries and Exits//
if (long and afterStartDate)
    strategy.entry("Long", strategy.long, comment = "Open Long")
//    strategy.close("Short", strategy.short,qty_percent=100, comment = "close Short")
if (short and afterStartDate)
    strategy.entry("Short", strategy.short, comment = "Open Short")


if (close_long and afterStartDate  )
    strategy.close("Long", strategy.long, qty_percent=100, comment="close Long")
//    strategy.entry("Short", strategy.short, comment="Open Short")

if (close_short and afterStartDate  )
    strategy.close("Short", strategy.short, qty_percent=100, comment="close Long")

if ( hour(time) == 15 and minute(time) > 15 )
    strategy.close_all()


//Submit exit orders based on take profit price
if (strategy.position_size > 0 and afterStartDate)
    strategy.exit(id="Long", qty_percent=tp, limit=longExitPrice)

if (strategy.position_size < 0 and afterStartDate)
    strategy.exit(id="Short", qty_percent=tp, limit=shortExitPrice)