Strategi Breakout Konfirmasi Ganda
Ringkasan
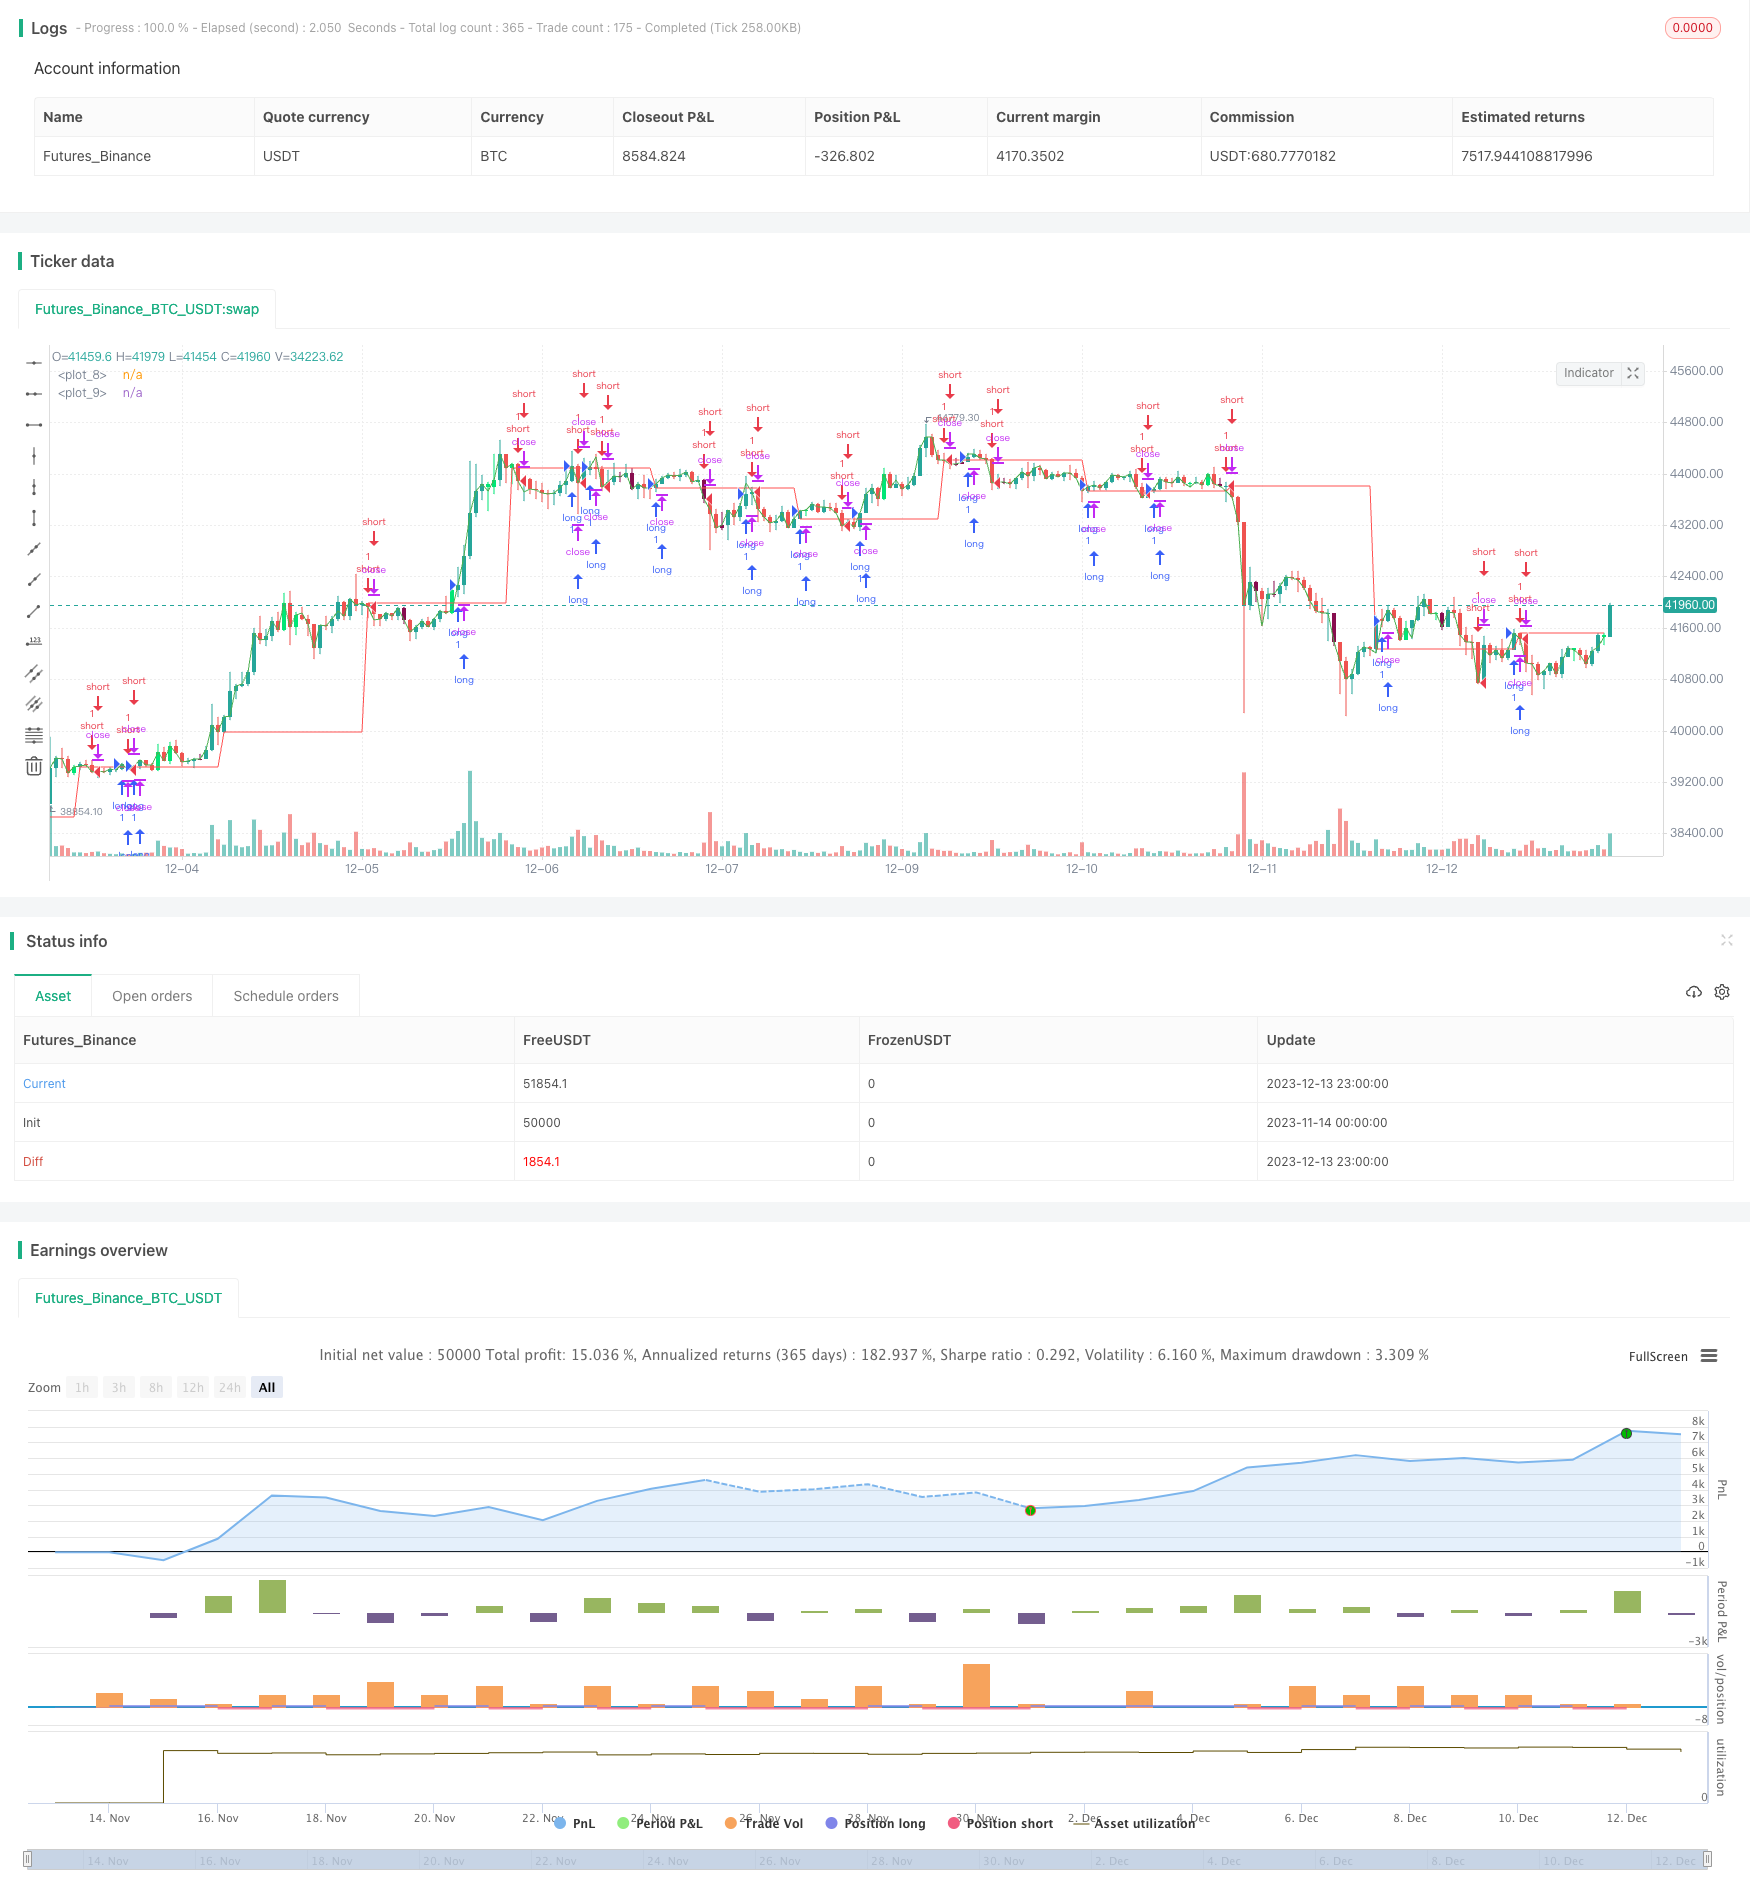
Strategi ini menggabungkan sinyal terobosan pada siklus waktu 4 jam dan siklus waktu garis matahari, dan akan memeriksa bentuk garis K sebelum sinyal perdagangan dikeluarkan, sehingga memungkinkan strategi perdagangan terobosan yang lebih andal.
Prinsip Strategi
Strategi double confirmation breakout mengidentifikasi titik-titik breakout yang lebih efektif dengan menggunakan kombinasi sinyal breakout dari periode pendek dan periode panjang, dengan asumsi konsistensi tren periode pendek dan panjang. Secara khusus, strategi ini menghitung rata-rata pada periode 4 jam dan waktu matahari secara terpisah, menghasilkan sinyal beli ketika rata-rata periode pendek menembus rata-rata periode panjang, dan sebaliknya menghasilkan sinyal jual. Selain itu, strategi ini juga akan melakukan pemeriksaan pada bentuk garis K saat ini sebelum sinyal perdagangan dikeluarkan, untuk menghindari pembukaan posisi pada garis K dari apsing.
Dengan mekanisme double confirmation dan K-line filtering yang disebutkan di atas, dapat secara efektif menghindari risiko multi-head stop loss atau overhead yang tertutup, meningkatkan kualitas sinyal perdagangan.
Analisis Keunggulan
Penembusan siklus waktu ganda dapat meningkatkan kualitas sinyal. Kombinasi 4 jam dan garis matahari, membuat sinyal memiliki keunggulan untuk melacak tren jangka pendek dan merujuk pada tren jangka panjang.
K linear formasi pemeriksaan, dapat menghindari kesalahan sinyal. Sebelum sinyal yang dikirimkan formasi pemeriksaan, dapat memfilter beberapa false breakthrough atau out-of-band breakthrough, untuk menghindari kerugian.
Optimasi otomatis, fleksibilitas dan kemudahan. Parameter terobosan dan parameter siklus dari strategi ini dapat disesuaikan, dan pengguna dapat memilih kombinasi parameter terbaik sesuai dengan varietas dan pasar perdagangan yang berbeda.
Analisis risiko
Strategi double breakout memiliki kemampuan yang lebih lemah untuk mengikuti tren turunnya tren bullish. Strategi ini mungkin akan kehilangan posisi terdepan ketika terjadi tren bullish pada periode pendek dan periode panjang.
K linearity validation mechanism mungkin akan melewatkan beberapa kesempatan. K linearity sering mengalami distorsi dalam situasi ekstrem, dan validation mechanism akan membuat strategi konservatif dan melewatkan beberapa kesempatan.
Parameter yang tidak tepat juga dapat menghasilkan sinyal yang salah. Pengguna perlu memilih parameter double breakout dan parameter K-line yang sesuai sesuai dengan varietas tertentu. Parameter yang tidak tepat dapat mengurangi efektivitas strategi.
Untuk risiko di atas, dapat ditingkatkan dan dioptimalkan dengan cara menyesuaikan kombinasi parameter, mengatur kondisi stop loss dan sebagainya.
Arah optimasi
Dengan kombinasi indikator volatilitas untuk melakukan verifikasi dua kali terhadap terobosan. Misalnya, sinyal terobosan yang dikeluarkan saat Bollinger Bands squeezed, akan memiliki kualitas yang lebih tinggi.
Tambahkan modul Stop Loss Stop. Pengaturan Stop Loss yang tepat dapat mengunci keuntungan dan menghindari risiko secara proaktif.
Optimalkan parameter double breakout. Parameter dapat merujuk pada karakteristik varietas seperti fluktuasi dalam hari, fluktuasi garis hari.
Mengoptimalkan K-line verifikasi parameter. K-line verifikasi dengan siklus yang berbeda dan kombinasi parameter, dapat memperoleh hasil yang lebih stabil.
Meringkaskan
Strategi penembusan konfirmasi ganda adalah strategi penembusan jalur pendek yang disarankan. Pengguna dapat menyesuaikan parameter terkait sesuai dengan kebutuhan mereka sendiri untuk mendapatkan hasil yang lebih baik dengan menggabungkan mekanisme verifikasi bentuk dua siklus waktu dan K-line.
/*backtest
start: 2023-11-14 00:00:00
end: 2023-12-14 00:00:00
period: 1h
basePeriod: 15m
exchanges: [{"eid":"Futures_Binance","currency":"BTC_USDT"}]
*/

//@version=2
strategy("breakout ", overlay=true)
tim=input('1440')
sim=input('370')

out1 = request.security(syminfo.tickerid, tim, open)
out2 = request.security(syminfo.tickerid, sim, close)
plot(out1,color=red)
plot(out2,color=green)

length = input(20, title="BB Length")
mult = input(2.0,title="BB MultFactor")
lengthKC=input(20, title="KC Length")
multKC = input(1.5, title="KC MultFactor")

useTrueRange = input(true, title="Use TrueRange (KC)", type=bool)

// Calculate BB
source = close
basis = sma(source, length)
dev = multKC * stdev(source, length)
upperBB = basis + dev
lowerBB = basis - dev

// Calculate KC
ma = sma(source, lengthKC)
range1 = useTrueRange ? tr : (high - low)
rangema = sma(range1, lengthKC)
upperKC = ma + rangema * multKC
lowerKC = ma - rangema * multKC

sqzOn  = (lowerBB > lowerKC) and (upperBB < upperKC)
sqzOff = (lowerBB < lowerKC) and (upperBB > upperKC)
noSqz  = (sqzOn == false) and (sqzOff == false)

val = linreg(source  -  avg(avg(highest(high, lengthKC), lowest(low, lengthKC)),sma(close,lengthKC)),lengthKC,0)

bcolor = iff( val > 0,iff( val > nz(val[1]), lime, green),iff( val < nz(val[1]), red, maroon))
scolor = noSqz ? blue : sqzOn ? black : gray
//plot(val, color=bcolor, style=histogram, linewidth=4)
//plot(0, color=scolor, style=cross, linewidth=2)

// this section based on Almost Zero Lag EMA [LazyBear]
// Fast MA - type, length
matype   = input(defval="HullMA", title="Fast MA Type: SMA, EMA, WMA, VWMA, SMMA, DEMA, TEMA, HullMA, TMA, ZEMA ( case sensitive )")
malength = input(defval=20, title="Moving Average Length", minval=1)
src      = input(close,title="Moving average Source")

// Returns MA input selection variant, default to SMA if blank or typo.
variant(type, src, len) =>
    v1 = sma(src, len)                                                  // Simple
    v2 = ema(src, len)                                                  // Exponential
    v3 = wma(src, len)                                                  // Weighted
    v4 = vwma(src, len)                                                 // Volume Weighted
    v5 = na(v5[1]) ? sma(src, len) : (v5[1] * (len - 1) + src) / len    // Smoothed
    v6 = 2 * v2 - ema(v2, len)                                          // Double Exponential
    v7 = 3 * (v2 - ema(v2, len)) + ema(ema(v2, len), len)               // Triple Exponential
    v8 = wma(2 * wma(src, len / 2) - wma(src, len), round(sqrt(len)))   // Hull
    ema1 = ema(src, len)
    ema2 = ema(ema1, len)
    v10 = ema1+(ema1-ema2)                                              // Zero Lag Exponential
    v11 = sma(sma(src,len),len)                                         // Trianglular
    // return variant, defaults to SMA if input invalid.
    type=="EMA"?v2 : type=="WMA"?v3 : type=="VWMA"?v4 : type=="SMMA"?v5 : type=="DEMA"?v6 : type=="TEMA"?v7 : type=="HullMA"?v8 : type=="ZEMA"?v10 : type=="TMA"?v11 : v1

// Calculate selected MA and get direction of trend from it.
zlema= variant(matype,src,malength)
col =  zlema > zlema[1] ? green : red
up = zlema > zlema[1] ? 1 : 0
down = zlema < zlema[1] ? 1 : 0
//plot(zlema,color=col, style=line, linewidth=4, transp=0)


// Find all Fractals.
// This section based on [RS]Fractal Levels  by RicardoSantos
hidefractals = input(false)
hidelevels = input(false)
topfractal = high[2] > high[1] and high[2] > high and high[2] > high[3] and high[2] > high[4]
botfractal = low[2] < low[1] and low[2] < low and low[2] < low[3] and low[2] < low[4]

//plotshape(hidefractals ? na : topfractal, color=green, transp=0, style=shape.triangleup, location=location.abovebar, offset=-2, size=size.tiny)
//plotshape(hidefractals ? na : botfractal, color=red, transp=0, style=shape.triangledown, location=location.belowbar, offset=-2, size=size.tiny)

topfractals = topfractal ? high[2] : topfractals[1]
botfractals = botfractal ? low[2] : botfractals[1]

topfcolor = topfractals != topfractals[1] ? na : green
botfcolor = botfractals != botfractals[1] ? na : red

//plot(hidelevels ? na : topfractals, color=topfcolor, transp=0, linewidth=2)
//plot(hidelevels ? na : botfractals, color=botfcolor, transp=0, linewidth=2)

//
// This section based on Candlestick Patterns With EMA by rmwaddelljr
//
ufb  = input(false, title="Use Fractal S/R Cross Patterns")
udc  = input(true, title="Use Dark Cloud Cover Patterns" )
upl  = input(true, title="Use Piecing Line Patterns" )
ube  = input(true, title="Use Engulfing Candle Patterns" )
ubh  = input(true, title="Use Harami Candle Patterns" )
upb  = input(true,  title="Use Defined PinBar Patterns")
pctP = input(66, minval=1, maxval=99, title="Directional PBars, % of Range of Candle the Long Wick Has To Be")
// This section based on CM_Price-Action-Bars by ChrisMoody
// Change the pin bar calculation, so can be used for market direction.
urpb= input(false, title="Use CM Price Action Reversal Pin Bars")
usb = input(false, title="Use CM Price Action Shaved Bars")
uob = input(false, title="Use CM Price Action Outside Bars")
uib = input(false, title="Use CM Price Action Inside Bars")
pctRP = input(72, minval=1, maxval=99, title="CM Reversal PBars, % of Range of Candle the Long Wick Has To Be")
pctS = input(5, minval=1, maxval=99, title="CM Shaved Bars, % of Range it Has To Close On The Lows or Highs")
pblb =input(6,minval=1,title="CM Reversal Pin Bar Lookback Length")
//
stnd = input(true, title="Alert Only Patterns Following Trend")
//
// Get MACD for Alert Filtering
umacd  = input(true,title="Alert Only Patterns Confirmed by MACD")
fastMA = input(title="MACD Fast MA Length",  defval = 12, minval = 2)
slowMA = input(title="MACD Slow MA Length",  defval = 26, minval = 7)
signal = input(title="MACD Signal Length",defval=9,minval=1)

//
sgb = input(false, title="Check Box To Turn Bars Gray")
salc = input(true, title="Show Alert condition Dot")
//
[currMacd,_,_] = macd(close[0], fastMA, slowMA, signal)
[prevMacd,_,_] = macd(close[1], fastMA, slowMA, signal)
plotColor = currMacd > 0 ? currMacd > prevMacd ? green : red : currMacd < prevMacd ? red : green

// Show alert on this bar?
sbarUp = (not umacd or plotColor == green) and (not stnd or up)
sbarDn = (not umacd or plotColor == red) and (not stnd or down)

//PBar Percentages
pctCp = pctP * .01

//Shaved Bars Percentages
pctCs = pctS * .01
pctSPO = pctCs
//ma50 = sma(close,50)

range = high - low

///Reversal PinBars
pctCRp = pctRP * .01
pctCRPO = 1 - pctCRp
//
//pBarRUp= upb and open<close and open > high - (range * pctCRPO) and close > high - (range * pctCRPO) and low <= lowest(pblb) ? 1 : 0
//pBarRDn = upb and open>close and open < high - (range *  pctCRp) and close < high-(range * pctCRp) and high >= highest(pblb) ? 1 : 0
pBarRUp = urpb and  open > high - (range * pctCRPO) and close > high - (range * pctCRPO) and low <= lowest(pblb) ? 1 : 0
pBarRDn = urpb and  open < high - (range *  pctCRp) and close < high-(range * pctCRp) and high >= highest(pblb) ? 1 : 0

//Shaved Bars filter to the MA50 line
sBarUp   = usb and (close >= (high - (range * pctCs))) // and close>ma50
sBarDown = usb and (close <= (low + (range * pctCs)))  // and close<ma50

//Inside Bars
insideBarUp = uib and (high < high[1] and low > low[1])
insideBarDn = uib and (high < high[1] and low > low[1])
outsideBarUp= uob and (high > high[1] and low < low[1])
outsideBarDn= uob and (high > high[1] and low < low[1])

// PinBars representing possible change in trend direction
barcolor(pBarRUp ? green : na)
barcolor(pBarRDn ? red : na)

//Shaved Bars
barcolor(sBarDown ? fuchsia : na)
barcolor(sBarUp   ? aqua : na)

//Inside and Outside Bars
barcolor((insideBarUp or insideBarDn)? yellow : na )
barcolor((outsideBarUp or outsideBarDn) ? orange : na )


//Long shadow PinBars supporting market direction
///PinBars Long Upper Shadow represent selling pressure
pBarDn = upb and open < high - (range * pctCp) and close < high - (range * pctCp)
//plotshape(pBarDn and (not pBarRUp and not pBarRDn), title= "Bearish Pin Bar",  color=red, style=shape.arrowdown, text="Bearish\nPinBar")
///PinBars with Long Lower Shadow represent buying pressure
pBarUp = upb and open > low + (range * pctCp) and close > low + (range * pctCp)
//plotshape(pBarUp and (not pBarRUp and not pBarRDn),  title= "Bullish Pin Bar", location=location.belowbar, color=green, style=shape.arrowup, text="Bullish\nPinBar")

dcc = udc and (close[1]>open[1] and abs(close[1]-open[1])/range[1]>=0.7 and close<open and abs(close-open)/range>=0.7 and open>=close[1] and close>open[1] and close<((open[1]+close[1])/2))
//plotshape(dcc, title="Dark Cloud Cover",text='DarkCloud\nCover',color=red, style=shape.arrowdown,location=location.abovebar)
ts = timestamp(2021,8,1,8,18)
pln= upl and (close[1]<open[1] and abs(open[1]-close[1])/range[1]>=0.7 and close>open and abs(close-open)/range>=0.7 and open<=close[1] and close<open[1] and close>((open[1]+close[1])/2))
//plotshape(pln, title="Piercieng Line",text="Piercing\nLine",color=green, style=shape.arrowup,location=location.belowbar)

beh = ubh and (close[1] > open[1] and open > close and open <= close[1] and low >= open[1] and open - close < close[1] - open[1] and (high < high[1] and low > low[1]))
//plotshape(beh and not dcc, title= "Bearish Harami",  color=red, style=shape.arrowdown, text="Bear\nHarami")

blh = ubh and (open[1] > close[1] and close > open and close <= open[1] and high <= open[1] and close - open < open[1] - close[1] and (high < high[1] and low > low[1]))
//plotshape(blh and not pln,  title= "Bullish Harami", location=location.belowbar, color=green, style=shape.arrowup, text="Bull\nHarami")

bee = ube and (close[1] > open[1] and close < open and close<=low[1] and open>= close[1])
//plotshape(bee,  title= "Bearish Engulfing", color=red, style=shape.arrowdown, text="Bearish\nEngulf")

ble = ube and (close[1] < open[1] and close > open and close >= high[1] and open<=close[1])
//plotshape(ble, title= "Bullish Engulfing", location=location.belowbar, color=green, style=shape.arrowup, text="Bullish\nEngulf")

blfr = ufb and crossover(close,topfractals)
//plotshape(blfr and not ble and not blh and not sBarUp, title= "Bullish Fractal Cross", location=location.belowbar, color=green, style=shape.arrowup, text="Fractal\nCross")
befr = ufb and crossunder(close,botfractals)
//plotshape(befr and not bee and not beh and not sBarDown,  title= "Bearish Fractal Cross", color=red, style=shape.arrowdown, text="Fractal\nCross")
//
//
bcolorDn = sbarDn and not(pBarRDn or pBarRUp or sBarDown or insideBarDn or outsideBarDn) and (beh or bee or dcc or befr or pBarDn)
bcolorUp = sbarUp and not(pBarRDn or pBarRUp or sBarUp or insideBarUp or outsideBarUp) and (blh or ble or pln or blfr or pBarUp)
barcolor(bcolorDn ? maroon : na)
barcolor(bcolorUp ? lime : na)
//
barcolor(sgb and close ? gray : na)

bullcnd = pBarUp or pln or blh or ble or blfr
bearcnd = pBarDn or dcc or beh or bee or befr
if(true )
    longCondition = crossover(out2,out1)
    if(longCondition or close > out1 and bullcnd and strategy.position_size == 0)
        strategy.entry("long", strategy.long)

    //if (pBarRUp) // and bullcnd) //and strategy.position_size == 0)
    //    strategy.entry("long", strategy.long)

    shortCondition = crossunder(out2,out1)
    if (shortCondition or close < out1 and bearcnd and strategy.position_size == 0)
        strategy.entry("short", strategy.short)

//
barAlertDn = (sbarDn and (befr or bee or beh or pBarDn  or dcc)) or (sbarDn and (insideBarDn or outsideBarDn or sBarDown)) or pBarRDn
barAlertUp = (sbarUp and (blfr or ble or blh or pBarUp  or pln)) or (sbarUp and (insideBarUp or outsideBarUp or sBarUp))  or pBarRUp
barAlert = barAlertDn or barAlertUp
alertcondition(barAlert,title="CDLTRD Alert", message="CDLTRD Bar Alert")
// show only when alert condition is met and bar closed.
//plotshape(salc and barAlert[1],title= "Alert Indicator Closed", location=location.bottom, color=barAlertDn[1]?red:green, transp=0, style=shape.circle,offset=-1)
//EOF


    //if (pBarRDn) //and bearcnd//and strategy.position_size == 0)
     //   strategy.entry("short", strategy.short)

//strategy.close("long", when = exit)
//strategy.close("short", when = exit2)


//exit3 = sqzOn and sqzOn[1] and sqzOn[2] and sqzOn[3] and sqzOn[4] and sqzOn[5] and sqzOn[6]
//strategy.close("long", when = exit3)
//strategy.close("short", when = exit3)


//else
  //  alertcondition(condition = time > t, message = "Time exceeded")