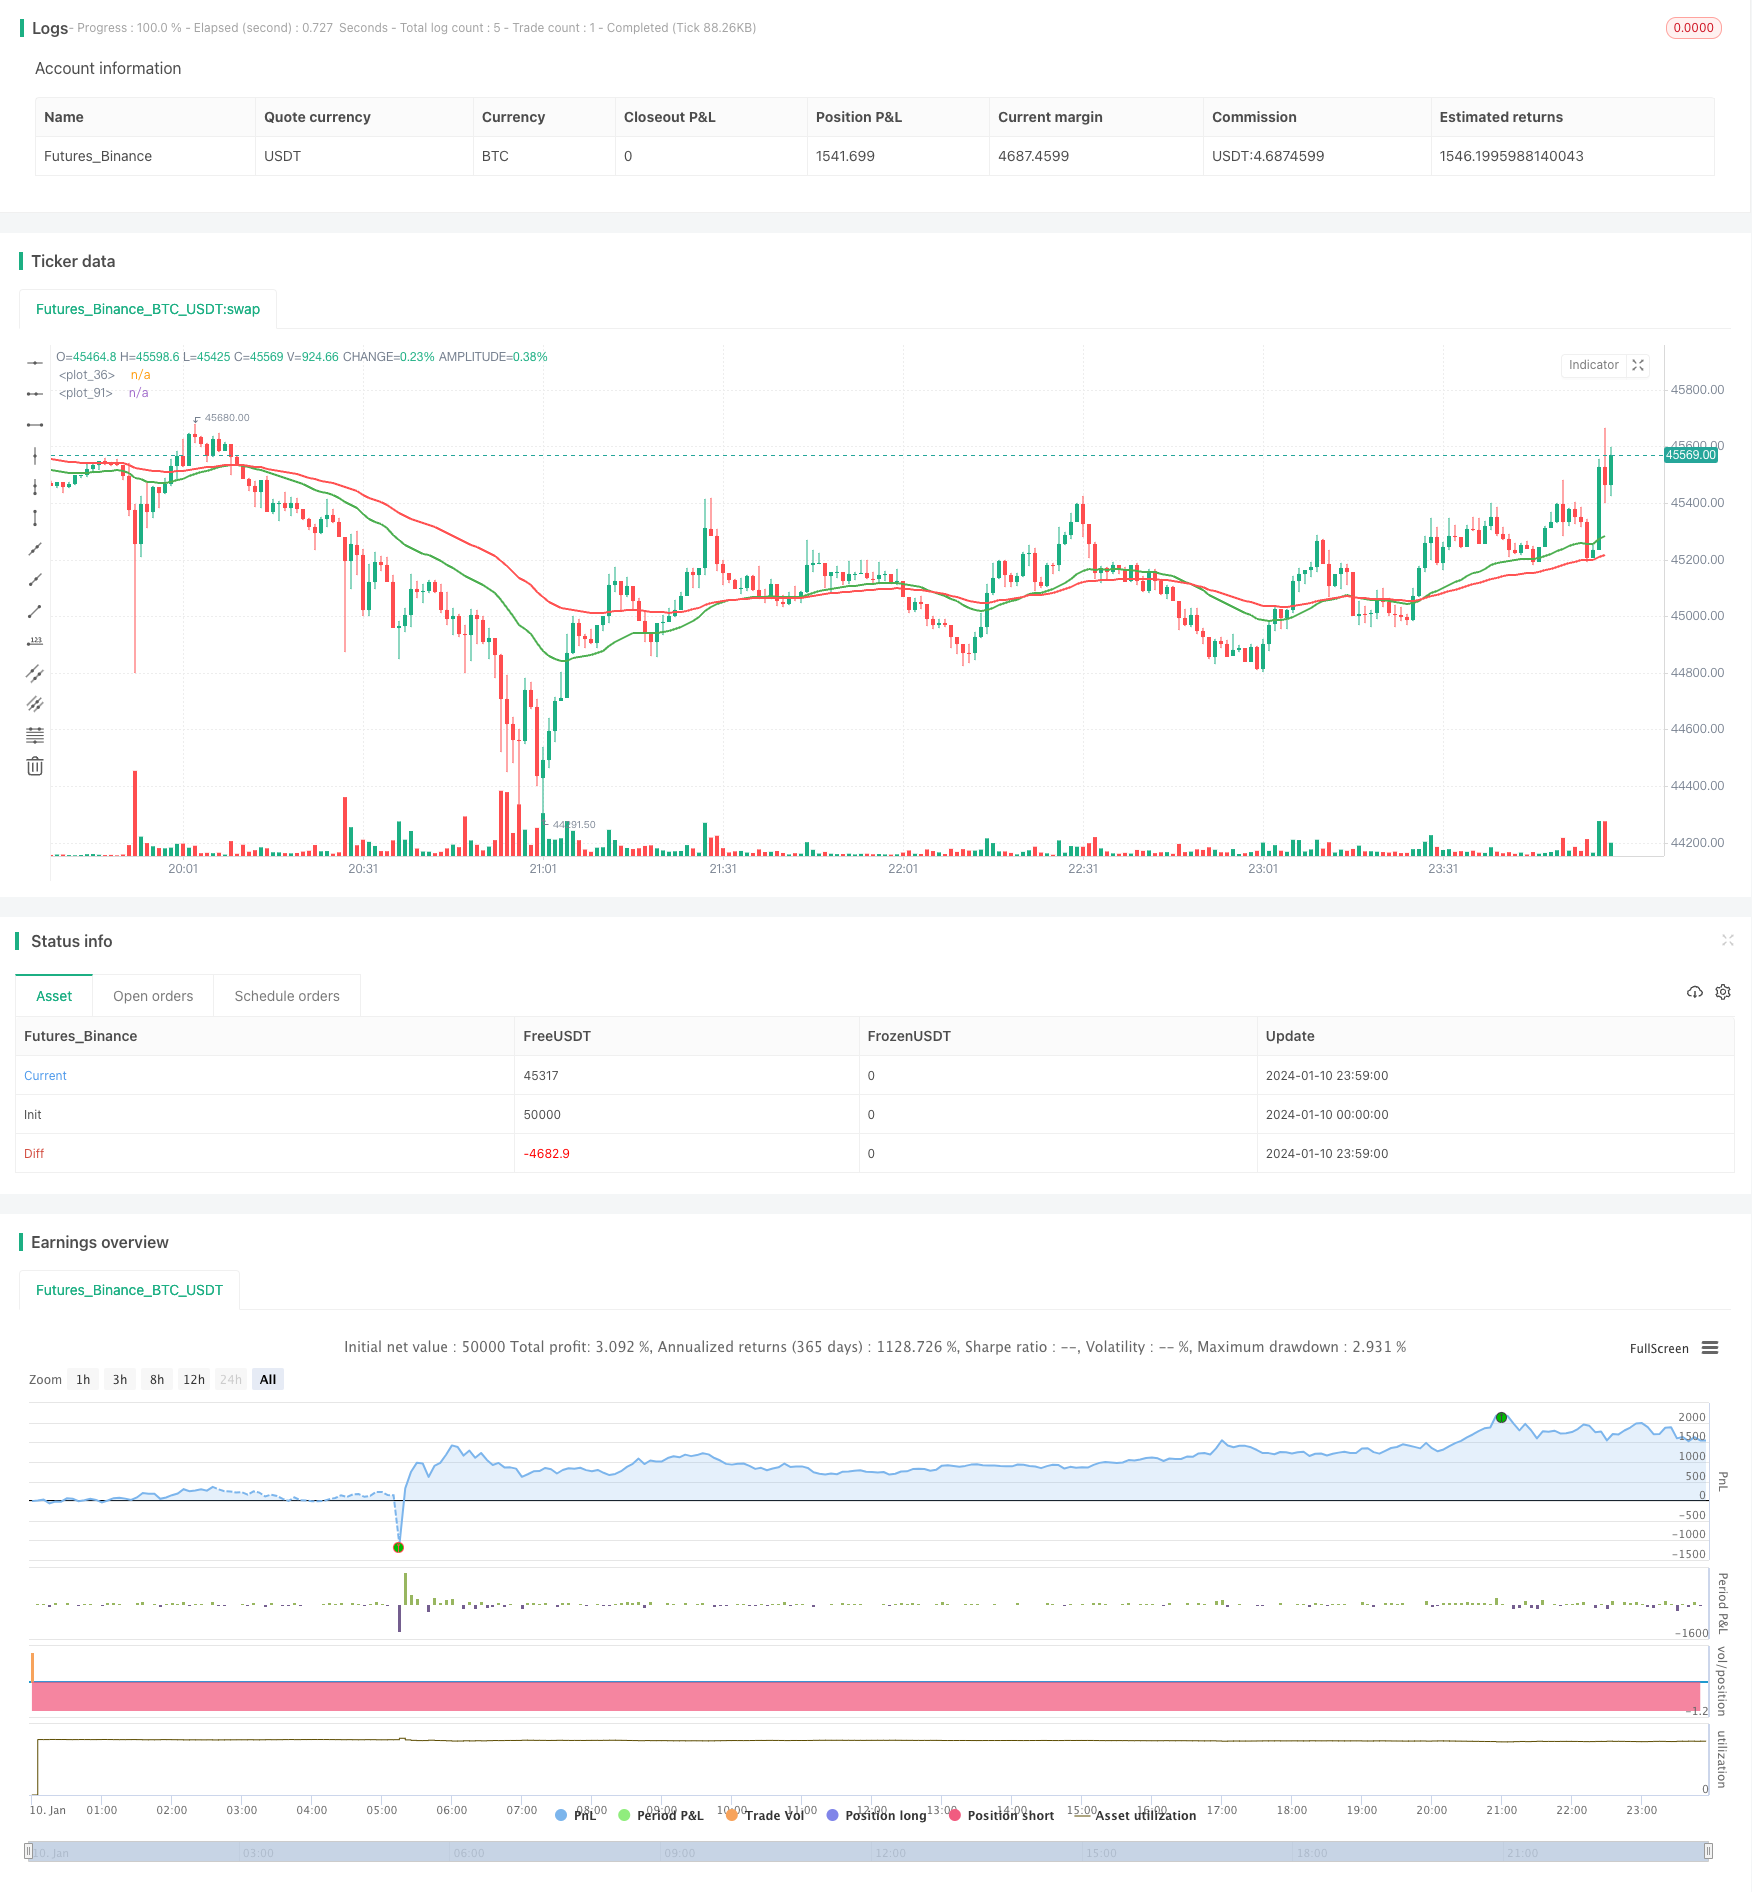
Strategi mengikuti tren yang umum

Ringkasan
Strategi crossover dua rata-rata adalah strategi pelacakan tren yang khas. Ini menggunakan rata-rata EMA dari dua periode yang berbeda, melakukan lebih banyak ketika melewati rata-rata periode panjang di atas rata-rata periode pendek, dan melakukan kosong ketika melewati rata-rata periode panjang di bawah rata-rata periode pendek, untuk menangkap titik balik dari tren harga.
Prinsip Strategi
Indikator inti dari strategi ini adalah dua garis rata-rata EMA, masing-masing 30 siklus dan 60 siklus. Dua garis rata-rata EMA dihitung dalam kode melalui fungsi khusus:
emaLen1 = emaFuncOne(close, lenMA1)
emaLen2 = emaFuncTwo(close, lenMA2)
Sinyal perdagangan strategi berasal dari persilangan dua garis rata EMA:
currentState = if emaLen2 > emaLen1
    0
else
    1

previousState = if emaLastLen2 > emaLastLen1
    0
else
    1

convergence = if currentState != previousState
    1
else
    0
Ketika EMA jangka pendek di atas EMA jangka panjang, currentState tidak sama dengan previousState, muncul sinyal silang. Ketika EMA jangka pendek melewati EMA jangka panjang, currentState tidak sama dengan previousState, muncul sinyal silang.
Analisis Keunggulan
Strategi ini memiliki keuntungan sebagai berikut:
- Strategi yang sederhana, intuitif, mudah dipahami dan diterapkan
- Menggunakan EMA Smoothness untuk Filter Noise Market
- Mengikuti tren secara otomatis, tidak mudah untuk melewatkan pembelian dan penjualan
Analisis risiko
Strategi ini juga memiliki beberapa risiko:
- Sinyal silang dua arah mungkin terlambat dan tidak dapat menangkap pergeseran tepat waktu.
- Beberapa sinyal kesalahan mungkin muncul dalam peristiwa gempa.
- Setting parameter yang salah dapat menyebabkan terlalu sensitif atau terlalu lambat
Hal ini dapat dioptimalkan dengan menyesuaikan siklus EMA, atau dengan menambahkan kondisi penyaringan.
Arah optimasi
Strategi ini dapat dioptimalkan dalam beberapa hal:
- Uji kombinasi siklus EMA dengan panjang yang berbeda
- Meningkatkan volume transaksi atau kondisi fluktuasi untuk memfilter sinyal palsu
- Kombinasi dengan indikator lain yang mengkonfirmasi tren, seperti MACD
- Mengoptimalkan pengelolaan dana, mengatur stop loss
Meringkaskan
Strategi crossover linear ganda secara keseluruhan adalah strategi pelacakan tren yang sederhana dan praktis. Ini adalah strategi yang lurus ke depan, mudah diterapkan, dan dapat secara otomatis mengikuti tren. Namun, ada juga beberapa risiko keterlambatan dan sinyal palsu.
/*backtest
start: 2024-01-10 00:00:00
end: 2024-01-11 00:00:00
period: 1m
basePeriod: 1m
exchanges: [{"eid":"Futures_Binance","currency":"BTC_USDT"}]
*/

//@version=2
strategy("ParkerMAStrat", overlay=true)

lenMA1=input(title="Length 1", defval=30)
lenMA2=input(title="Length 2",  defval=60)

x = 0

checkLines(current, last) =>

    if current > last
        x = 1
    else
        x = 0
    x


//plot ema based on len1
emaFuncOne(src, time_period) =>

    alpha = 2 / (time_period + 1)
    // we have defined the alpha function above
    ema = 0.0
    // this is the initial declaration of ema, since we dont know the first ema we will declare it to 0.0 [as a decimal]
    ema := alpha * src + (1 - alpha) * nz(ema[1])
    // this returns the computed ema at the current time
    // notice the use of : (colon) symbol before =, it symbolises, that we are changing the value of ema,
    // since the ema was previously declared to 0
    // this is called mutable variale declaration in pine script
    ema
    // return ema from the function

emaLen1 = emaFuncOne(close, lenMA1)


plot(emaLen1, color=green, transp=0, linewidth=2)
// now we plot the _10_period_ema

//plot ema based on len2
emaFuncTwo(src, time_period) =>

    alpha = 2 / (time_period + 1)
    // we have defined the alpha function above
    ema = 0.0
    // this is the initial declaration of ema, since we dont know the first ema we will declare it to 0.0 [as a decimal]
    ema := alpha * src + (1 - alpha) * nz(ema[1])
    // this returns the computed ema at the current time
    // notice the use of : (colon) symbol before =, it symbolises, that we are changing the value of ema,
    // since the ema was previously declared to 0
    // this is called mutable variale declaration in pine script
    ema
    // return ema from the function

//plot ema based on len2
emaFuncOneLast(src, time_period) =>

    alpha = 2 / (time_period + 1)
    // we have defined the alpha function above
    ema = 0.0
    // this is the initial declaration of ema, since we dont know the first ema we will declare it to 0.0 [as a decimal]
    ema := alpha * src + (1 - alpha) * nz(ema[0])
    // this returns the computed ema at the current time
    // notice the use of : (colon) symbol before =, it symbolises, that we are changing the value of ema,
    // since the ema was previously declared to 0
    // this is called mutable variale declaration in pine script
    ema
    // return ema from the function

//plot ema based on len2
emaFuncTwoLast(src, time_period) =>

    alpha = 2 / (time_period + 1)
    // we have defined the alpha function above
    ema = 0.0
    // this is the initial declaration of ema, since we dont know the first ema we will declare it to 0.0 [as a decimal]
    ema := alpha * src + (1 - alpha) * nz(ema[0])
    // this returns the computed ema at the current time
    // notice the use of : (colon) symbol before =, it symbolises, that we are changing the value of ema,
    // since the ema was previously declared to 0
    // this is called mutable variale declaration in pine script
    ema
    // return ema from the function


emaLastLen1 = emaFuncOneLast(close, lenMA1)
emaLastLen2 = emaFuncTwoLast(close, lenMA2)
emaLen2 = emaFuncTwo(close, lenMA2)


plot(emaLen2, color=red, transp=30, linewidth=2)
// now we plot the _10_period_ema

//now we compare the two and when green crosses red we buy/sell (line1 vs line2)

previousState = if emaLastLen2 > emaLastLen1
    0
else
    1

currentState = if emaLen2 > emaLen1
    0
else
    1

convergence = if currentState != previousState
    1
else
    0


lineCheck = if convergence == 1
    checkLines(currentState, previousState)

if lineCheck == 1
    strategy.entry("Long", strategy.long)
else
    strategy.entry("Short", strategy.short)