Strategi penilaian tren dinamis MACD berdasarkan rata-rata pergerakan
Tanggal Pembuatan:
2024-02-19 10:48:11
Akhirnya memodifikasi:
2024-02-19 10:48:11
menyalin:
0
Jumlah klik:
363
1
fokus pada
1224
Pengikut
Ringkasan
Strategi ini didasarkan pada kombinasi garis rata dari indikator MACD, untuk mencapai penilaian tren dinamis selama periode waktu, dan merupakan strategi pelacakan tren yang lebih klasik. Strategi ini terutama menilai arah dan kekuatan tren saat ini melalui hubungan antara MACD dan garis sinyalnya dengan perbedaan garis rata-rata yang cepat dan lambat.
Prinsip Strategi
- Berdasarkan MACD indikator laju rata-rata perbedaan garis dan hubungan garis sinyal untuk menilai arah tren saat ini
- MACD di atas adalah sinyal multi dan di bawah adalah sinyal kosong
- Masukkan perbedaan MACD dan MACD column simetris sebagai sinyal peningkatan strategi
- Menambahkan modul penilaian lintas-siklus, mengambil indikator MACD periode waktu yang lebih tinggi sebagai basis untuk penyaringan sinyal dan penyesuaian posisi
- Peningkatan posisi saat sinyal kuat, penurunan posisi saat sinyal lemah
Analisis Keunggulan
- Indikator MACD sendiri lebih efektif dalam menentukan arah tren
- Kombinasi perbedaan MACD dan verifikasi ganda bar dapat meningkatkan akurasi sinyal
- Penghakiman lintas-siklus meningkatkan stabilitas strategi dan menghindari sinyal frekuensi tinggi yang salah
- Perubahan posisi yang dinamis memungkinkan strategi untuk memanfaatkan peluang dengan lebih baik dan meningkatkan keuntungan tambahan.
Analisis Risiko dan Solusi
- Sinyal MACD mengalami lag, yang dapat menyebabkan efek sinyal yang sedikit buruk
- Solusi: Tambahkan rata-rata kecepatan cepat dan rata-rata kecepatan lambat untuk menangkap sinyal lebih awal
- Sinyal lintas-siklus tidak selalu akurat dan dapat menyesatkan strategi
- Solusi: Memperkenalkan mekanisme penyesuaian posisi yang dinamis, sehingga strategi siklus utama menjadi dominan
- Strategi kombinasi multi-faktor mungkin kurang stabil secara keseluruhan
- Solusi: Menyesuaikan parameter strategi dengan hati-hati untuk memastikan kesejahteraan secara keseluruhan
Arah optimasi
- Uji efek dari kombinasi parameter periode yang berbeda
- Pengujian efek dari berbagai kombinasi lintas siklus terhadap efektivitas strategi
- Menyesuaikan parameter indikator MACD, seperti siklus rata-rata lambat, siklus sinyal, dan lain-lain
- Uji efek dari faktor regulasi posisi yang berbeda
- Hasil pengujian pada varietas lain
Meringkaskan
MACD menggabungkan strategi tren dinamis lintas-siklus, mengintegrasikan keunggulan dari penilaian indikator klasik dan referensi multi-frame waktu. Dengan optimasi parameter dan pengujian kombinasi, strategi pelacakan tren yang lebih stabil dan menguntungkan dapat dibangun.
Kode Sumber Strategi
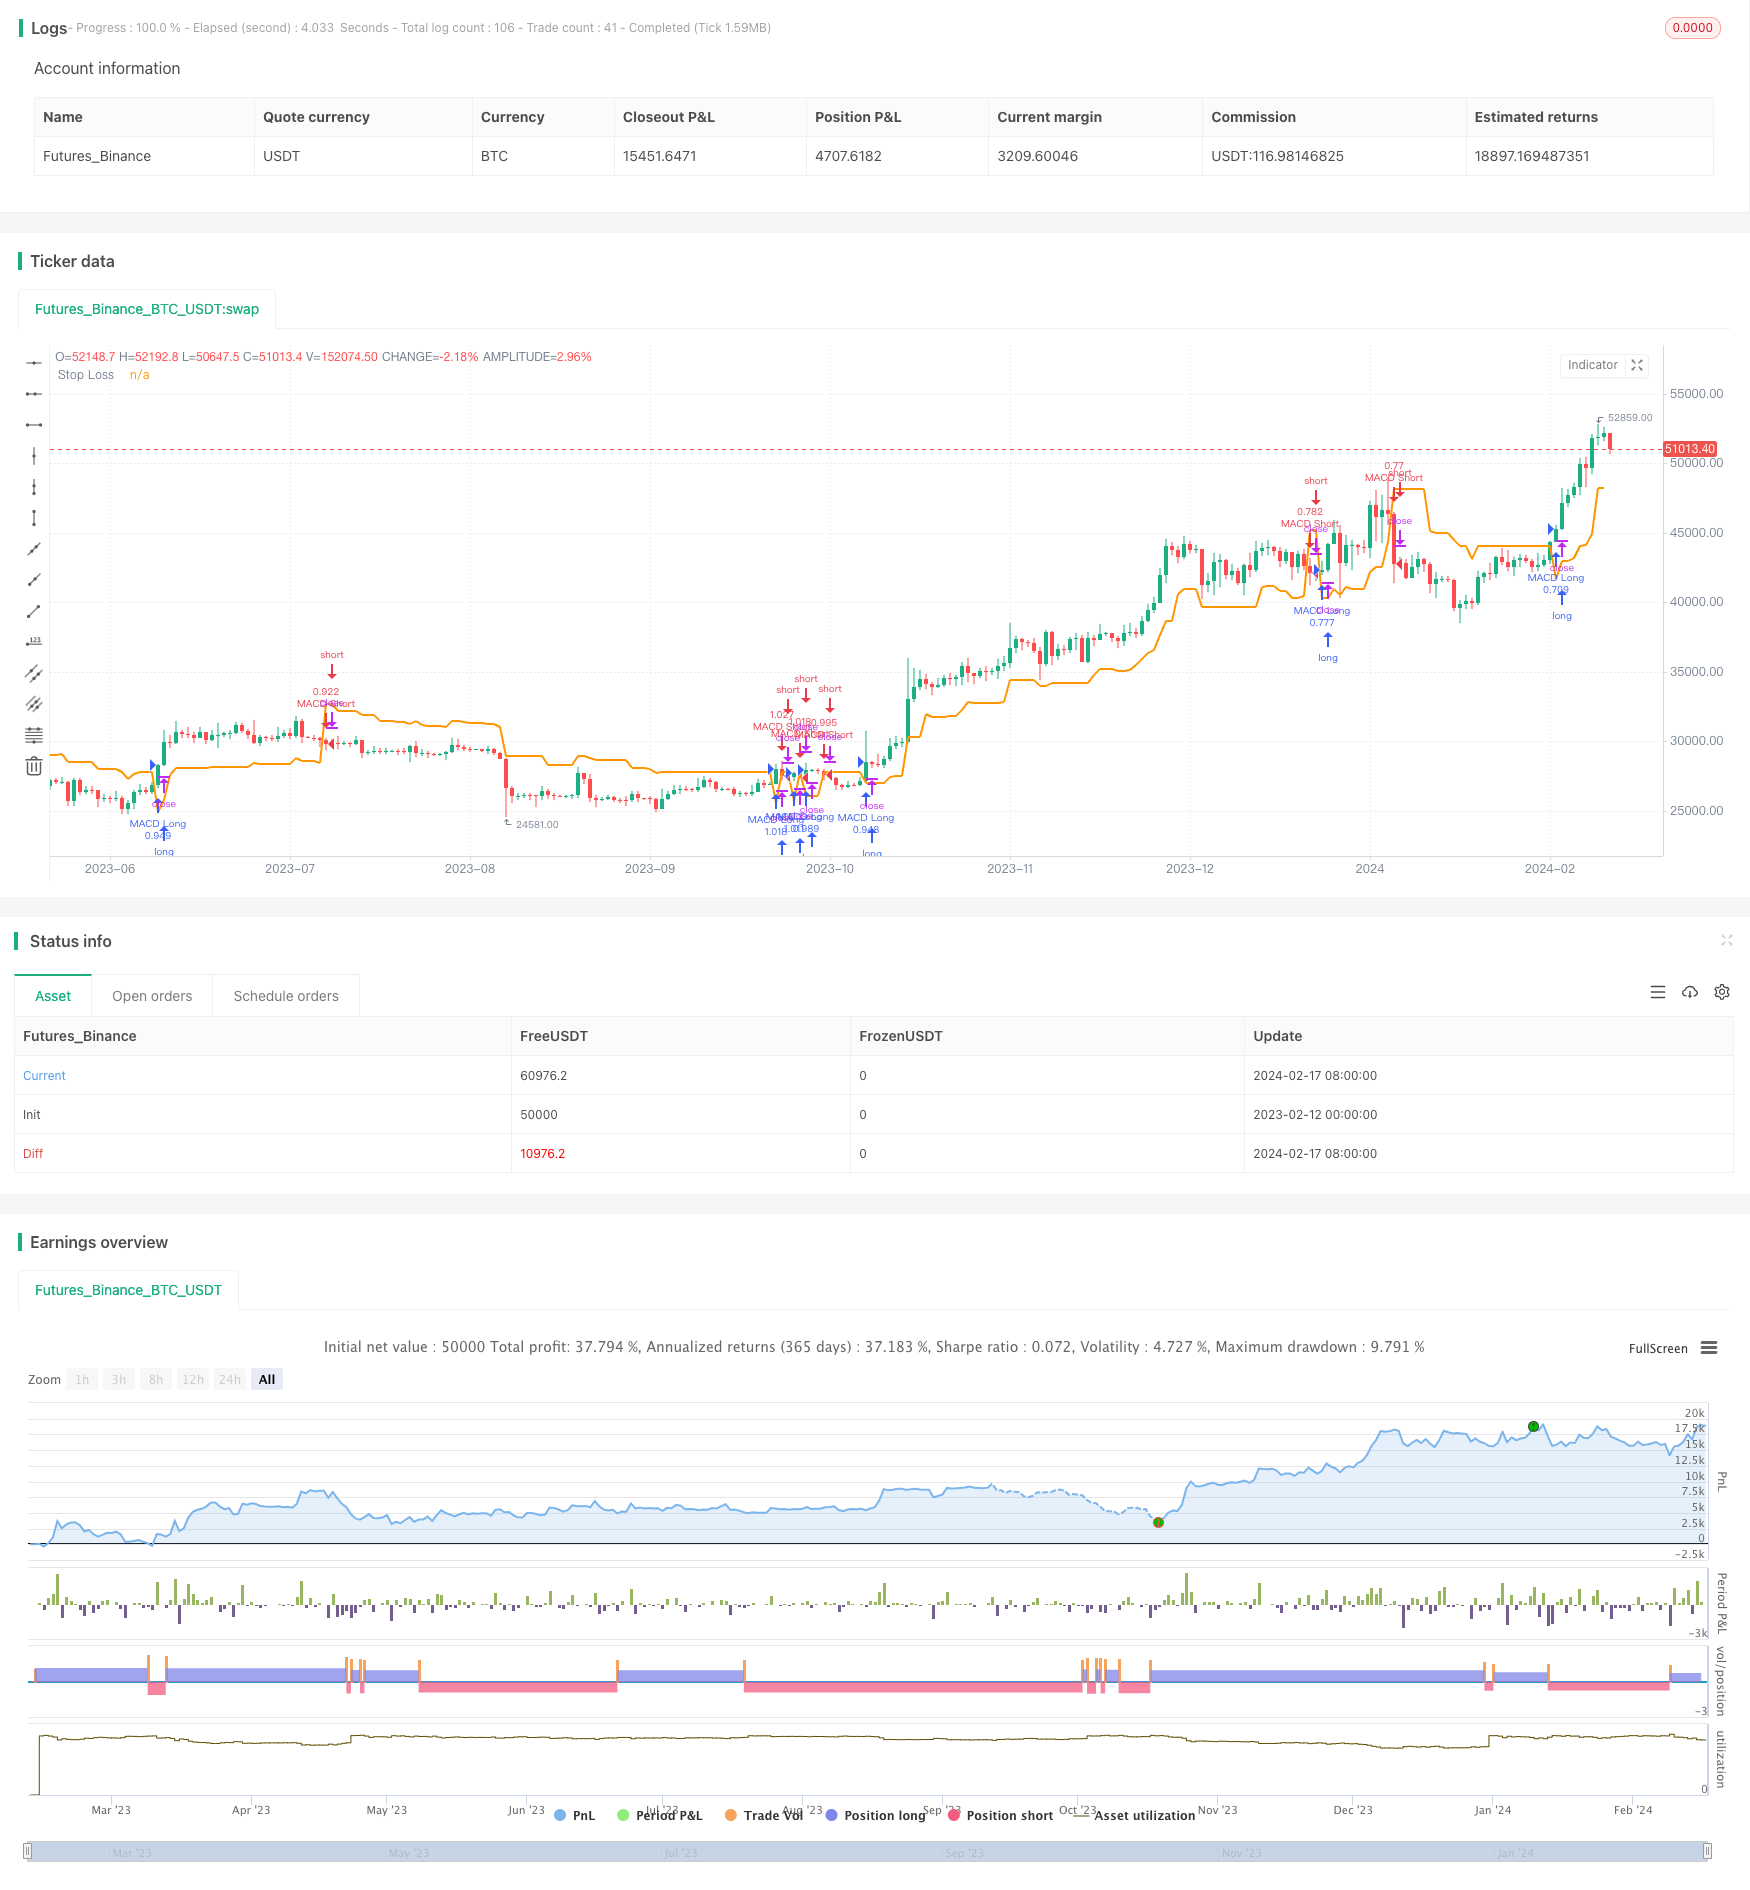
/*backtest
start: 2023-02-12 00:00:00
end: 2024-02-18 00:00:00
period: 1d
basePeriod: 1h
exchanges: [{"eid":"Futures_Binance","currency":"BTC_USDT"}]
*/

//@temelbulut
//@version=5
strategy('MACD Strategy %80', overlay=true, default_qty_type=strategy.percent_of_equity, default_qty_value=50)

fastLength = input.int(title='MACD Fast Length', defval=12, minval=1)
slowLength = input.int(title='MACD Slow Length', defval=26, minval=1)
signalLength = input.int(title='MACD Signal Length', defval=9, minval=1)
crossscore = input(title='Cross (buy/sell) Score', defval=10.)
indiside = input(title='indicator Direction Score', defval=8)
histside = input(title='Histogram Direction Score', defval=2)
shotsl = input(title='Show Stop Loss Line', defval=false)
Mult = input.float(title='Stop Loss Factor', defval=1.2, minval=0.1, maxval=100)
Period = input.int(title='Stop Loss Period', defval=10, minval=1, maxval=100)
lookaheadi = input(title='Lookahead', defval=true)

HTF = timeframe.period == '1' ? '5' : timeframe.period == '3' ? '15' : timeframe.period == '5' ? '15' : timeframe.period == '15' ? '60' : timeframe.period == '30' ? '60' : timeframe.period == '45' ? '60' : timeframe.period == '60' ? '240' : timeframe.period == '120' ? '240' : timeframe.period == '180' ? '240' : timeframe.period == '240' ? 'D' : timeframe.period == 'D' ? 'W' : 'W'

calc = timeframe.period == '1' ? 5 : timeframe.period == '3' ? 5 : timeframe.period == '5' ? 3 : timeframe.period == '15' ? 4 : timeframe.period == '30' ? 4 : timeframe.period == '45' ? 4 : timeframe.period == '60' ? 4 : timeframe.period == '120' ? 3 : timeframe.period == '180' ? 3 : timeframe.period == '240' ? 6 : timeframe.period == 'D' ? 5 : 1

count() =>
    indi = ta.ema(close, fastLength) - ta.ema(close, slowLength)
    signal = ta.ema(indi, signalLength)
    Anlyse = 0.0
    // direction of indi and histogram
    hist = indi - signal
    Anlyse := indi > indi[1] ? hist > hist[1] ? indiside + histside : hist == hist[1] ? indiside : indiside - histside : 0
    Anlyse += (indi < indi[1] ? hist < hist[1] ? -(indiside + histside) : hist == hist[1] ? -indiside : -(indiside - histside) : 0)
    Anlyse += (indi == indi[1] ? hist > hist[1] ? histside : hist < hist[1] ? -histside : 0 : 0)
    // cross now earlier ?
    countcross = indi >= signal and indi[1] < signal[1] ? crossscore : indi <= signal and indi[1] > signal[1] ? -crossscore : 0.
    countcross += nz(countcross[1]) * 0.6
    Anlyse += countcross
    nz(Anlyse)

Anlys = count()
AnlysHfrm = lookaheadi ? request.security(syminfo.tickerid, HTF, count(), lookahead=barmerge.lookahead_on) : request.security(syminfo.tickerid, HTF, count(), lookahead=barmerge.lookahead_off)
Result = (AnlysHfrm * calc + Anlys) / (calc + 1)

longCondition = ta.change(Result) != 0 and Result > 0
if longCondition
    strategy.entry('MACD Long', strategy.long,alert_message = 'MACD Long')

shortCondition = ta.change(Result) != 0 and Result < 0
if shortCondition
    strategy.entry('MACD Short', strategy.short,alert_message = 'MACD Short')

countstop(pos) =>
    Upt = hl2 - Mult * ta.atr(Period)
    Dnt = hl2 + Mult * ta.atr(Period)
    TUp = 0.
    TDown = 0.
    TUp := close[1] > TUp[1] ? math.max(Upt, TUp[1]) : Upt
    TDown := close[1] < TDown[1] ? math.min(Dnt, TDown[1]) : Dnt
    tslmtf = pos == 1 ? TUp : TDown
    tslmtf

pos = longCondition ? 1 : -1
stline = 0.
countstop__1 = countstop(pos)
security_1 = request.security(syminfo.tickerid, HTF, countstop__1)
stline := ta.change(time(HTF)) != 0 or longCondition or shortCondition ? security_1 : nz(stline[1])
plot(stline, color=shotsl ? color.rgb(148, 169, 18) : na, style=plot.style_line, linewidth=2, title='Stop Loss')