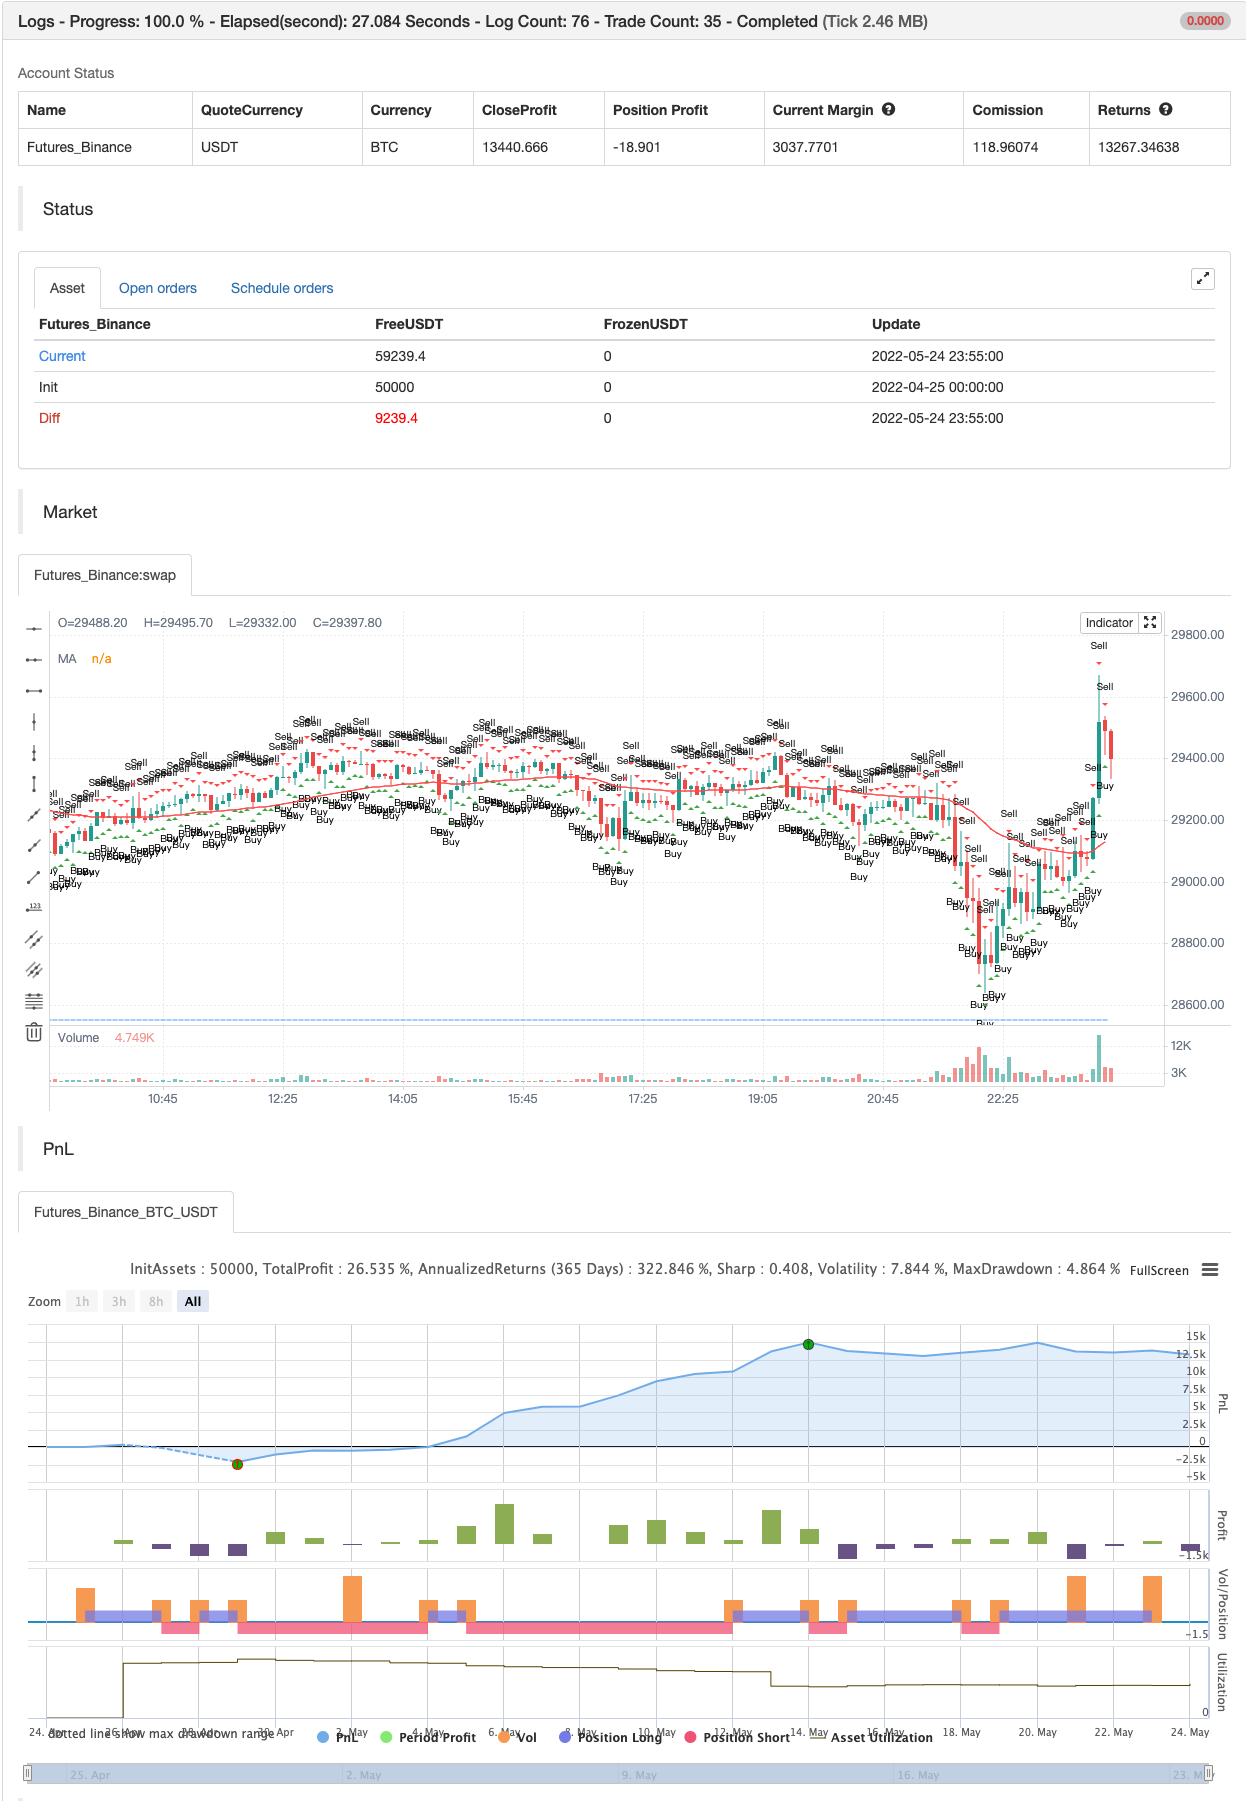
Scalping EMA ADX RSI 購入/売却
作者: リン・ハーンチャオチャン, 日付: 2022-05-26 17:11:01タグ:ADXRMARSIエイマSMAWMA
これはYouTubeチャンネルの1つで見た戦略のエントリを示す研究指標なので,それは私のものではありません.広告をするのはハウスルールに反しているため,誰がそれを言うことはできませんが,YouTubeで探せば見つけることができます.オシレーターとEMAのデフォルト値は,提案されたように調整されています.彼は5分間のタイムフレームで最高の結果を得たと言いますが,私はできるだけ変更できるようにしました.あなたが望むなら,設定を混乱させ,異なるタイムフレームのために自分の戦略を作成することができます.通常のキャンドルスティックチャートで使用することをお勧めします.下にある青い線は,ADXが"トレンドレディ"と呼ばれる設定で設定された選択された限界を超えていることを示しています.あなたは購入,販売または購入/販売信号のためのアラートをセットすることができます.
入場戦略自体は 簡単です 自動でチェックして,購入または販売信号を与える: 推奨時間枠: 5分
長期入国の場合:
- 価格が設定された EMA を上回っているかどうかを確認します (設定でこのルールを無効にすることができます)
- RSIは過剰販売で
- ADX は 設定された
Trend Ready 値を超えています (トレンドが続いていることを意味します) - 価格は前回のキャンドルのトレンドを承認しなければならない.これは購入エントリに上昇し,販売エントリに下落する.
- ストップ・ロスは最後のスウィング・ローブより低くなって 1:1または1.5:1の利得率で入力します
短いエントリでは:
- 価格が設定されたEMAを下回っているか確認します (設定でこのルールを無効にできます)
- RSIは過買いです
- ADX は 設定された
Trend Ready 値を超えています (トレンドが続いていることを意味します) - 価格は前回のキャンドルのトレンドを承認しなければならない.これは購入エントリに上昇し,販売エントリに下落する.
- ストップ・ロスは最後のスウィング・ハイ値より上です 1: 1 または 1.5: 1 利得率です
これは私の最初の指標です.何か更新が欲しい場合は教えて下さい. すべてを追加できるかどうか確信はありませんが,それでも試してみます.
変更: RSI が設定された値以下または上にある場合,シグナルが 2 発前にチェックされます.これは入力信号が正しい場合があるため,応答が少し遅れる可能性があります.
バックテスト

/*backtest
start: 2022-04-25 00:00:00
end: 2022-05-24 23:59:00
period: 5m
basePeriod: 1m
exchanges: [{"eid":"Futures_Binance","currency":"BTC_USDT"}]
*/

//@version=5
indicator(title='EMA RSI ADX Scalping Alerts', shorttitle="ERA Scalper", overlay=true)

//Define MA Inputs and group them
maType = input.string(title="MA Type", options=["EMA", "SMA", "WMA", "VWMA", "HMA", "RMA", "DEMA", "TEMA", "LSMA", "ZLSMA"], defval="EMA", group='MA Settings')
emaSource = input.source(title='MA Source', defval=close, group='MA Settings')
emaLength = input.int(title='MA Length', defval=50, minval=1, maxval=999, group='MA Settings')

//Other Moving Avarage Calculations
e1 = ta.ema(emaSource, emaLength)
e2 = ta.ema(e1, emaLength)
dema = 2 * e1 - e2

ema1 = ta.ema(emaSource, emaLength)
ema2 = ta.ema(ema1, emaLength)
ema3 = ta.ema(ema2, emaLength)
tema = 3 * (ema1 - ema2) + ema3

lsmaOffset = input.int(title="LSMA Offset", defval=0, minval=0, maxval=100, tooltip='Only used if you choose the LSMA and ZLSMA(Zero Lag LSMA) Option between MA Types', group='MA Settings')
lsma = ta.linreg(emaSource, emaLength, lsmaOffset)
lsma2 = ta.linreg(lsma, emaLength, lsmaOffset)
eq = lsma-lsma2
zlsma = lsma+eq

// Switch between different MA Types
emaValue = switch maType
    "EMA" => ta.ema(emaSource, emaLength)
    "SMA" => ta.sma(emaSource, emaLength)
    "WMA" => ta.wma(emaSource, emaLength)
    "VWMA" => ta.vwma(emaSource, emaLength)
    "HMA" => ta.hma(emaSource, emaLength)
    "RMA" => ta.rma(emaSource, emaLength)
    "DEMA" => dema
    "TEMA" => tema
    "LSMA" => lsma
    "ZLSMA" => zlsma
    =>
        runtime.error("No matching MA type found.")
        float(na)

//Define RSI inputs and group them
rsiSource = input.source(title='RSI Source', defval=close, group='RSI Settings')
rsiLength = input.int(title='RSI Length', defval=3, minval=0, maxval=100, group='RSI Settings')
rsiValuee = ta.rsi(rsiSource, rsiLength)
rsiOverbought = input.int(title='RSI Overbought Level', defval=80, group='RSI Settings')
rsiOversold = input.int(title='RSI Oversold Level', defval=20, group='RSI Settings')

//Define overbought and oversold conditions
isRsiOB = rsiValuee >= rsiOverbought
isRsiOS = rsiValuee <= rsiOversold

//ADX Inputs and calculation of the value
adxlen = input.int(5, title='ADX Smoothing', group='ADX Settings')
dilen = input.int(5, title='DI Length', group='ADX Settings')
dirmov(len) =>
    up = ta.change(high)
    down = -ta.change(low)
    plusDM = na(up) ? na : up > down and up > 0 ? up : 0
    minusDM = na(down) ? na : down > up and down > 0 ? down : 0
    truerange = ta.rma(ta.tr, len)
    plus = fixnan(100 * ta.rma(plusDM, len) / truerange)
    minus = fixnan(100 * ta.rma(minusDM, len) / truerange)
    [plus, minus]
adx(dilen, adxlen) =>
    [plus, minus] = dirmov(dilen)
    sum = plus + minus
    adx = 100 * ta.rma(math.abs(plus - minus) / (sum == 0 ? 1 : sum), adxlen)
    adx
sig = adx(dilen, adxlen)

//Define the input and value where it is considered that there is a trend going on
adxLimit = input.int(title='Trend Ready Limit', defval=30, minval=0, maxval=100, group='ADX Settings')
trendReady = sig > adxLimit

//Draw trend ready at the bottom of the chart for better viewing so that you can change the value based on what you see easier
plotADX = input(title='Draw Trend Ready On Chart', defval=false)
readyFold = plotADX and sig > adxLimit
plotchar(series=readyFold, title='Trend Ready', location=location.bottom, color=color.new(color.blue, 0), size=size.small, char='_')

//Plot the EMA on chart
enableEmaRule = input(title='Enable MA Rule', defval=true)

//Define the signal conditions and choice to add or leave out MA Rule if you wish so
alertLong = enableEmaRule ? low > emaValue and (rsiValuee <= rsiOversold or rsiValuee[1] <= rsiOversold or rsiValuee[2] <= rsiOversold) and sig > adxLimit and close > high[1] : (rsiValuee <= rsiOversold or rsiValuee[1] <= rsiOversold or rsiValuee[2] <= rsiOversold) and sig > adxLimit and close > high[1]
alertShort = enableEmaRule ? high < emaValue and (rsiValuee >= rsiOverbought or rsiValuee[1] >= rsiOverbought or rsiValuee[2] >= rsiOverbought) and sig > adxLimit and close < low[1] : (rsiValuee >= rsiOverbought or rsiValuee[1] >= rsiOverbought or rsiValuee[2] >= rsiOverbought) and sig > adxLimit and close < low[1]
plot(enableEmaRule ? emaValue : na, color=color.new(color.red, 0), title='MA')

//Buy and Sell Shapes on Chart
plotshape(alertLong, title='Buy', location=location.belowbar, color=color.new(color.green, 0), size=size.small, style=shape.triangleup, text='Buy')
plotshape(alertShort, title='Sell', location=location.abovebar, color=color.new(color.red, 0), size=size.small, style=shape.triangledown, text='Sell')

//Alerts
alertcondition(title='Buy Alert', condition=alertLong, message='Long Conditions are Met')
alertcondition(title='Sell Alert', condition=alertShort, message='Short Conditions are Met')
alertcondition(title='Buy / Sell Alert', condition=alertLong or alertShort, message='Conditions Met for Buy or Short')

if alertLong
    strategy.entry("Enter Long", strategy.long)
else if alertShort
    strategy.entry("Enter Short", strategy.short)
関連性
- スーパースカルパー - 5分 15分
- ダイナミック RSI スマートタイム スウィング トレーディング 戦略
- VWMA-ADX モメンタムとトレンドベースのビットコイン・ロング戦略
- レインボーオシレーター
- アダプティブ・マルチ・ムービング・平均・クロスオーバー・ダイナミック・トレーディング・ストラテジー
- スーパージャンプ バックボリンガー帯
- スーパースカルパー
- エースマ
- よりスマートなMACD
- ダイナミック・ポジション・サイジング 短期・外為取引戦略
もっと