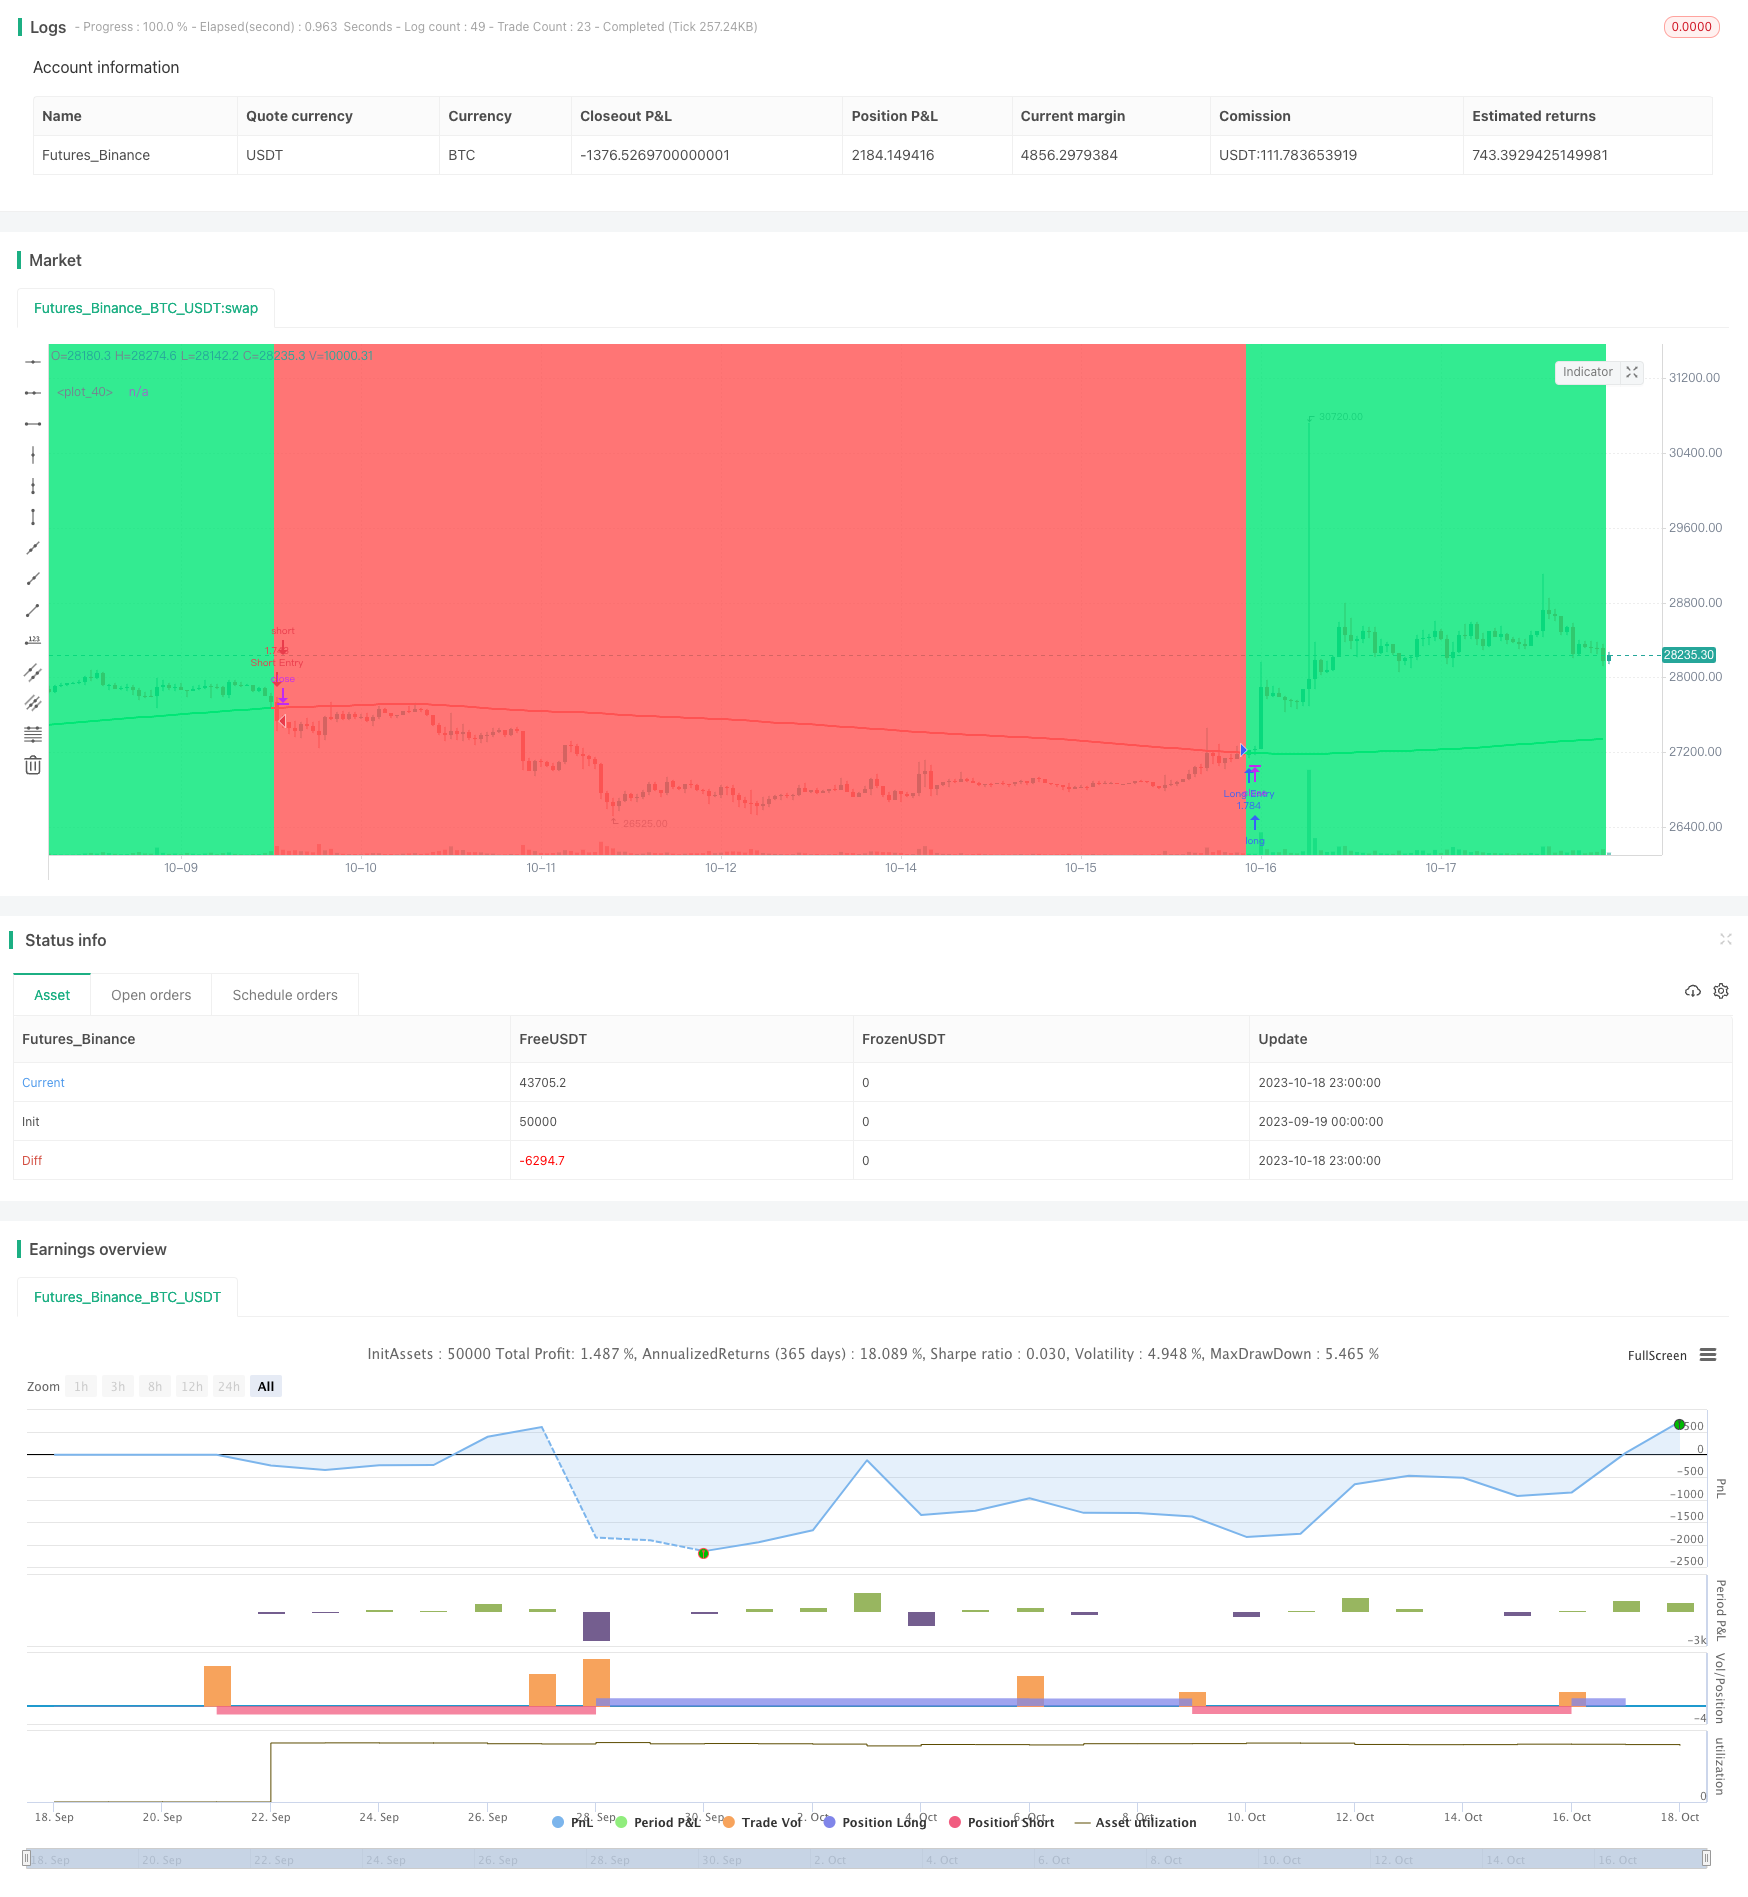
移動平均線追跡戦略

概要
移動平均追跡策略は,単純移動平均に基づいてトレンド追跡策略である.この策略は,200日間の長さのシンプル移動平均を使用して,価格のトレンド方向を判断し,価格が移動平均の上を通るときに多行し,価格が移動平均を下を通るときに空きをして,トレンドの追跡を実現する.
戦略原則
この戦略は以下の原則に基づいています.
- 200日間のシンプル・モビング・アベアンのスローMAを用いて,価格の傾向の方向を判断する.
- 市場が上昇し始めていると判断して,さらに多くを行う.
- 閉盤価格がスローMAを下回ったとき,市場が下落し始めたと考え,空白する.
- last_longとlast_shortの変数を使って,最後に多量と空間の時間を記録する.
- last_longとlast_shortの交差を判断するクロスオーバー関数を使用して取引信号を生成する.
- 回測時間帯で,多行信号を受信すると多行 (long_signal) され,空調信号を受信すると空調 (short_signal) される.
この戦略は主に移動平均によってトレンドの方向を判断し,均線が転じるときにタイムリーに反転操作を行い,トレンドを追跡して利益を得る.
優位分析
この戦略の利点は以下の通りです.
- 戦略はシンプルで明快で,理解し,実行しやすい.
- 長周期移動平均を用いて,ノイズを効率的にフィルターし,主要トレンドをロックできます.
- タイムリーな反転操作により,トレンドの転換点で大きな価格変動を捉えることができます.
- 移動平均の1つの指標だけで,複数の指標の組み合わせの複雑さを取り除く.
- 入り出入りのルールは明確で,人の介入は不要です.
リスク分析
この戦略にはいくつかのリスクがあります.
- 長期平均線は短期的な調整に無感で,短線のチャンスを逃す可能性があります.
- 大周期的なトレンドの頂底の識別能力は弱く,反転損失が起こりやすい.
- 被害のない仕組みは,より大きな撤退をもたらす可能性があります.
- パラメータは固定され,異なる品種と市場環境への適応力は弱である.
- 戦略テストは,過去のデータのみに基づいて行われると,過適合の危険性があります.
リスクに合わせて,以下のような面で最適化や改善を行うことができます.
- 短期平均線を組み合わせて,長期短期トレンドを考慮する.
- 偽の突破を避けるために,量と価格の組み合わせ条件を追加します.
- トレンド指標のフィルターを追加し,トレンド転換の識別能力を向上させる.
- ダイナミック・ストップ・メカニズムを導入し,単一損失を抑制する.
- パラメータ最適化方法を用いて,パラメータの適応性を向上させる.
- 戦略の安定性を確認するために,異なる市場環境で複製テストを行います.
最適化の方向
この戦略は,以下の点でさらに最適化できます.
移動平均の周期パラメータを最適化して,最適なパラメータの組み合わせを探します. ウォーク・フォワード・アナリストなどのパラメータ最適化方法を使用できます.
短期移動平均を追加し,多平均線戦略を形成し,長期の短期的なトレンドを追跡する.
MACDなどのトレンド指数と組み合わせることで,トレンド転換を識別する能力を向上させる.
ストップ・メカニズムの加入,例えば,ストップ・トラッキング,ストップ・リストの設置など,単一損失を制御する.
複製テストを行い,異なる品種と異なる時期で戦略をテストし,安定性を向上させる.
戦略のパラメータ自在化と戦略の最適化を実現するために,機械学習などの方法を使用します.
要約する
移動平均線追跡戦略は,シンプルで実用的なトレンド追跡戦略であり,アイデアは明確で,実行しやすい.トレンドの機会を捉えることができる.しかし,この戦略には,短期的な調整に無感性,リスク管理能力が弱いなどのいくつかの問題があります.我々は,多くの点で最適化して,戦略をより堅牢に,パラメータをより最適化して,リスク管理をより完善にすることができます.全体的に,移動平均線追跡戦略は,良い応用価値があり,量化取引の重要な戦略思考です.
/*backtest
start: 2023-09-19 00:00:00
end: 2023-10-19 00:00:00
period: 1h
basePeriod: 15m
exchanges: [{"eid":"Futures_Binance","currency":"BTC_USDT"}]
*/

//@version=4
strategy("MA X 200 BF", overlay=true, initial_capital=10000, default_qty_type=strategy.percent_of_equity, default_qty_value=100, commission_type=strategy.commission.percent, commission_value=0.0)

/////////////// Time Frame ///////////////
testStartYear = input(2012, "Backtest Start Year")
testStartMonth = input(1, "Backtest Start Month")
testStartDay = input(1, "Backtest Start Day")
testPeriodStart = timestamp(testStartYear,testStartMonth,testStartDay, 0, 0)

testStopYear = input(2019, "Backtest Stop Year")
testStopMonth = input(12, "Backtest Stop Month")
testStopDay = input(31, "Backtest Stop Day")
testPeriodStop = timestamp(testStopYear,testStopMonth,testStopDay, 0, 0)

testPeriod() => true

///////////// MA 200 /////////////
slowMA = sma(close, input(200))

/////////////// Strategy ///////////////
long = close > slowMA
short = close < slowMA

last_long = 0.0
last_short = 0.0
last_long := long ? time : nz(last_long[1])
last_short := short ? time : nz(last_short[1])

long_signal = crossover(last_long, last_short)
short_signal = crossover(last_short, last_long)

/////////////// Execution ///////////////
if testPeriod()
    strategy.entry("Long Entry",  strategy.long, when=long_signal)
    strategy.entry("Short Entry", strategy.short, when=short_signal)
    strategy.exit("Long Ex", "Long Entry")
    strategy.exit("Short Ex", "Short Entry")

/////////////// Plotting ///////////////
plot(slowMA, color = long ? color.lime : color.red, linewidth=2)
bgcolor(strategy.position_size > 0 ? color.lime : strategy.position_size < 0 ? color.red : color.white, transp=80)
bgcolor(long_signal ? color.lime : short_signal ? color.red : na, transp=30)