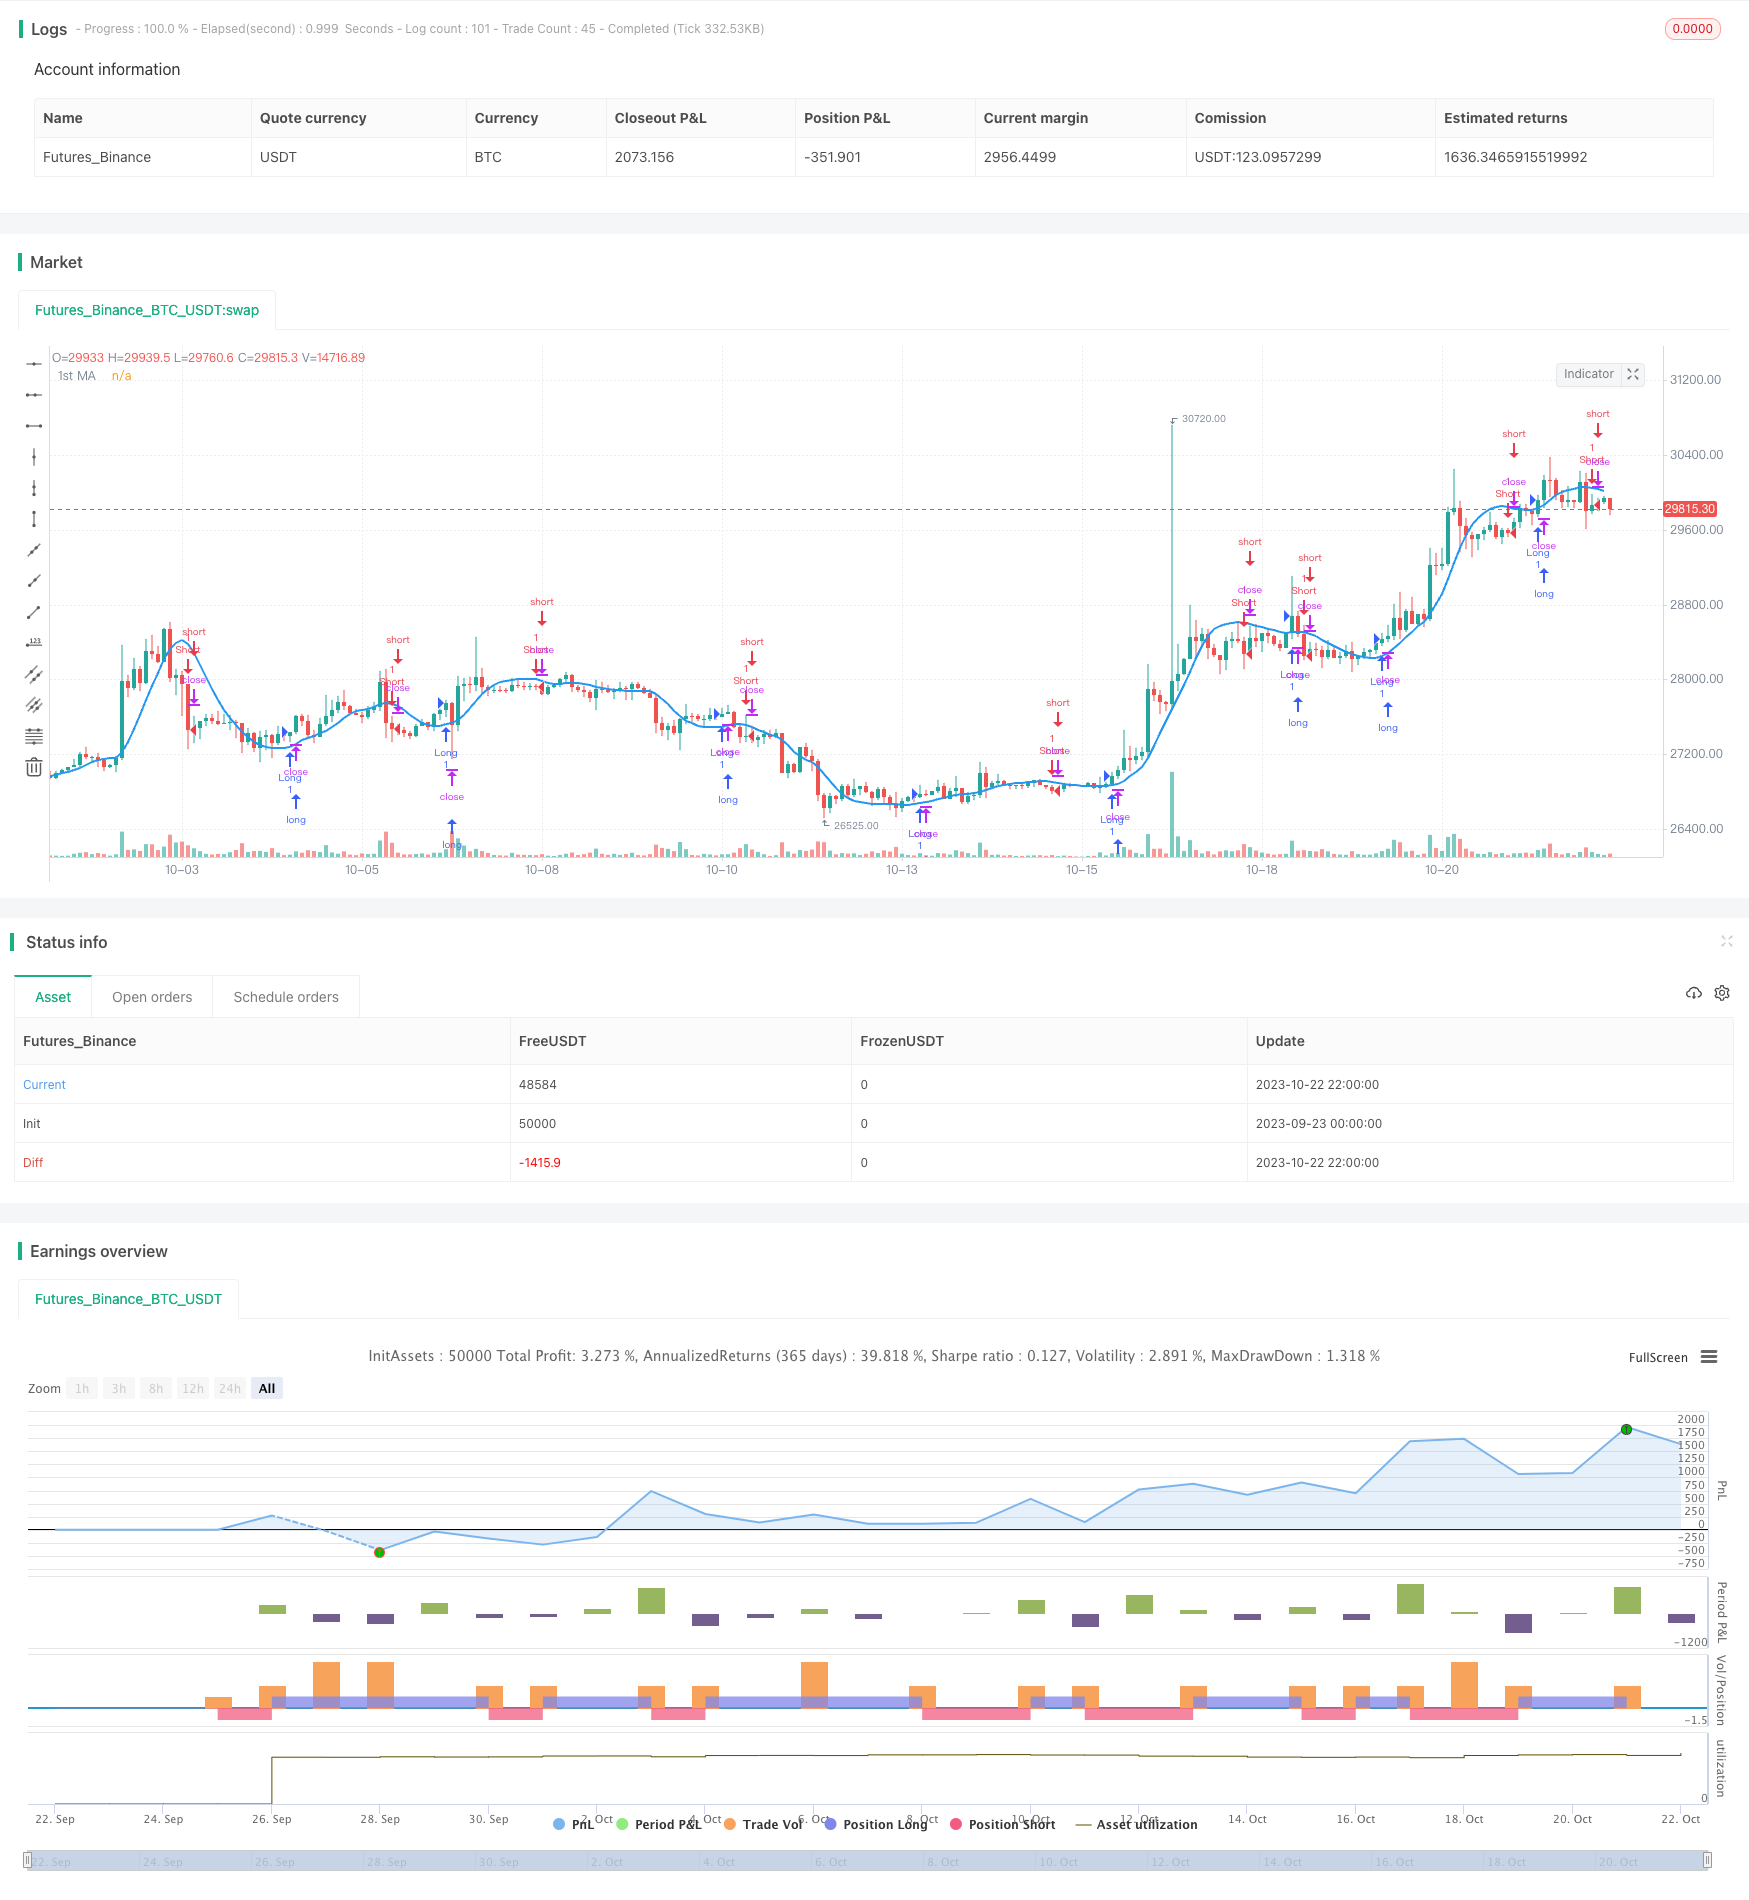
二重移動平均ターニングポイント取引戦略

概要
双均線転換点取引戦略は,均線交差に基づく取引戦略である.それは,2つの異なるパラメータの設定の移動平均を使用して,それらの転換状況に基づいて入場と出場のタイミングを判断する.この戦略は,シンプルで直感的で,容易に実装され,中長期線取引に適用される.
戦略原則
この戦略は,Priceを価格の入力源として使用し,それぞれ2つの異なるパラメータの平均線を計算する. SMA1とSMA2である. 戦略は,ROC指標を使用して平均線の転換を判断する. SMA1のROC値は,設定された正の値を超えると,SMA1が上向きに転向したと考え,SMA1の上向きの信号を記録する.
SMA1が上向きになり,上K線SMA2が下向きになると,買いの信号が作られ,多めにします.SMA1が下向きになり,上K線SMA2が上向きになると,売り出し信号が作られ,空っぽになります.
この戦略は,取引方向を決定するために2つの均線の転換を使用し,入場時刻を確認するために1つの均線の転換,入場時刻のトレンドの変化を確実にするために2つの均線の交差を有効にフィルターします.
優位分析
双均線交差と回転判断を使用すると,偽突破を効果的にフィルターし,入場の精度を向上させることができる.
均線転換はROC指標と組み合わせて,転換のタイミングを明確に判断し,頻繁に取引を避ける.
中長線双均線を使用すると,主要トレンドを追跡し,より大きなトレンドの利益を得ることができます.
戦略の論理はシンプルでわかりやすく,理解しやすい実装で,量化取引の初心者に適しています.
カスタマイズ可能なパラメータ,異なる市場環境に適応し,強い適応性を持っています.
リスク分析
双均線交差は,振動の状況で大量に偽信号を生成し,損失を招く可能性があります.
ROCパラメータは精密な最適化が必要で,そうでなければ識別への移行は誤りになり,戦略のパフォーマンスに影響する.
大周期的な震動は複数のストップを誘発する可能性があるため,ストップ幅を拡大することで回避できます.
平均的な指標だけで,重大ニュースなどの突発的な事件に反応することが困難で,損失を招く可能性があります.
パラメータ最適化過適合の問題には注意し,テスト周期は十分に長く,異なる状況を含むべきである.
最適化の方向
移動平均のパラメータを最適化して,最適な平均線周期の組み合わせを探します.
ROCパラメータを最適化して,回転認識の精度を向上させる
カスタム価格レベルを突破するダイナミック・ストップを適用できる ストップメカニズムを追加
取引量指標のトリガーなどの追加条件を追加し,偽ブレイクを避ける
MACD,BOLLなどの他の指標と組み合わせて,意思決定の効果を向上させる
機械学習などの方法を使用して,市場の変化に合わせてパラメータを自動的に最適化します.
要約する
双均線転換点戦略は,全体的に,シンプルで実用的なトレンド追跡戦略である.基本的均線指標だけで実現でき,論理が明確で分かりやすい.量化取引の初心者にとって学習と実践に適している.パラメータの最適化と止損機構の最適化によって,戦略の安定性を大幅に向上させることができる.他の補助指標と組み合わせて使用すると,戦略の効果をさらに高めることができる.この戦略は,高度にカスタマイズされ,異なる市場環境で柔軟に適用でき,推奨される双均線取引戦略である.
Overview
The Dual Moving Average Turning Point strategy is a trend following strategy based on moving average crossovers. It uses two moving averages with different parameter settings and determines entry and exit points according to their turning directions. This strategy is simple and intuitive, easy to implement, and suitable for medium-to-long term trading.
Strategy Logic
The strategy uses Price as the price input source and calculates two moving averages, SMA1 and SMA2, with different parameters. It uses the ROC indicator to determine the turning directions of the moving averages. When SMA1’s ROC value exceeds the positive threshold, it is considered an upward turn of SMA1 and an upward signal is recorded. When SMA1’s ROC value breaks the negative threshold, it is considered a downward turn of SMA1 and a downward signal is recorded. The judgment logic for SMA2 is similar.
When SMA1 turns upward and the previous bar’s SMA2 turns downward, a buy signal is generated to go long. When SMA1 turns downward and the previous bar’s SMA2 turns upward, a sell signal is generated to go short.
The strategy uses the turning directions of two moving averages to determine the trading direction and the turning of one moving average to confirm entry timing. The dual moving average crossover ensures the trend has changed when entering the market, which helps avoid false breakouts.
Advantage Analysis
Using dual moving average crossover and turning points can effectively filter out false breakouts and improve entry accuracy.
Combining moving average turning points with the ROC indicator can clearly identify turning points and avoid frequent trading.
Adopting medium-to-long-term dual moving averages can track the main trend and achieve sizable trend profits.
The strategy logic is simple and clear, easy to understand and implement, suitable for quant trading beginners.
Customizable parameters suit different market environments with strong adaptability.
Risk Analysis
Dual moving average crossovers may generate many false signals in ranging markets, leading to losses.
The ROC parameters need precise optimization, otherwise turn recognition will have errors, affecting strategy performance.
Large periodic ranging markets may trigger stop loss multiple times. Expanding stop loss range can avoid it.
Relying solely on moving averages, it’s hard to respond to sudden events like major news, which may lead to losses.
Note the overfitting problem in parameter optimization. Test period should be long enough to include different market conditions.
Optimization Directions
Optimize moving average parameters to find the best moving average period combination.
Optimize ROC parameters to improve turning point recognition accuracy.
Add stop loss mechanisms such as dynamic stop loss based on breaking customized price levels.
Add additional conditions like volume indicators to avoid false breakouts.
Incorporate other indicators like MACD, BOLL to improve decision making.
Use machine learning etc. to auto optimize parameters and adapt to market changes.
Summary
In summary, the Dual Moving Average Turning Point strategy is a simple and practical trend following strategy. It can be implemented with basic moving average indicators and has clear, easy-to-understand logic, making it very suitable for quant trading beginners to learn and practice. With parameter optimization and stop loss optimization, the strategy stability can be greatly improved. Combining with other auxiliary indicators can further enhance the strategy. The highly customizable strategy can be flexibly applied to different market environments and is a recommended dual moving average trading strategy.
[/trans]
/*backtest
start: 2023-09-23 00:00:00
end: 2023-10-23 00:00:00
period: 2h
basePeriod: 15m
exchanges: [{"eid":"Futures_Binance","currency":"BTC_USDT"}]
*/

//@version=3
strategy("MA Turning Point Strategy", overlay=true)
src = input(close, title="Source")

price = request.security(syminfo.tickerid, timeframe.period, src)
ma1 = input(25, title="1st MA Length")
type1 = input("HMA", "1st MA Type", options=["SMA", "EMA", "HMA", "VWMA"])
f_hma(_src, _length)=>
    _return = wma((2*wma(_src, _length/2))-wma(_src, _length), round(sqrt(_length)))

price1 = if (type1 == "SMA")
    sma(price, ma1)
else
    if (type1 == "EMA")
        ema(price, ma1)
    else
        if (type1 == "VWMA")
            vwma(price, ma1)
        else
            f_hma(price, ma1)

plot(series=price1, style=line,  title="1st MA", color=blue, linewidth=2, transp=0)

lookback1 = input(1, "Lookback 1")
roc1 = roc(price1, lookback1)

ma1up = false
ma1down = false
ma2up = false
ma2down = false

ma1up := nz(ma1up[1])
ma1down := nz(ma1down[1])
ma2up := nz(ma2up[1])
ma2down := nz(ma2down[1])

trendStrength1 = input(2.5, title="Minimum slope magnitude * 100", type=float) * 0.01

if crossover(roc1, trendStrength1)
    ma1up := true
    ma1down := false

if crossunder(roc1, -trendStrength1)
    ma1up := false
    ma1down := true

longCondition = ma1up and ma1down[1]
if (longCondition)
    strategy.entry("Long", strategy.long)

shortCondition = ma1down and ma1up[1]
if (shortCondition)
    strategy.entry("Short", strategy.short)