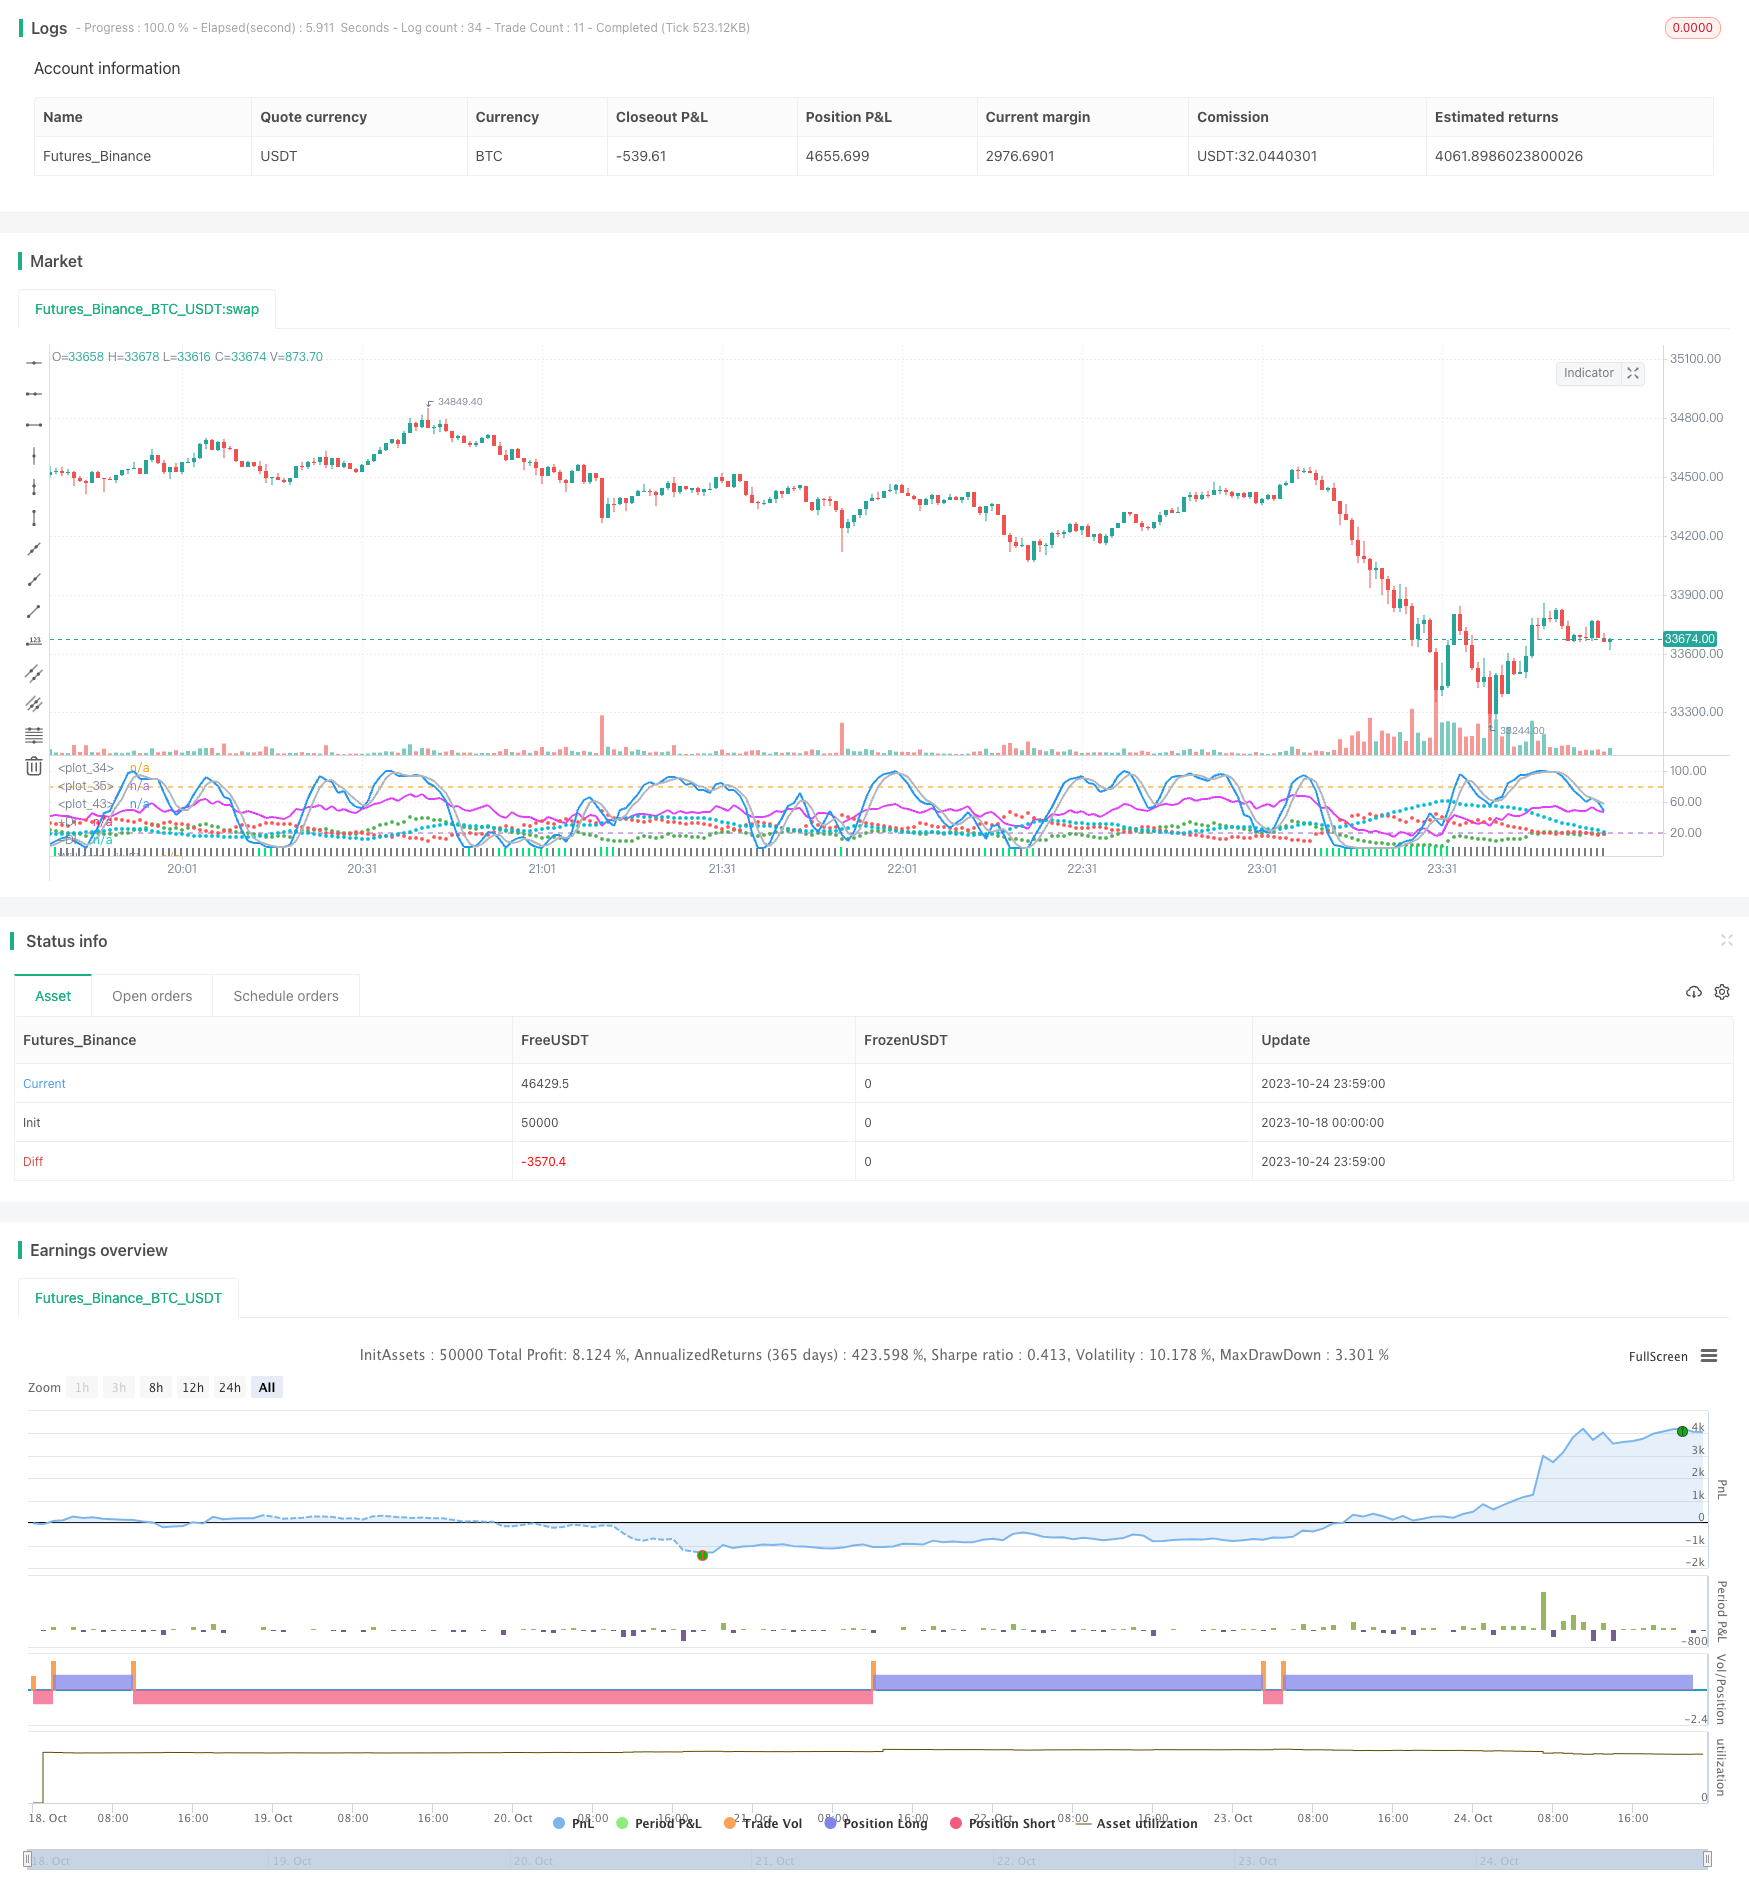
マルチファクター戦略の組み合わせ

これは,あなたが提供した取引戦略のコードを元に私が作成した詳細な戦略分析記事です.
概要
この戦略は,複数の要因の組み合わせで,異なる要因の優位性を活用して,総合的な取引戦略を構築することを目的としています.主に以下のいくつかの要因を組み合わせています.
- Stoch.RSI - ランダム指数平滑移動平均
- RSI - 比較的強い指数
- ダブル戦略 - ランダムな指標とRSIの二重戦略
- CM Williams Vix Fix - ウィリアムズの波動率を修正し,市場の底を探す
- DMI - トレンド指標
複数の要因を組み合わせることで,それぞれの要因の優位性を発揮し,より多くの取引機会を獲得し,単一の要因に依存するリスクを軽減できます.
戦略原則
この戦略は以下の技術指標を中心に実施しています.
Stoch.RSI- RSIとランダムな指数の優位性を組み合わせたランダムなRSI指標. RSI値をランダムな指数の入力として使用し,市場がオーバーバイまたはオーバーセール状態にあるかどうかを判断します. %Kラインがオーバーバイエリアの下から%Dラインを通るときは,オーバーバイします. %Kラインがオーバーセールエリアの上から%Dラインを通るときは,空きします.
RSI- 比較的強い指数で,市場の超買超売状態を判断する. RSIが70より大きい時は超買区,30より小さい時は超売区である. RSIは30-70の範囲で振動し,市場が横横整理状態にあることを代表する.
Double Strategy- ランダムな指数とRSIの二重戦略を組み合わせる. ランダムな指数%K線が超売区の下から%D線を横切って,RSIが超売区下から横切ると,多作; ランダムな指数%K線が超買区上から%D線を横切って,RSIが超買区上から横切ると,空作.
CM Williams Vix Fix- ウィリアムズ波動率修正指標は,近年の期間における価格波動率の百分位範囲を計算して,市場が逆転点にあるかどうかを判断する.
DMI- トレンド指数, +DIと-DIの差値を計算して市場のトレンド方向を判断する. ADX指数は,トレンドの強さを判断するために使用される.
これらの指標のそれぞれの優位性を総合的に利用し,市場動向や売り場を異なる視点から判断することで,戦略の安定性と成功率を向上させることができます.
戦略的優位性
- 複数の要素を組み合わせて,様々な要素を組み合わせて,より全面的に
- 取引のシグナルの種類は,トレンド,逆転などで,取引の機会が広がります.
- 過剰購入と過剰販売の領域を判断し,極端な状態の形成と逆転を早期に発見する.
- パラメータを最適化して設定し,異なる市場環境に対応する.
- トレンド指数でトレンドの強さを判断し,逆転取引を避ける.
リスク分析
- 複数の要素の組み合わせで,戦略の全体的な強性は検証される.
- 複数の指標が同質化されていて,組み合わせをさらに最適化できます.
- 複数の空間の信号が同時に発生する場合は,戦略の方向性や選択の原則を明確にする必要があります.
- パラメータ設定は厳格な反測最適化が必要で,任意のパラメータ変更には適さない.
- 長期的には効果が悪くなる可能性があり,適時退出が必要である.
最適化の方向
- ポートフォリオ内の指標をさらに選抜し,独自の要因を保持する.
- 各指標のパラメータ設定を最適化し,ターゲット市場に適したものにします.
- 明確な入場・出場ルールを確立する.
- リスク管理には ストップ・ロス・リトラクションなどがあります
- ポジションの持久期間によって 業績の影響をテストする.
要約する
この戦略は,複数の技術指標の優位性を利用し,Stoch.RSI,RSI,Double Strategy,CM Williams Vix Fix,DMIなどの要因によって取引信号を形成する.これは,より全面的で安定した判断基盤を提供し,戦略のパラメータの最適化もより複雑にする.さらにパラメータの最適化,ユニークな要因の選,明確な入場出場原則の確立などの方法によって,戦略の安定性とパフォーマンスを効果的に向上させることができる.しかし,全体的な強性と長期の持有能力は,厳格な検証によって証明される.この戦略は,多要因取引戦略の良い模範を提供し,学ぶ価値があります.
/*backtest
start: 2023-10-18 00:00:00
end: 2023-10-25 00:00:00
period: 1m
basePeriod: 1m
exchanges: [{"eid":"Futures_Binance","currency":"BTC_USDT"}]
*/


     //////////////////////////////////////////////////////////////////////
    ////  STOCHASTIC_RSI+RSI+DOUBLE_STRATEGY+CM_WILLIAMS_VIX_FIX+DMI  ////
   //////////////////////////////////////////////////////////////////////


//  This is a simple combination of integrated and published scripts, useful
//  if you don't have a PRO account and want to bypass the 3 indicator limit.
//  It includes:
//  1) Stoch.RSI
//  2) Relative strenght index
//  3) Stochastic + RSI, Double Strategy (by ChartArt)
//  4) CM_Williams_Vix_Fix Finds Market Bottoms (by ChrisMoody)
//  5) Directional Movement Index (DMI)
//  For more details about 3) and 4) check the original scripts.


//@version=3

strategy(title="Stoch.RSI+RSI+DoubleStrategy+CMWilliamsVixFix+DMI", shorttitle="Stoch.RSI+RSI+DoubleStrategy+CMWilliamsVixFix+DMI")


///STOCH.RSI///
smoothK = input(3, minval=1, title="Stochastic %K Smoothing")
smoothD = input(3, minval=1, title="Stochastic %K Moving Average")
lengthRSI = input(14, minval=1, title="RSI Lenght")
lengthStoch = input(14, minval=1, title="Stochastic Lenght")
RSIprice = close
rsi1 = rsi(RSIprice, lengthRSI)
k = sma(stoch(rsi1, rsi1, rsi1, lengthStoch), smoothK)
d = sma(k, smoothD)
plot(k, color=blue, linewidth=2)
plot(d, color=silver, linewidth=2)
h0 = hline(80)
h1 = hline(20)
fill(h0, h1, color=purple, transp=78)


///RSI///
up = rma(max(change(RSIprice), 0), lengthRSI)
down = rma(-min(change(RSIprice), 0), lengthRSI)
rsi2 = down == 0 ? 100 : up == 0 ? 0 : 100 - (100 / (1 + up / down))
plot(rsi2, color=fuchsia, linewidth=2)
// band0 = hline(70, linestyle=dotted)
// band1 = hline(30, linestyle=dotted)
// fill(band0, band1, color=purple, transp=100)


///OVERBOUGHT-OVERSOLD STRATEGY///
StochOverBought = input(80, title="Stochastic overbought condition")
StochOverSold = input(20, title="Stochastic oversold condition")
ks = sma(stoch(close, high, low, lengthStoch), smoothK)
ds = sma(k, smoothD)
RSIOverBought = input( 70  , title="RSI overbought condition")
RSIOverSold = input( 30  , title="RSI oversold condition")
vrsi = rsi(RSIprice, lengthRSI)
if (not na(ks) and not na(ds))
    if (crossover(ks,ds) and k < StochOverSold)
        if (not na(vrsi)) and (crossover(vrsi, RSIOverSold))
            strategy.entry("LONG", strategy.long, comment="LONG")
if (crossunder(ks,ds) and ks > StochOverBought)
    if (crossunder(vrsi, RSIOverBought))
        strategy.entry("SHORT", strategy.short, comment="SHORT")


///CM WILLIAMS VIX FIX///
pd = input(22, title="LookBack Period Standard Deviation High")
bbl = input(20, title="Bollinger Band Length")
mult = input(2.0    , minval=1, maxval=5, title="Bollinger Band Standard Devaition Up")
lb = input(50  , title="Look Back Period Percentile High")
ph = input(.85, title="Highest Percentile - 0.90=90%, 0.95=95%, 0.99=99%")
pl = input(1.01, title="Lowest Percentile - 1.10=90%, 1.05=95%, 1.01=99%")
hp = input(false, title="Show High Range (Based on Percentile and LookBack Period)?")
sd = input(false, title="Show Standard Deviation Line?")
wvf = ((highest(close, pd)-low)/(highest(close, pd)))*100
sDev = mult * stdev(wvf, bbl)
midLine = sma(wvf, bbl)
lowerBand = midLine - sDev
upperBand = midLine + sDev
rangeHigh = (highest(wvf, lb)) * ph
rangeLow = (lowest(wvf, lb)) * pl
col = wvf >= upperBand or wvf >= rangeHigh ? lime : gray
plot(hp and rangeHigh ? rangeHigh : na, title="Range High Percentile", style=line, linewidth=4, color=orange)
plot(hp and rangeLow ? rangeLow : na, title="Range High Percentile", style=line, linewidth=4, color=orange)
plot(wvf, title="Williams Vix Fix", style=columns, linewidth = 4, color=col, transp=85)
plot(sd and upperBand ? upperBand : na, title="Upper Band", style=line, linewidth = 3, color=aqua)


///DIRECTIONAL MOVEMENT INDEX///
len3 = input(14, minval=1, title="DI Length")
lensig3 = input(14, title="ADX Smoothing", minval=1, maxval=50)
up3 = change(high)
down3 = -change(low)
plusDM3 = na(up3) ? na : (up3 > down3 and up3 > 0 ? up3 : 0)
minusDM3 = na(down3) ? na : (down3 > up3 and down3 > 0 ? down3 : 0)
trur3 = rma(tr, len3)
plus3 = fixnan(100 * rma(plusDM3, len3) / trur3)
minus3 = fixnan(100 * rma(minusDM3, len3) / trur3)
sum3 = plus3 + minus3
adx3 = 100 * rma(abs(plus3 - minus3) / (sum3 == 0 ? 1 : sum3), lensig3)
plot(plus3, color=green, style=circles, linewidth=2, title="+DI")
plot(minus3, color=red, style=circles, linewidth=2, title="-DI")
plot(adx3, color=aqua, style=circles, linewidth=3, title="ADX")