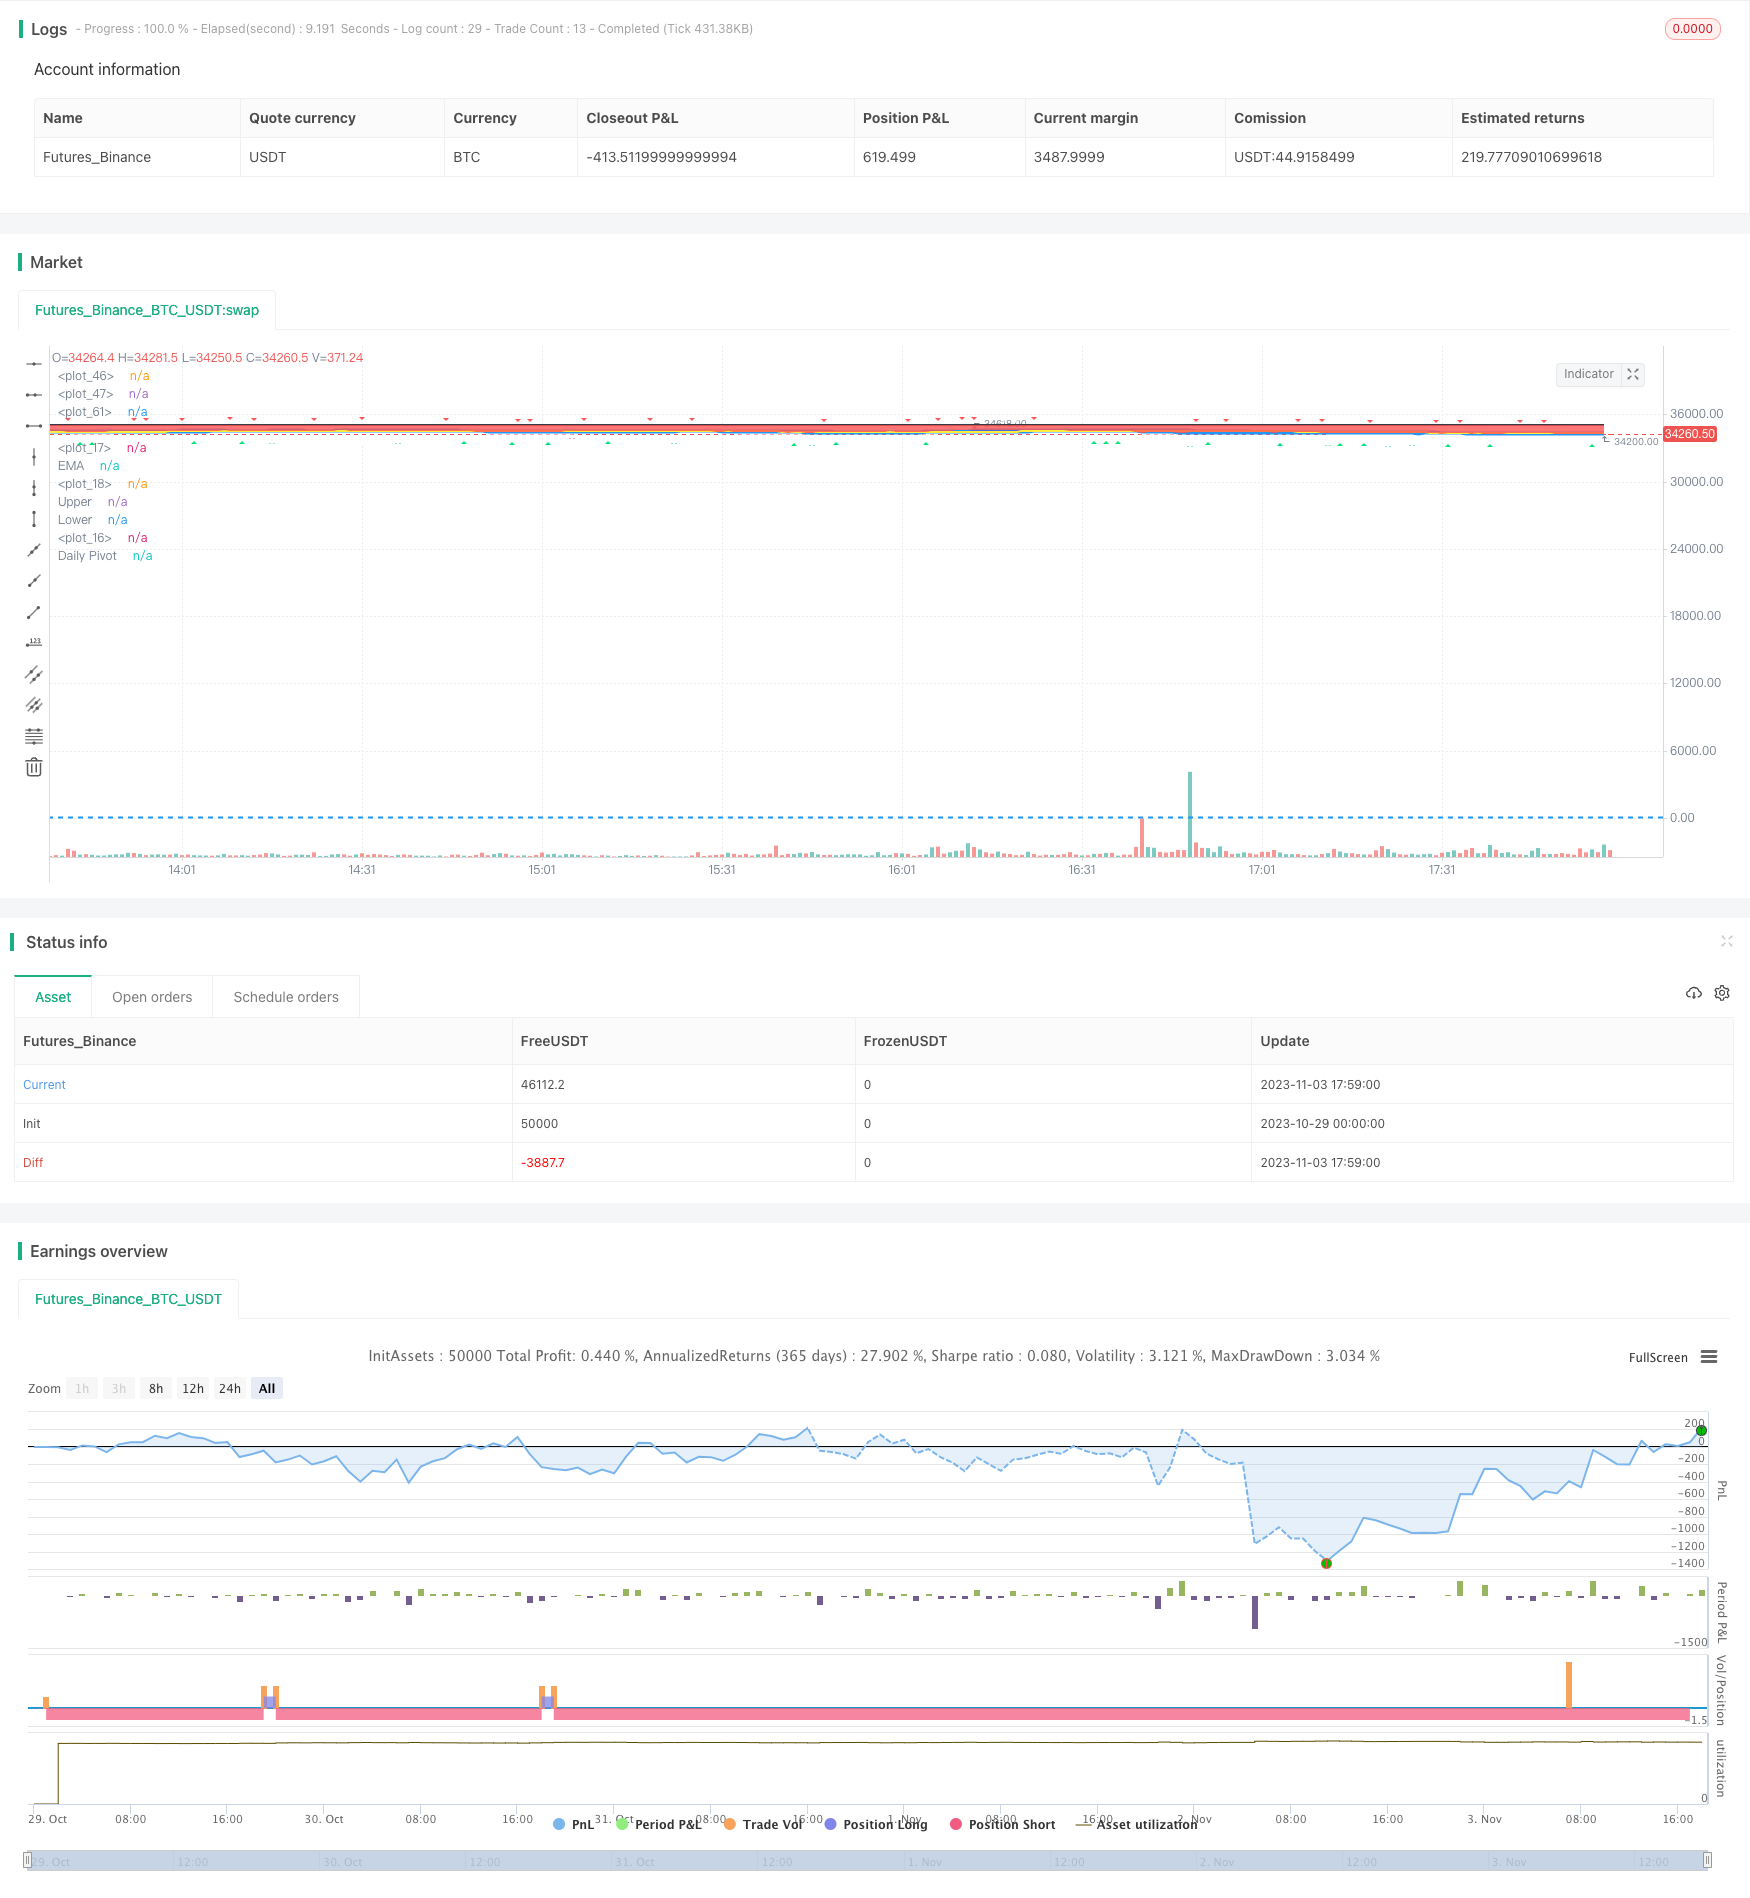
価格ブレイクアウト ボリンジャーバンド戦略

概要
この戦略は,ブリンライン指数を使用して価格の波動幅を判断し,K線形状と組み合わせて価格の突破操作を行う.ブリンラインの上下軌は,価格の上昇と下降の傾向を概して判断し,K線形状の指数と組み合わせて,より明らかな買入時を見つけることができる.この戦略は,ブリンラインの下軌の突破を判断し,上軌の突破を空にする.同時に,Stoch指数と組み合わせて,超買超売状態を判断し,K線形状を利用して,オプションの買入シグナルを提供する.
戦略原則
この戦略は以下の指標で構成されています.
ブリンライン指標は,ブリンライン中線,上線,下線を含む. ブリンラインは,価格の標準差によって価格の変動範囲を計算し,それによって価格の変動傾向を判断する.
ストック指数,株式が超買い超売状態にあるかどうかを判断する.K線とD線は,上方突破と下方突破かどうかを判断する.
K線形,大陽線,大陰線などの形を判断する.
購入条件:価格が上をブリン線下線に突破し,ストック指標が超売りを示した ((K<20,D<20),急速移動平均線がゆっくり移動平均線を上破した。
販売条件: 価格を下げてブリンライン上線するか,利益後に止損する.
この戦略は,トレンド分析と超買超売判断を組み合わせ,ecausefalseの勝率を下げ,トレンドが現れた時に間に合うように市場に入ることができる.しかし,被套のリスクも存在し,適時な止損が必要である.
優位分析
ブリンラインとストック指数と組み合わせると,株価が明らかに低点に達したときに購入することができ,リスクが軽減されます.
K線形は,震災時の誤った購入を避けるための補助条件である.
戦略の安定性や信頼性を高めるため,二重条件の判断が用いられている.
損失を抑えるメカニズムは,大きな損失を防ぐことができます.
リスク分析
ブリンライン取引では,騙されやすい.市場が断層化すると,大きな損失を引き起こす可能性があります.
ストッチ指標は偽信号を発する確率が高い.ストッチ単独で使用すると,損失のリスクが高い.
金融危機が起きたとき,誤った取引シグナルが生じやすい.
リスクの管理に適したタイミングで 損失を止めてください
突破の強さに注目し,反発を防ぐ必要があります.
最適化の方向
株のプールを最適化して,波動が大きい,傾向が明らかな株を選びます.
ブリンラインパラメータの最適化,中軌道周期の調整,買賣点把握の最適化.
ストックパラメータを最適化し,K線とD線周期を調整し,指標の信頼性を向上させる.
取引量を増やす条件を判断し,急落を避ける.
損失のリスクをコントロールするために,追跡ストップ,移動ストップなどのストップ戦略を増やす.
戦略の安定性を高めるために,MACD,KDJなどの他の技術指標を追加する評価.
ポジションの持久期間をテストし,利回り率を最適化する.
要約する
この戦略は,ブリンライン,ストック指数と基本的技術指標を統合し,リスクを制御した前提で,株価の低点で買い,歴史的な高点の近くで売り,比較的安定した利益モデルを実現する.しかし,隠蔽,止損効果などのリスクも存在します.パラメータを最適化するとともに,他の判断指標を追加することで,戦略の安定性と継続的な収益性をさらに高めることができます.この戦略は,株価が超買い超売り区域の振動時に取引する戦略投資家を判断するのに適しています.
/*backtest
start: 2023-10-29 00:00:00
end: 2023-11-03 18:00:00
period: 1m
basePeriod: 1m
exchanges: [{"eid":"Futures_Binance","currency":"BTC_USDT"}]
*/

//@version=3
strategy("Bollinger e Tendência", overlay=true)

//MÉDIAS
periodolenta = 14
periodosimples = 47
periodome = 7

psimples = input(title="Período da média simples", defval=periodosimples)
pexp = input(title="Período da média exponencial", defval=periodome)
pexplenta = input(title="Período da média exp lenta", defval=periodolenta)
msimples = sma(close, psimples)
mexp = ema(close, pexp)
mexplenta = ema(close, pexplenta)

plot(msimples, linewidth=2, color=yellow)
plot(mexp, linewidth=5, color=white)
plot(mexplenta, linewidth=2, color=orange)

//BOLLANGER
length = input(21, minval=2)
src = input(close, title="Source")
mult = input(1.5, minval=0.001, maxval=50)
basis = sma(src, length)
dev = mult * stdev(src, length)
upperBol = basis + dev
lowerBol = basis - dev

p1 = plot(upperBol, title="Upper", color=blue, linewidth=3)
p2 = plot(lowerBol, title="Lower", color=blue, linewidth=3)
fill(p1, p2, color = purple, transp=90)

//BBW (altura do Bollanger)
basis2 = sma(close, 21)
bbw = (upperBol-lowerBol)/basis2


//STOCH E FORÇA
source = close
lengthRSI = input(11, minval=2), lengthStoch = input(7, minval=2)
smoothK = input(3,minval=3), smoothD = input(4,minval=3)
OverSold = input(20), OverBought = input(80)
rsi1 = rsi(source, lengthRSI)
k = sma(stoch(rsi1, rsi1, rsi1, lengthStoch), smoothK)
d = sma(k, smoothD)
hline(OverSold,color=blue)
hline(OverBought,color=blue)


// Cor das Tendências (Verde ou Vermelho)
// Baseado no código: "Pivot Daily Price Color" (by Rimko)
pivot = (high + low + close ) / 3.0
dtime_pivot = request.security(syminfo.tickerid, 'D', pivot[1])
pv = dtime_pivot ? dtime_pivot : na
pe = ema(close,periodome)
col = sma(close,1)>pv?green:red
col2 = sma(close,1)>pe?green:red
offs_daily = 0
pp=plot(pv, title="Daily Pivot",style=linebr, color=black,linewidth=2)
p=plot(sma(close,1), transp=100, editable=false)
pema = plot(pe, title="EMA",style=line, color=black,linewidth=2, transp = 50)
fill(p,pema,color=col2,title="EMA to price color", transp = 50)
fill(pp,p,color=col, title="Privot to price color", transp = 90)


//*************************************************************************************************************************************************
// Candles (identificação):
// Baseado no código: "Candlesticks Pattern Identified" (by Repo32)
trend= input(5, minval=1, title="Trend in Bars")

DojiSize = input(0.05, minval=0.01, title="Doji size")
data=(abs(open - close) <= (high - low) * DojiSize)
//plotchar(data, title="Doji", color=white)
plotshape(data, title="Doji", color=white, style=shape.cross)
 //text='Doji'

data6=(close[1] > open[1] and open > close and open <= close[1] and open[1] <= close and open - close < close[1] - open[1] and open[trend] < open)
plotshape(data6, title= "Bearish Harami", color=red, style=shape.triangledown)
//, text="Harami\nde Baixa"

data8=(close[1] > open[1] and open > close and open >= close[1] and open[1] >= close and open - close > close[1] - open[1] and open[trend] < open)
plotshape(data8,  title= "Bearish Engulfing", color=red, style=shape.triangledown)
//, text="Engolfo\nde Baixa"

data13=(open[1]<close[1] and open<=open[1] and close<=open and open[trend] < open)
plotshape(data13, title= "Bearish Kicker", color=red, style=shape.triangledown)
//, text="Kicker\nde Baixa"

data14=(((high-low>4*(open-close))and((close-low)/(.001+high-low)>=0.75)and((open-low)/(.001+high-low)>=0.75))and open[trend] < open and high[1] < open and high[2] < open)
plotshape(data14,  title= "Hanging Man", location=location.belowbar, color=red, style=shape.triangledown)
//, text="Enforcado"

data7=(open[1] > close[1] and close > open and close <= open[1] and close[1] <= open and close - open < open[1] - close[1] and open[trend] > open)
plotshape(data7,  title= "Bullish Harami", location=location.belowbar, color=lime, style=shape.triangleup)
//, text="Mulher\nGrávida"

data9=(open[1] > close[1] and close > open and close >= open[1] and close[1] >= open and close - open > open[1] - close[1] and open[trend] > open)
plotshape(data9, title= "Bullish Engulfing", location=location.belowbar, color=lime, style=shape.triangleup)
//, text="Engolfo\nde Alta"

//uppercandle = highest(10)[1]
data10=(close[1] < open[1] and  open < low[1] and close > close[1] + ((open[1] - close[1])/2) and close < open[1] and open[trend] > open)
plotshape(data10, title= "Piercing Line", location=location.belowbar, color=lime, style=shape.triangleup)
//, text="Piercing"

lowercandle = lowest(10)[1]
data11=(low == open and  open < lowercandle and open < close and close > ((high[1] - low[1]) / 2) + low[1] and open[trend] > open)
plotshape(data11, title= "Bullish Belt", location=location.belowbar, color=lime, style=shape.triangleup)
//, text="Contenção\nde Alta"

data12=(open[1]>close[1] and open>=open[1] and close>open and open[trend] > open)
plotshape(data12, title= "Bullish Kicker", location=location.belowbar, color=lime, style=shape.triangleup)//, text="Kicker\nde Alta"


data5=(((high - low)>3*(open -close)) and  ((close - low)/(.001 + high - low) > 0.6) and ((open - low)/(.001 + high - low) > 0.6))
plotshape(data5, title= "Hammer", location=location.belowbar, color=white, style=shape.diamond)

data5b=(((high - low)>3*(open -close)) and  ((high - close)/(.001 + high - low) > 0.6) and ((high - open)/(.001 + high - low) > 0.6))
plotshape(data5b, title= "Inverted Hammer", location=location.belowbar, color=white, style=shape.diamond)
//, text="Martelo\nInvertido"

data2=(close[2] > open[2] and min(open[1], close[1]) > close[2] and open < min(open[1], close[1]) and close < open )
//plotshape(data2, title= "Evening Star", location=location.belowbar, color=red, style=shape.arrowdown, text="Estrela\nda Tarde")
plotchar(data2, title="Evening Star", color=white)

data3=(close[2] < open[2] and max(open[1], close[1]) < close[2] and open > max(open[1], close[1]) and close > open )
//plotshape(data3,  title= "Morning Star", location=location.belowbar, color=lime, style=shape.arrowup, text="Estrela\nda Manhã")
plotchar(data3, title="Morning Star", color=white, location=location.belowbar)

data4=(open[1] < close[1] and open > close[1] and high - max(open, close) >= abs(open - close) * 3 and min(close, open) - low <= abs(open - close))
//plotshape(data4, title= "Shooting Star", color=red, style=shape.arrowdown, text="Estrela\nCadente")
plotchar(data4, title="Shooting Star", color=white)


//**********************************************************************************************************


// Ações:

momento = strategy.position_size[0] > strategy.position_size[1]
valorcompra = valuewhen(momento, open, 0)
valorbbw = input(title="Altura Máxima do Bollinger", defval=10)

alerta = crossunder(close, lowerBol)
alertcondition(alerta, title='Abaixo da Banda Baixa', message='Fechou abaixo da banda baixa...!')

//data7 data9 data10 data11 data12

compra =  crossover(close, lowerBol) and ((k<=20) and (d<=20)) and (mexp>mexp[1])
//compra = (data7 or data9 or data10 or data11 or data12) and (msimples>msimples[1]) and ((k<=20) and (d<=20)) and (bbw<valorbbw/1000)
//compra =  (open<close) and (crossover (close, lowerBol)) and ((k<=20) and (d<=20)) and (bbw<valorbbw/1000) and (msimples>msimples[1])

venda = crossover(close, upperBol)
//(close >= (valorcompra + (valorcompra * 0.025)))

strategy.entry ("Compra", strategy.long, when=compra)
strategy.entry ("Venda", strategy.short, when=venda)


//plotshape(series=compra, title="Compra", style=shape.triangleup, location=location.belowbar, color=green, text="COMPRA", size=size.small)
//plotshape(series=venda, title="Venda", style=shape.triangledown, location=location.abovebar, color=red, text="VENDA", size=size.small)