3EMAとストカスティックRSI戦略
作者: リン・ハーンチャオチャン開催日:2023年11月15日 10:47:20タグ:

概要
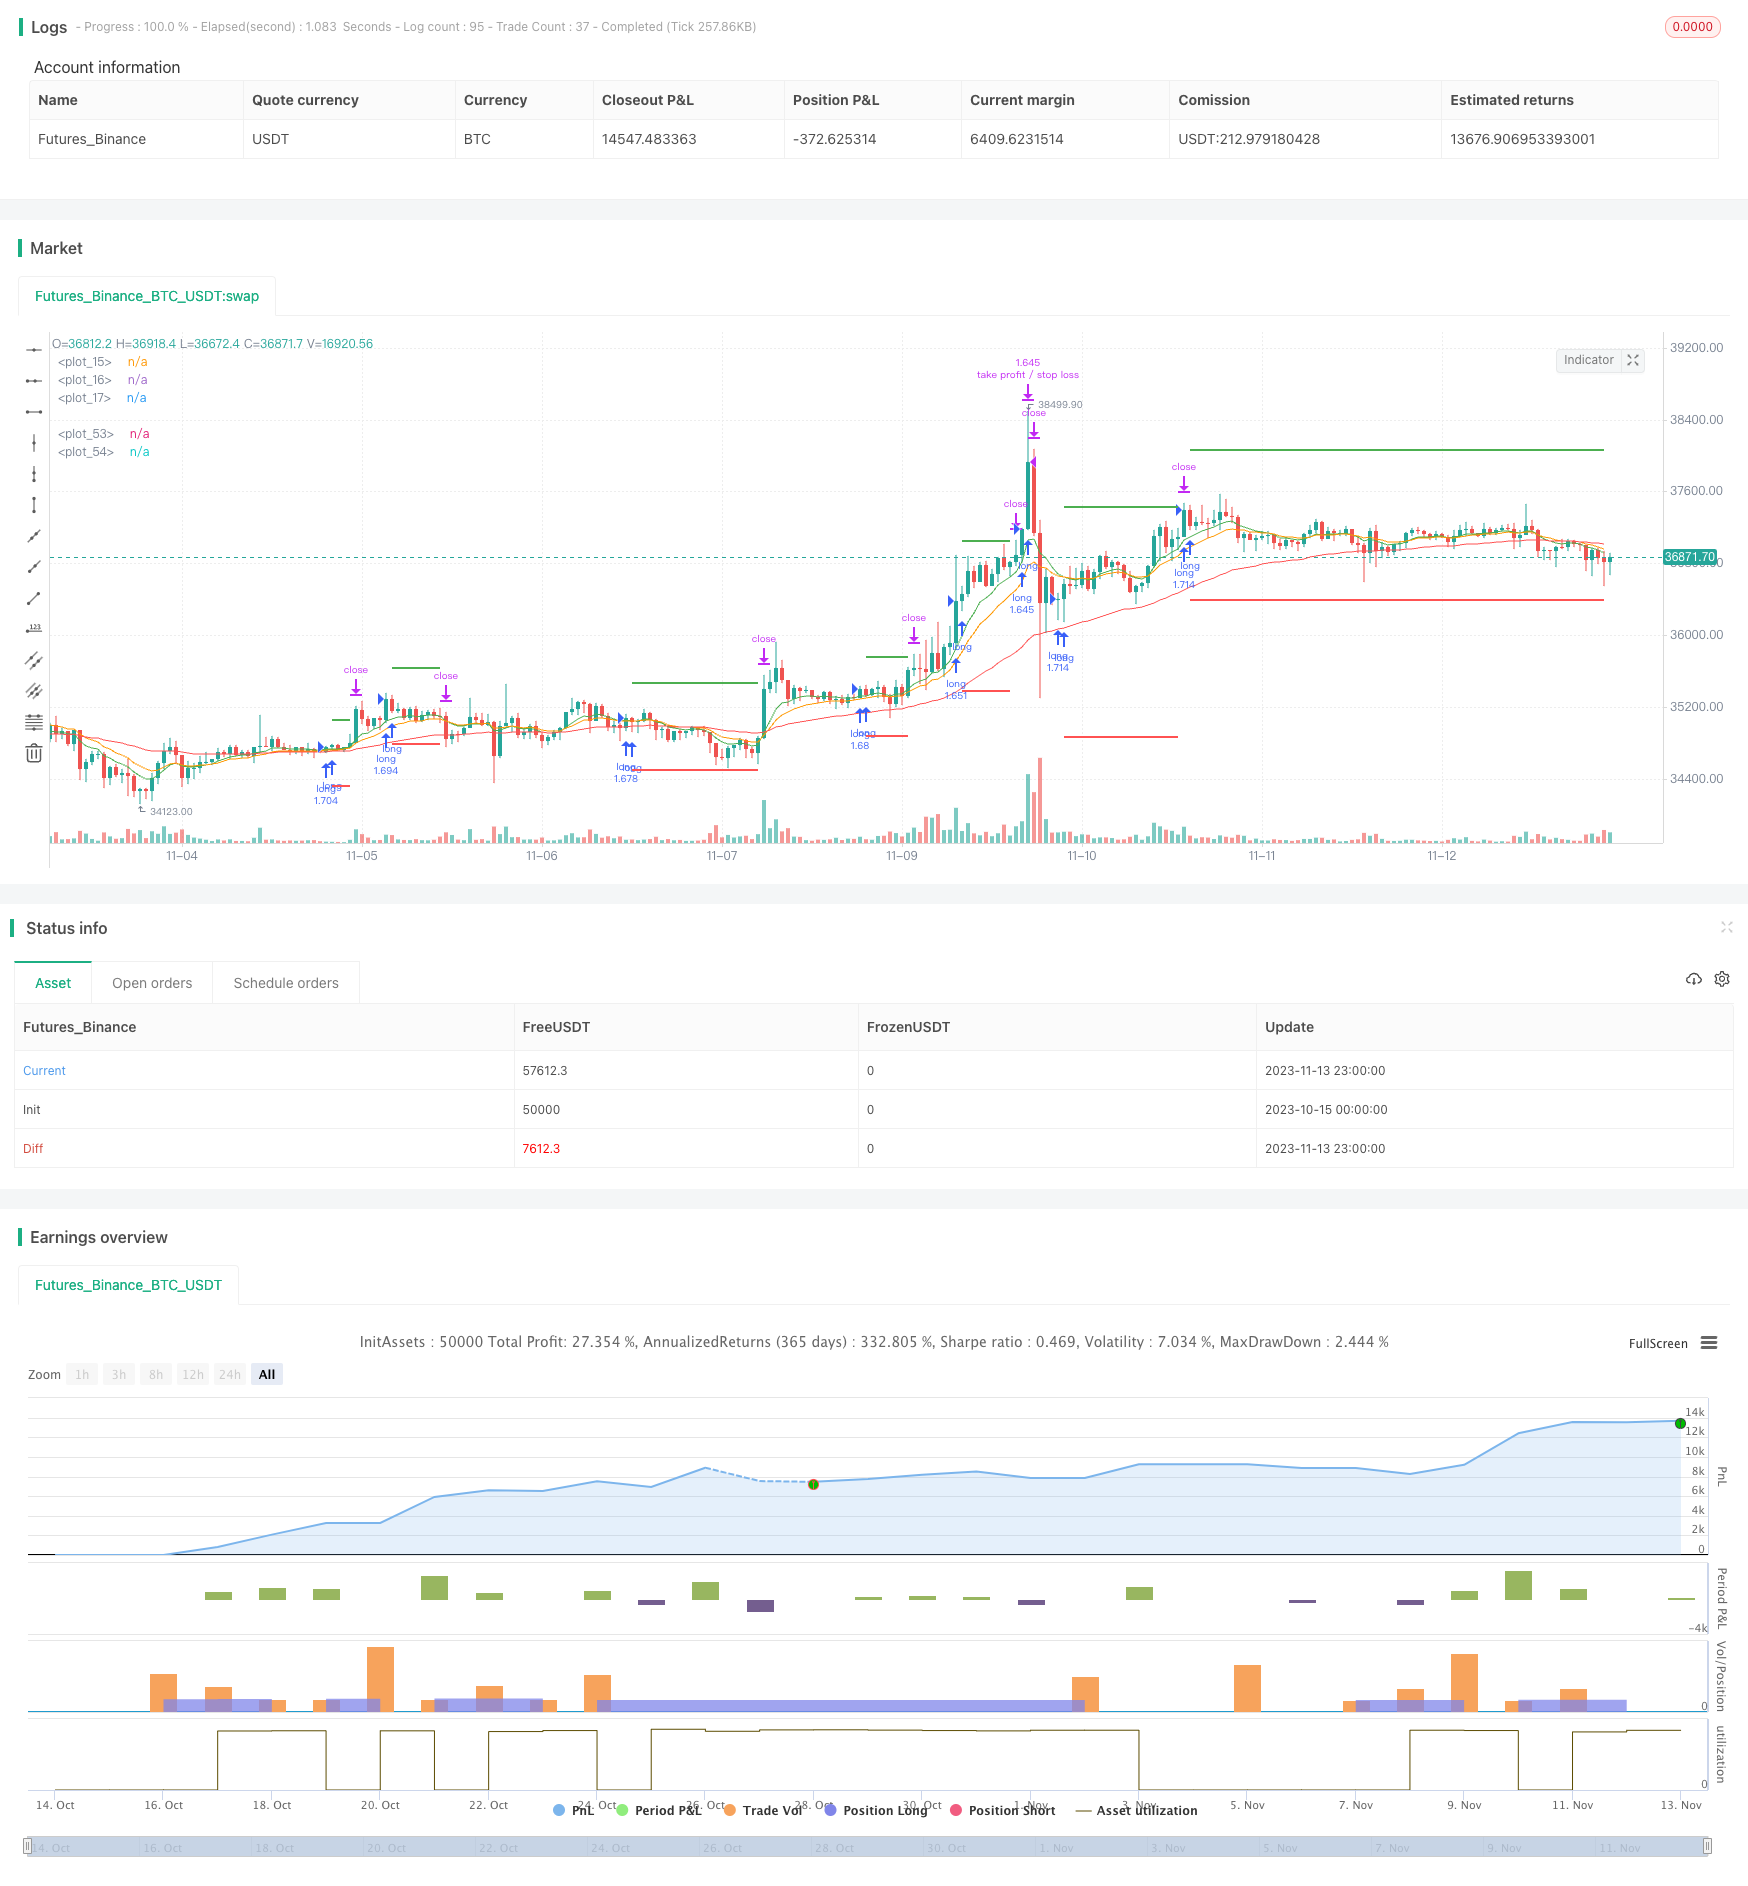
このトレンドフォロー戦略は,複数の指標を組み合わせたトレンドフォロー戦略である.トレンド方向を特定しポジションを確立するために,異なる期間の3つのEMA,ストカスティックRSIおよびATRを使用する.高速なEMAが遅いEMAを超えると,ストップ・ロスは最近のATR値の3倍に設定され,最近のATRの2倍で利益を得ます.
原則
この戦略は,異なる時間枠における価格動向を表す8期,14期,50期EMAという3つのEMA線を使用する.8期EMAが14期EMAを超越し,14期EMAが50期EMAを超越すると,上昇傾向の開始をシグナル化し,ロングポジションを開始することができる.
ストキャスティックRSIインジケーターは,過剰購入/過剰販売の条件を特定するために,RSIとストキャスティック計算を組み込む.ストキャスティックRSIK線が下からD線を超えると,市場は過剰販売から上昇見通しに移行していることを示唆し,ロングポジションを可能にします.
ATRは最近の変動範囲を表します.この戦略は,利益をロックしリスクを制御するために,ストップ損失距離として3倍ATRと利益距離として2倍ATRを使用します.
利点
- EMA は 価格 データ の 騒音 を フィルタリング し て 傾向 の 方向 を 特定 する
- ストカスティックRSIは逆転の機会を特定する
- ATRは,市場の変動に基づいて,ストップ・ロスト/テイク・プロフィートを動的に追跡する.
リスク
- 複数の指標が矛盾する信号を生む可能性があります.
- 固定ストップ・ロース/テイク・プロフィート比は 変化する市場状況に適応できない
- 逆転に敏感な短期ロング
優化には,センシビリティを最適化するためにEMA期間を調整することによって行うことができる.ATR比率を調整可能にすることで,市場の状況に基づいてカスタマイズすることができます.他の指標を追加することで,シグナルを検証し,間違いを避けるのに役立ちます.
強化
- センシビリティを最適化するために EMA 期間を調整する
- ATR比を調整可能にする
- 誤った信号を避けるために他の指標を追加
結論
この戦略は,エントリータイミングを特定するためにトレンド,過剰購入/過剰販売レベル,および波動性範囲を考慮する. EMAsとストーカスティックRSIは,トレンドを効果的に識別し,ATR
/*backtest
start: 2023-10-15 00:00:00
end: 2023-11-14 00:00:00
period: 1h
basePeriod: 15m
exchanges: [{"eid":"Futures_Binance","currency":"BTC_USDT"}]
*/

// This source code is subject to the terms of the Mozilla Public License 2.0 at https://mozilla.org/MPL/2.0/
// © FreddieChopin

//@version=4
strategy("3 x EMA + Stochastic RSI + ATR", overlay = true, default_qty_type = strategy.percent_of_equity, default_qty_value = 100)

// 3x EMA
ema1Length = input(8, "EMA1 Length", minval = 1)
ema2Length = input(14, "EMA2 Length", minval = 1)
ema3Length = input(50, "EMA3 Length", minval = 1)
ema1 = ema(close, ema1Length)
ema2 = ema(close, ema2Length)
ema3 = ema(close, ema3Length)

plot(ema1, color = color.green)
plot(ema2, color = color.orange)
plot(ema3, color = color.red)

// Stochastic RSI
smoothK = input(3, "K", minval=1)
smoothD = input(3, "D", minval=1)
lengthRSI = input(14, "RSI Length", minval=1)
lengthStoch = input(14, "Stochastic Length", minval=1)
src = input(close, title="RSI Source")
rsi1 = rsi(src, lengthRSI)
k = sma(stoch(rsi1, rsi1, rsi1, lengthStoch), smoothK)
d = sma(k, smoothD)

// ATR
atrPeriod = input(14, "ATR Period")
takeProfitMultiplier= input(2.0, "Take-profit Multiplier")
stopLossMultiplier= input(3.0, "Stop-loss Multiplier")
atrSeries = atr(atrPeriod)[1]

longCondition = ema1 > ema2 and ema2 > ema3 and crossover(k, d)
strategy.entry("long", strategy.long, when = longCondition)

float stopLoss = na
float takeProfit = na

if (strategy.position_size > 0)
    if (na(stopLoss[1]))
        stopLoss := strategy.position_avg_price - atrSeries * stopLossMultiplier
    else
        stopLoss := stopLoss[1]
    if (na(takeProfit[1]))
        takeProfit := strategy.position_avg_price + atrSeries * takeProfitMultiplier
    else
        takeProfit := takeProfit[1]

    strategy.exit("take profit / stop loss", limit = takeProfit, stop = stopLoss)

plot(stopLoss, color = color.red, linewidth = 2, style = plot.style_linebr)
plot(takeProfit, color = color.green, linewidth = 2, style = plot.style_linebr)
- % 変化バーチャート バックテスト戦略
- モメント・リバーサル・トレーディング・戦略
- 多指標ボリンジャーバンド取引戦略
- 基本的Pinbar取引戦略
- トレンドフォロー戦略 MACD と ドンチアンチャネル
- トレンドフォロー戦略 ストップ損失を追う距離に基づいた戦略
- ICHIMOKU クラウドとSTOCH 指標に基づくトレンド追跡戦略
- モメントブレイク戦略
- 優位性 移動平均 ブレイクトレンド フォローシステム
- トリプル指数関数移動平均 ロングのみ戦略
- 戦略をフォローする二重移動平均傾向
- RSI逆転取引戦略
- 期間制限付きの二重MA戦略
- トレンドフォロー戦略 移動平均と超トレンドに基づいた
- 簡単な移動平均のクロスオーバー戦略
- 二重取利益移動平均クロスオーバー量的な戦略
- RSI オシレーター カメ トレーディング 短期戦略
- マッキンリー移動平均取引戦略
- 改善された渦輪指標に基づく定量的な取引戦略
- 多期トレンド追跡戦略