概述
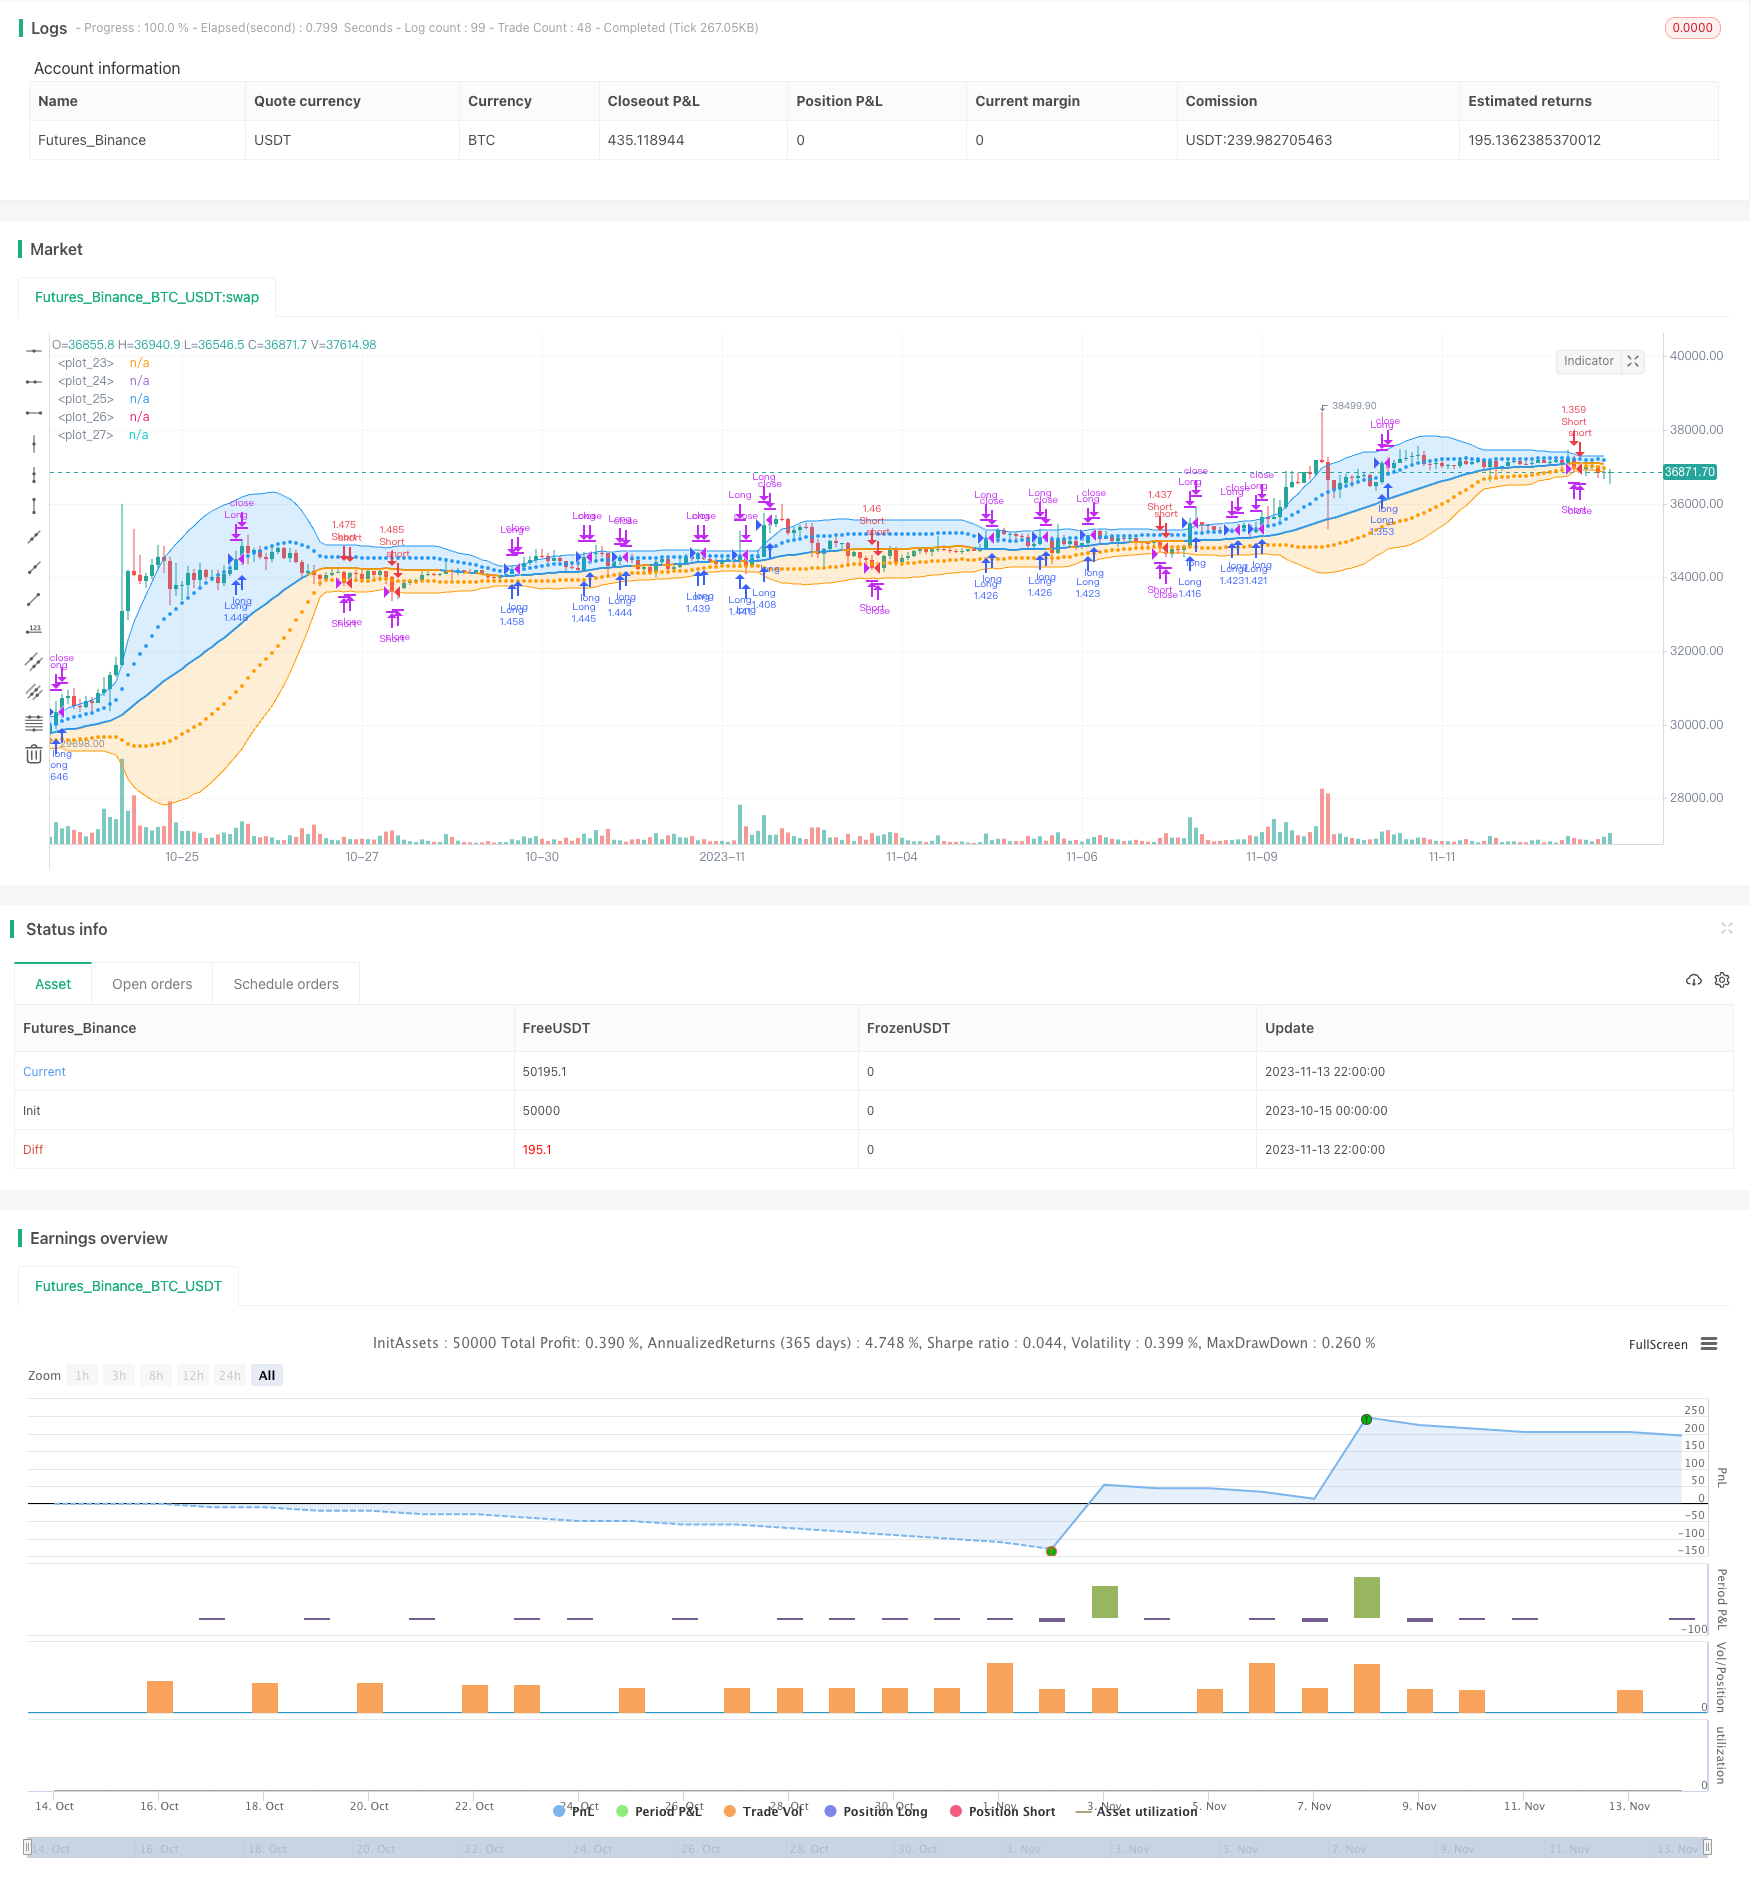
该策略综合运用波动带、相对强弱指标和移动平均聚散指标等多种技术指标,来进行买卖决策。策略首先在图表上绘制传统的波动带,不同的是用两种颜色的带状区域表示两个不同标准差水平。然后根据波动带是否被突破来决定开仓。另外,该策略还利用RSI和MACD指标作为买卖信号的额外确认。整体而言,该策略是一个综合多个技术指标进行买卖判断和持仓管理的全面交易策略。
策略原理
首先,策略在图表上绘制34周期的波动带,包含中轨、1个标准差和2个标准差的上下轨。
当收盘价上穿上轨时,进行多头开仓。当收盘价下穿下轨时,进行空头开仓。
当多头持仓时,如果收盘价下穿中轨,平仓多单。当空头持仓时,如果收盘价上穿中轨,平仓空单。
策略还引入RSI指标,RSI高于70时作为多头开仓的额外确认,RSI低于30时作为空头开仓的额外确认。
当RSI上穿50时,平仓空单。当RSI下穿50时,平仓多单。
策略还引入MACD指标,MACD金叉时作为多头开仓的额外确认,MACD死叉时作为空头开仓的额外确认。
当MACD死叉时,平仓多单。当MACD金叉时,平仓空单。
综合以上,该策略需要波动带、RSI和MACD三个指标同时满足条件,才会开仓。平仓条件也考虑了三个指标,从而降低了错误信号的概率。
优势分析
综合利用多种指标过滤信号,可以有效规避错误交易。波动带给出价格突破信号,RSI过滤超买超卖现象,MACD过滤行情趋势变化,三者共同确认信号,可以大幅提高盈利概率。
该策略还设定了不同的开仓和平仓逻辑,严格控制了持仓风险。中轨、RSI中轴线50以及MACD的金叉死叉都被作为平仓条件引入,可以快速止损,降低单笔损失。
与单一指标策略相比,该策略综合多种指标优势,可以显著提升盈利率和胜率,降低最大回撤。多指标组合过滤可以减少错误交易概率,严格的止损机制又可以控制每个损失交易的影响。
总的来说,该策略非常适合中长线趋势交易,既可以抓住市场主要趋势,又可以利用指标细节避免被套。多指标风控机制也使其可以安全运用较高杠杆。
风险分析
该策略主要存在以下几点风险:
指标发出虚假信号的概率。虽然综合多个指标可以减少错误信号,但不可能完全杜绝。需要优化指标参数,降低虚假信号率。
单边行情无法获利。趋势震荡时,止损可能被触发,无法持续获利。可以适当放宽止损标准,延长持仓周期。
部分指标滞后,可能错过最佳开仓时机。可以测试更先进的指标,提早捕捉转折。
大幅度跳空缺口使止损无效。可以设置通道止损或逐步加仓来控制损失。
Parameters过于固定,不同市场需调整。可以引入机器学习自动优化参数。
测试数据不足,可能存在过拟合。需要在更长时间段和多种市场中测试策略的稳健性。
优化方向
该策略可以从以下几个方面进行进一步优化:
优化指标参数,找到更合适的波动带周期、RSI周期和MACD参数组合,降低虚假信号。可以通过步进法、遍历法等方法寻找最佳参数。
增加自适应止损机制,而不是固定的中轨止损。可以结合ATR、趋势等因素,动态调整止损位置。
引入机器学习技术,实现参数的自适应优化。可以使用强化学习在不同市况下优化参数。
增加趋势判断规则, distinguish 不同阶段采用不同策略,提高策略动态适应能力。
结合文本分析、社交数据等造成加强多因素预测,使用更先进指标提前判断转折点。
进行复利优化,根据资金量调整仓位规模,使收益能够实现指数型增长。
进行组合优化,寻找互补策略,利用非相关性降低组合收益波动性。
总结
本策略综合运用多种技术指标进行入场和出场的判断,同时设置了严格的止损规则。相比单一指标,多指标组合可以显著减少虚假信号和提高获利概率。止损规则也可以控制每次损失的影响。该策略适合趋势行情,可以获得较高稳定收益。后续仍需优化指标参数,并增强策略的动态适应能力。总体而言,该策略是一个可靠、稳定、高效的量化交易方案。
/*backtest
start: 2023-10-15 00:00:00
end: 2023-11-14 00:00:00
period: 2h
basePeriod: 15m
exchanges: [{"eid":"Futures_Binance","currency":"BTC_USDT"}]
*/

//@version=5
// Bollinger Bands: Madrid : 14/SEP/2014 11:07 : 2.0
// This displays the traditional Bollinger Bands, the difference is
// that the 1st and 2nd StdDev are outlined with two colors and two
// different levels, one for each Standard Deviation

strategy(shorttitle='MBB', title='Bollinger Bands', overlay=true, currency=currency.NONE, initial_capital = 1000, default_qty_type = strategy.percent_of_equity, default_qty_value = 100, commission_value = 0.05)
src = input(close)
length = input.int(34, minval=1)
mult = input.float(2.0, minval=0.001, maxval=50)

basis = ta.sma(src, length)
dev = ta.stdev(src, length)
dev2 = mult * dev

upper1 = basis + dev
lower1 = basis - dev
upper2 = basis + dev2
lower2 = basis - dev2

colorBasis = src >= basis ? color.blue : color.orange

pBasis = plot(basis, linewidth=2, color=colorBasis)
pUpper1 = plot(upper1, color=color.new(color.blue, 0), style=plot.style_circles)
pUpper2 = plot(upper2, color=color.new(color.blue, 0))
pLower1 = plot(lower1, color=color.new(color.orange, 0), style=plot.style_circles)
pLower2 = plot(lower2, color=color.new(color.orange, 0))

fill(pBasis, pUpper2, color=color.new(color.blue, 80))
fill(pUpper1, pUpper2, color=color.new(color.blue, 80))
fill(pBasis, pLower2, color=color.new(color.orange, 80))
fill(pLower1, pLower2, color=color.new(color.orange, 80))


//Strategy code starts here

long_entry = ta.crossover(src, upper1)
short_entry = ta.crossunder(src, lower1)

strategy.entry("Long", strategy.long, when=long_entry)
strategy.entry("Short", strategy.short, when=short_entry)

if long_entry or close < basis
    strategy.close("Long", "Long")

if short_entry or close > basis
    strategy.close("Short", "Short")


//Calculate RSI
rsiLength = input(14)
rsiValue = ta.rsi(src, rsiLength)

// Define RSI conditions for entering and exiting trades
rsiLong = rsiValue > 70
rsiShort = rsiValue < 30


//Enter long position when RSI crosses above 50 and Bollinger Bands long entry condition is met
strategy.entry("Long", strategy.long, when=long_entry and rsiLong)

//Exit long position when RSI crosses below 50 or Bollinger Bands exit condition is met
strategy.close("Long Exit", when=rsiShort or close < basis)

//Enter short position when RSI crosses below 50 and Bollinger Bands short entry condition is met
strategy.entry("Short", strategy.short, when=short_entry and rsiShort)

//Exit short position when RSI crosses above 50 or Bollinger Bands exit condition is met
strategy.close("Short Exit", when=rsiLong or close > basis)


//Calculate MACD
fastLength = input(12)
slowLength = input(26)
macdLength = input(9)
macdValue = ta.macd(src, fastLength, slowLength, macdLength)

// Define MACD conditions for entering and exiting trades
macdLong = ta.crossover(src, macdLength)
macdShort = ta.crossunder(src, macdLength)

//Enter long position when MACD crosses above signal line and RSI and Bollinger Bands long entry condition is met
strategy.entry("Long", strategy.long, when=long_entry and rsiLong and macdLong)

//Exit long position when MACD crosses below signal line or RSI crosses below 50 or Bollinger Bands exit condition is met
strategy.close("Long Exit", when=macdShort or rsiShort or close < basis)

//Enter short position when MACD crosses below signal line and RSI crosses below 50 and Bollinger Bands short entry condition is met
strategy.entry("Short", strategy.short, when=short_entry and rsiShort and macdShort)

//Exit short position when MACD crosses above signal line or RSI crosses above 50 or Bollinger Bands exit condition is met
strategy.close("Short Exit", when=macdLong or rsiLong or close > basis)