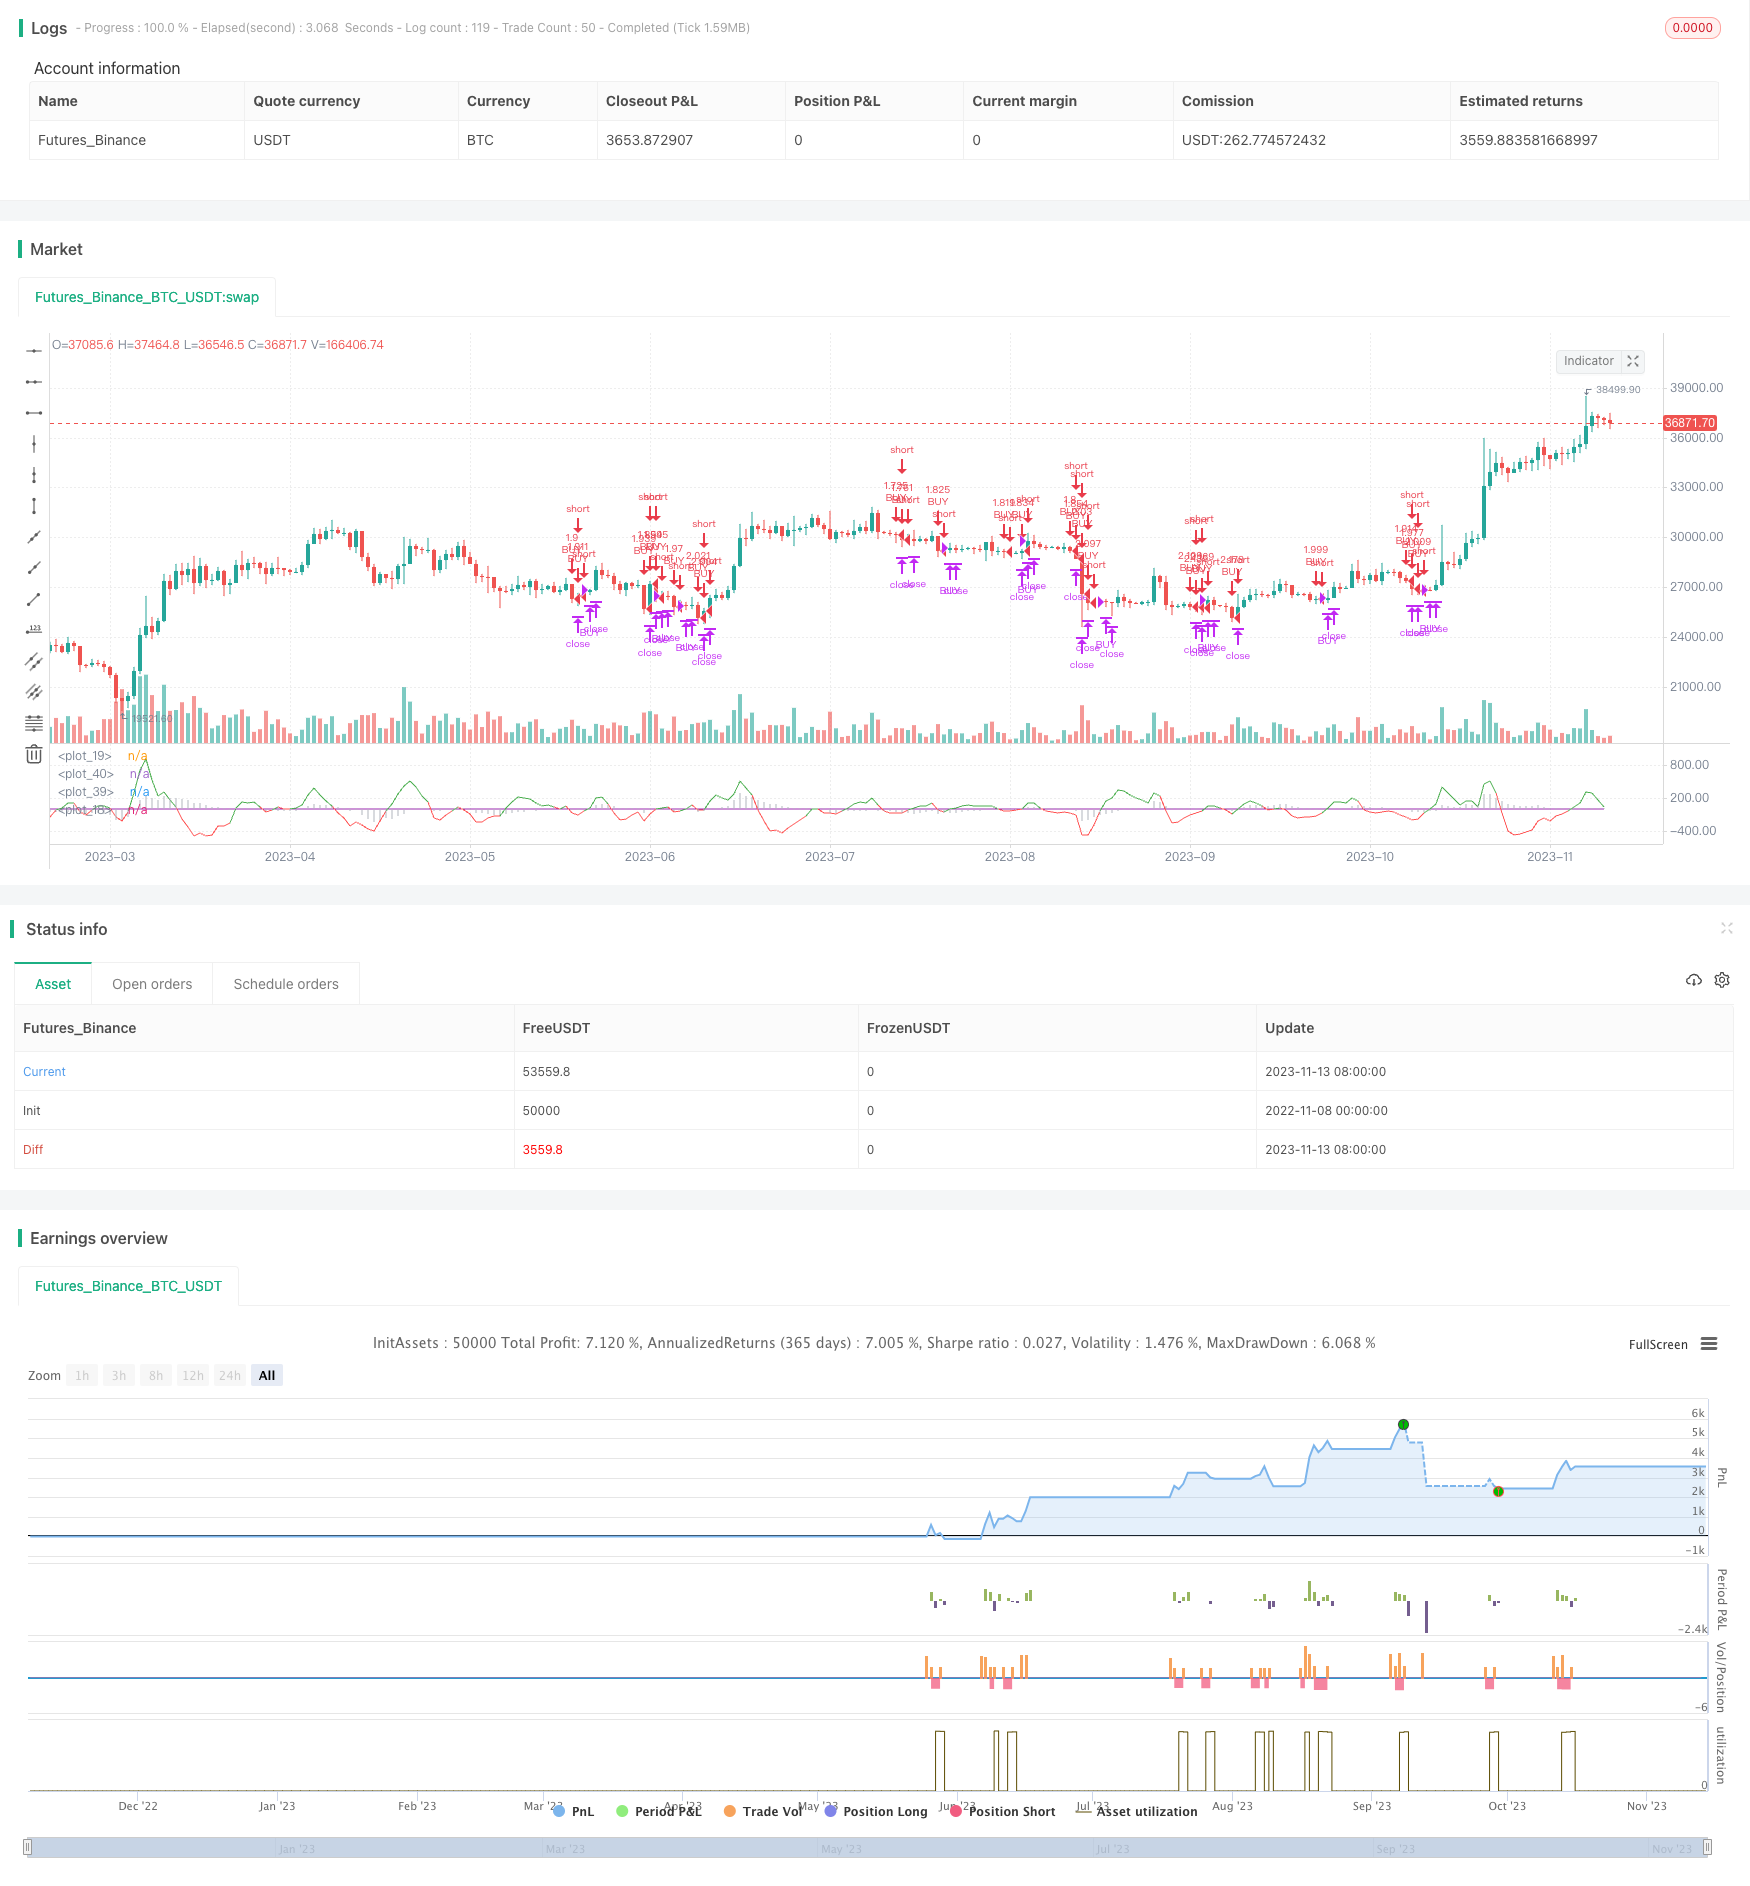
高値と低いTEMA平均の振動戦略
作者: リン・ハーンチャオチャン開催日:2023年11月15日17時49分52秒タグ:

概要
この戦略は,Bitcoinのダウントレンドを把握するためにTEMA,VWMACD,HMAインジケーターを使用する.その主な論理は,VWMACDが0を下回ると価格がHMAを下回り,速いTEMAがスローTEMAを下回るとショートに行くことである.VWMACDが0を下回ると価格がHMA上回り,速いTEMAがスローTEMA上回りするとポジションを退場する.
原則
まず,VWMACD (通常のMACDと唯一の違いは移動平均を計算する方法) を計算し,ヒストグラムとしてプロットします.その後,トレンドフィルターとしてHMAを追加します.その後,速いTEMA (5期) と遅いTEMA (8期) を作成し,追加し,それらの間の差を計算して0周りのプロットにします.これはショートに行くための重要な決定です.
VWMACDが0未満で価格がHMAを下回り,速いTEMAがスローTEMAを下回るとショートになります.
特定の出口ルールは,VWMACDが0を超えると価格がHMAを超えたり,高速TEMAがスローTEMAを超えたりすると,クローズポジションです.
利点分析
- 3つの指標の組み合わせを使用し,取引シグナルの信頼性を向上させます.
- VWMACDは差異を特定し,正確な傾向判断をすることができます.
- HMAはトレンドフィルターとして作られ 騒音の干渉を避けます
- 短期の逆転点を捉える
- 高周波取引に適した短期パラメータを採用し,短期的な下落傾向を把握します.
リスク分析
- 複数のインジケーター コンボ 複雑なパラメータ調整が必要
- HMAフィルターがあるにもかかわらず 市場を広めるのに 偽のブレイクを防ぐ必要があります
- 市場騒音の干渉に弱い短期間で,誤った信号が発生する可能性があります.
- 予期せぬ大きな損失を防ぐために厳格なストップ損失が必要です
- 高周波取引は 摩擦に易く傷つく
オプティマイゼーションの方向性
- 異なるパラメータの組み合わせをテストして最適なパラメータを見つけることができます
- RSI,KDなどの他の指標を追加できます.
- 異なる市場状況に応じて適応パラメータを使用できます
- ストップ・ロスの戦略を最適化できます
- 十分な推力がないように 音量指示器と組み合わせることができます
結論
この戦略は,VWMACD,HMA,および高速/遅いTEMAの組み合わせを使用して,ビットコインの短期的なダウントレンドを把握する.その利点は比較的信頼性の高い信号と高周波取引に適している.しかし,複雑なパラメータチューニング,ノイズ干渉に容易なリスクもあります.パラメータコンボをさらに最適化し,補助指標を追加することで,戦略をより安定して信頼性のあるものにすることができます.全体的に,複数の指標確認と短期パラメータを使用することで,この戦略はBitcoinの短期的なダウントレンドについて比較的正確な判断を下げることができ,効果的な高周波のショート戦略です.
/*backtest
start: 2022-11-08 00:00:00
end: 2023-11-14 00:00:00
period: 1d
basePeriod: 1h
exchanges: [{"eid":"Futures_Binance","currency":"BTC_USDT"}]
*/

//@version=4
strategy(title="TEMA_HMA_VWMACD short strategy", shorttitle="Short strategy", overlay=false, default_qty_type=strategy.percent_of_equity, default_qty_value=100, commission_type=strategy.commission.percent, commission_value=0.018, currency='USD')
startP = timestamp(input(2017, "Start Year"), input(12, "Month"), input(17, "Day"), 0, 0)
end   = timestamp(9999,1,1,0,0)
_testPeriod() =>
    iff(time >= startP and time <= end, true, false)


slow = input(13, "Short period")
fast = input(21, "Long period")
signal = input(5, "Smoothing period")

Fast = ema( volume * close, fast ) / ema( volume, fast )
Slow = ema( volume * close, slow ) / ema( volume, slow )
Macd = Slow - Fast
Signal = ema(Macd, signal)
Hist=Macd-Signal
plot(Hist, color=color.silver, linewidth=1, style=plot.style_histogram)
plot(0, color=color.red)

length = input(400, minval=1, title = "HMA")
hullma = wma(2*wma(close, length/2)-wma(close, length), floor(sqrt(length)))

tema_length_1 = input(5, "Fast moving TEMA")
tema_length_2 = input(8, "Slow moving TEMA")


tema(sec, length)=>
    tema1= ema(sec, length)
    tema2= ema(tema1, length)
    tema3= ema(tema2, length)
    tema = 3*tema1-3*tema2+tema3

tema1 = tema(hlc3, tema_length_1)
tema2 = tema(hlc3, tema_length_2)

threshold  = 0
tm = tema1 - tema2
plot_fast = plot(tm, color = tm > 0 ? color.green : color.red)
plot(threshold, color=color.purple)

up =  crossover(tm, 0)
down = crossunder(tm, 0)

longCondition =  (Hist < 0) and hullma > close and (tema1 < tema2)  and _testPeriod()
strategy.entry('BUY', strategy.short, when=longCondition)

shortCondition =  (Hist > 0) or hullma < close or up
strategy.close('BUY', when=shortCondition)


// Take profit
tp = input(1, type=input.float, title='Take Profit (%)')
sl = input(4, type=input.float, title='Stop Loss (%)')
strategy.exit('XLong', from_entry='BUY', profit=(close * (tp/100) * (1/syminfo.mintick)), loss=(close * (sl/100) * (1/syminfo.mintick)))
もっと
- 戦略をフォローするATR指標のトレンドと組み合わせた二重移動平均偏差
- マルチトレンド戦略
- 値引き平衡戦略
- 短期取引戦略の傾向
- BB21_SMA200 戦略をフォローする傾向
- モメント イチモク・クラウド・トレーディング・戦略
- 週末波動性取引戦略
- モメンタム・ブレイク・ミニアス・リバース・戦略
- 変更されたOBVとMACD量的な取引戦略
- 流量指数に基づく傾向 戦略に従う
- 動的移動平均トレンド取引戦略
- 平均逆転勢力の戦略
- エネルギー指標取引戦略の傾向
- 成長生産者 - 戦略をフォローする二重RSI傾向
- クロスタイムフレームのダブルブレークアウトレベル戦略
- 循環逆転後トレンドフォロー戦略
- MACD トレンド 戦略をフォローする
- 二重移動平均ストカスティック指標 バイナリーオプションの取引戦略
- CCI 強力な突破戦略
- 双動平均クロスオーバー・イントラデイ・フューチャー取引戦略