概述
该策略基于经典商品通道指数(CCI),只做多头。当CCI指标处于极低水平(CCI <-150 或用户定义阈值),并且重新取得力度(即CCI>前根K线的CCI)时,同时对价格“力度”本身进行过滤(即发出信号的K线收盘价必须高于开盘价的一定幅度 - 固定为0.25%),系统会进入市场。 当达到止损或者价格高于CCI上带时,平仓离场。
该策略用于获得高胜率(超过50%)的交易,而非追求捕捉趋势的全部长度。因此,适用于“看到潜在亏损就受不了”的交易者。
策略原理
使用ta.sma()和ta.dev()函数构建CCI指标及其区间带。
使用input选择起始交易日期,设置回测窗口。
入场条件:CCI下穿低线并开始上涨,同时要求信号K线收盘价高于开盘价0.25%。
出场条件1:CCI上穿上线,止盈离场。
出场条件2:跌破止损线,亏损离场。
策略仅做多,根据CCI指标力度选择入场时机,同时利用止损控制风险。
优势分析
该策略具有以下优势:
利用CCI指标识别超买超卖情况,能够有效抓住反转机会。
仅做多方向,避免错误操作带来的过多风险。
采用价格力度过滤,确保入场时价格已经形成支撑。
止损机制控制单笔亏损,有效管理资金。
回测参数灵活,可调整入场过滤条件。
胜率较高,适合注重资金管理的投资者。
策略思路清晰,代码实现简洁易懂。
风险分析
该策略也存在一定风险:
仅做多方向,容易错过短线向下趋势。
CCI参数设置不当可能导致失效。
停损设置过于宽松,无法有效控制亏损。
多头行情过强,止损被突破造成较大亏损。
交易频率过高带来交易成本压力。
对应风险管理措施:
优化CCI参数,寻找最佳值。
调整止损幅度,在风险和止损被突破概率之间找到平衡。
交易成本考虑在内,控制入场频率。
结合趋势和区间判断,避免单边方向交易。
优化方向
该策略可以从以下几个方面进行优化:
采用动态止损,根据市场波动程度调整止损距离。
结合MACD等指标,避免止损过于宽松。
增加卖出机会,在cci指标过热时考虑做空。
考虑交易成本因素,设置最小止盈距离。
优化参数与策略时间框架结合,寻找最佳组合。
利用机器学习方法自动优化参数。
增加资金管理模块,动态调整仓位。
总结
总而言之,该策略利用CCI指标的超买超卖特征,在价格形成支撑的情况下做多,通过止损控制风险,追求高胜率交易。策略优势在于简单易操作,风险控制到位。存在的不足之处在于仅做多、止损过于固定等,这些问题都可以通过参数优化、增加卖点、动态止损等方式得到改善。该策略适合追求高胜率、注重资金管理的投资者。
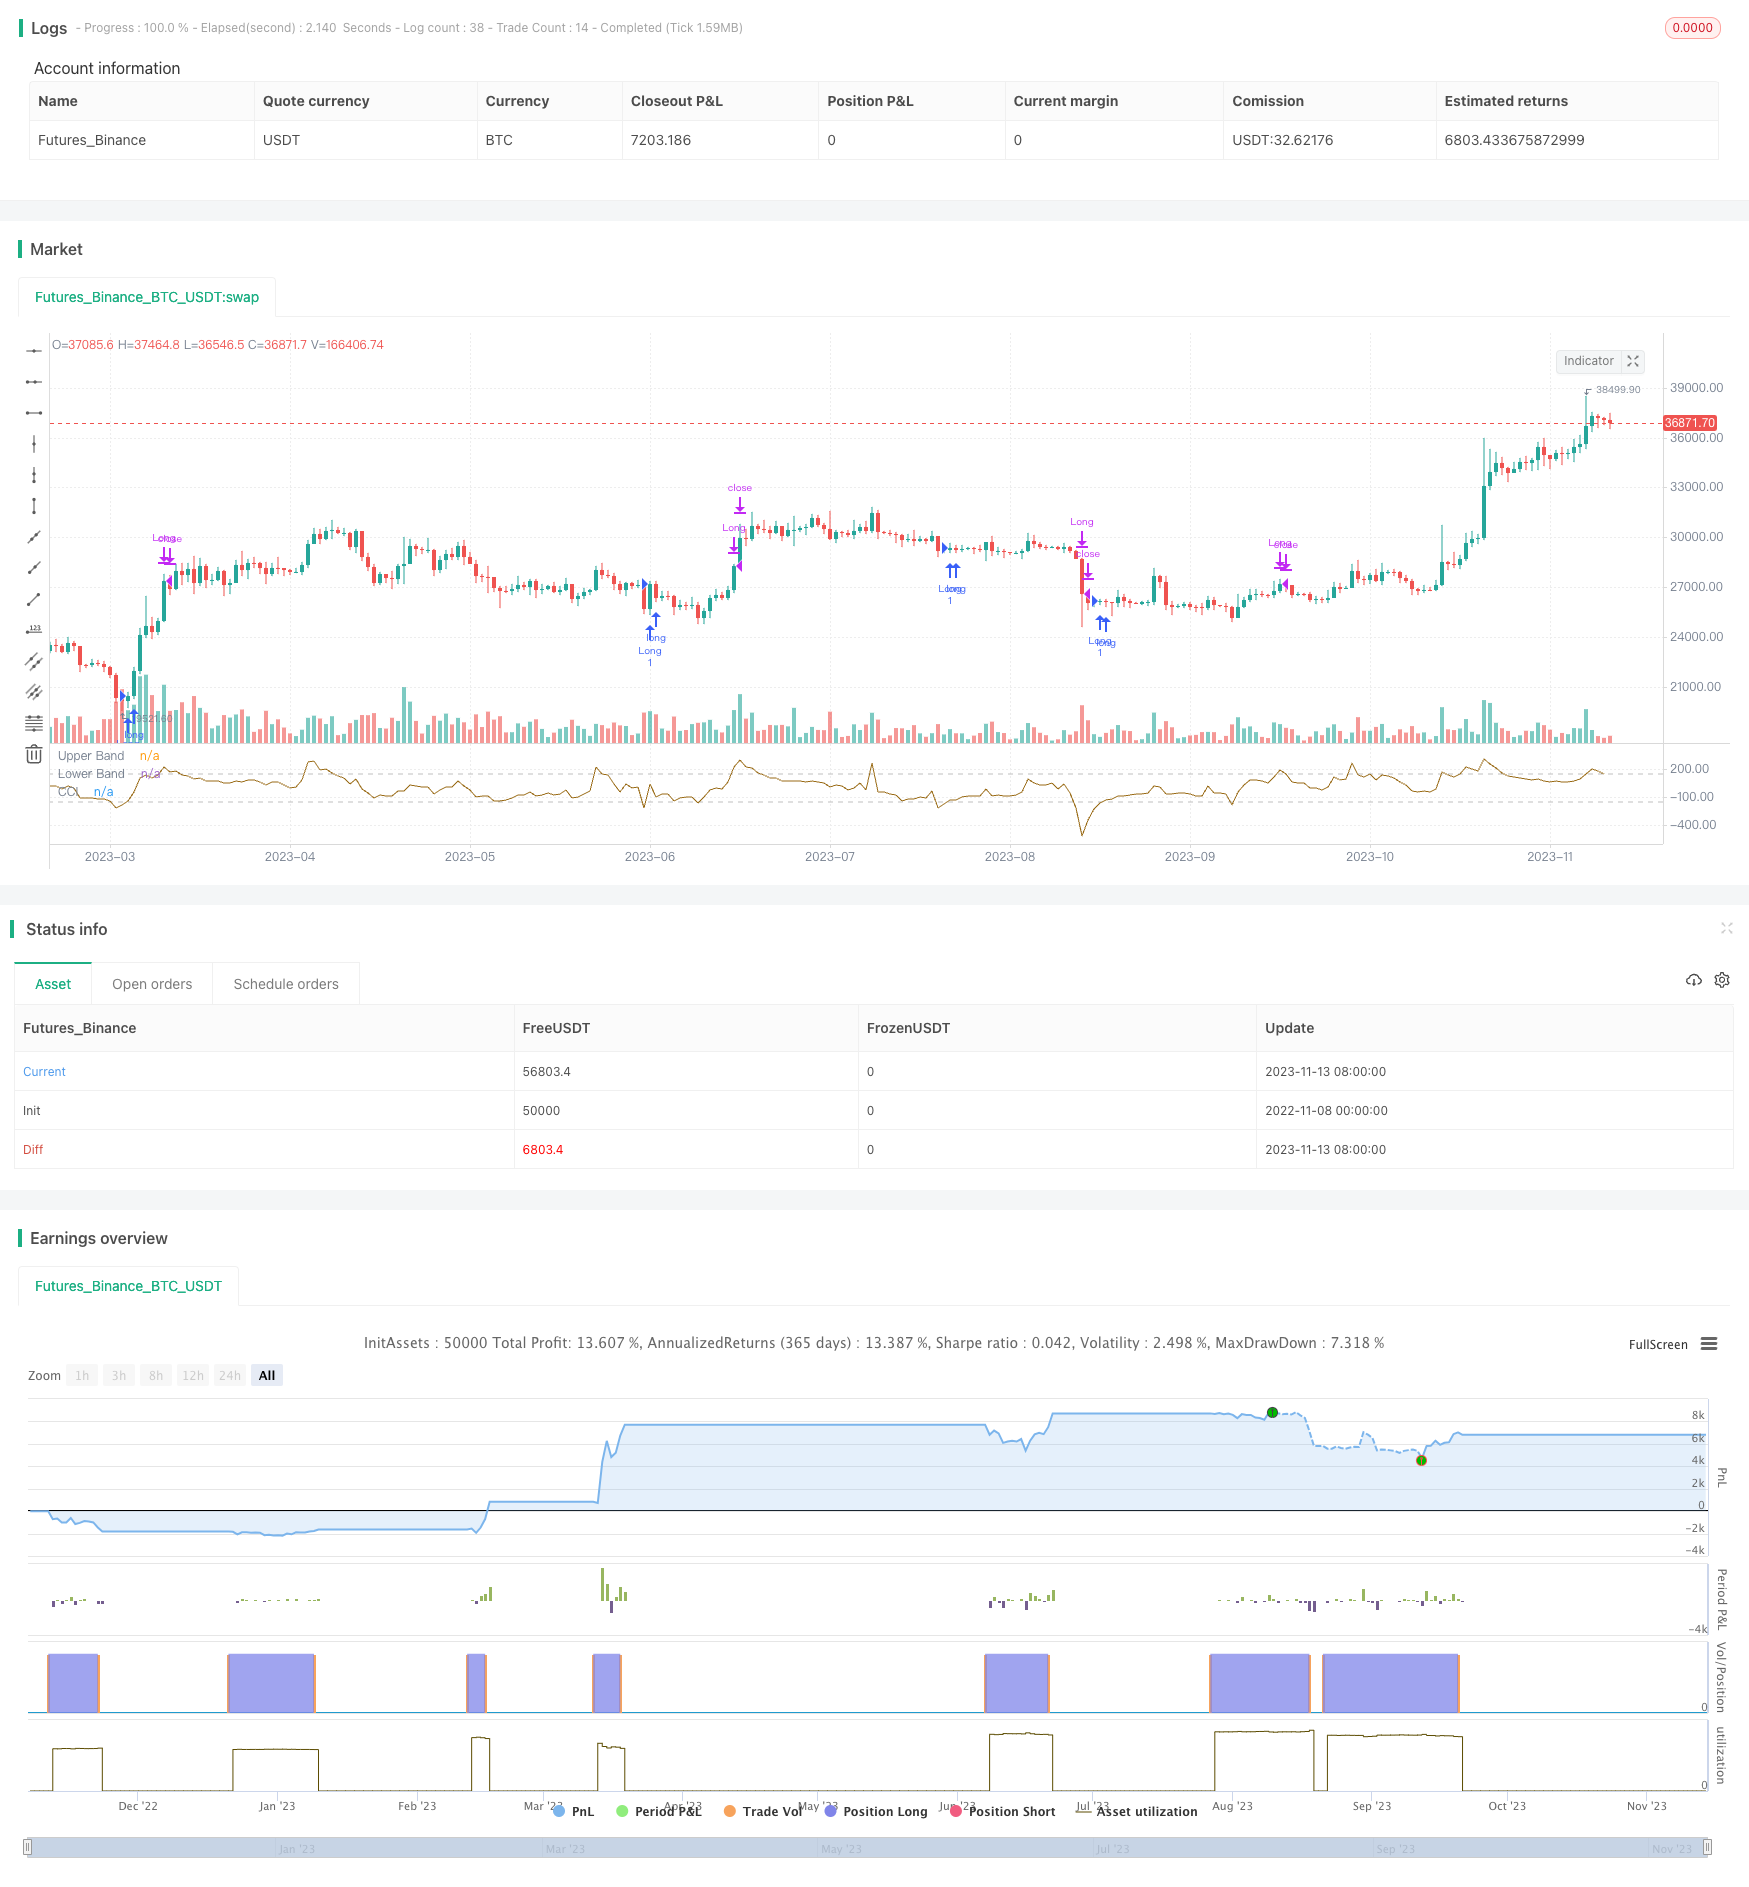
/*backtest
start: 2022-11-08 00:00:00
end: 2023-11-14 00:00:00
period: 1d
basePeriod: 1h
exchanges: [{"eid":"Futures_Binance","currency":"BTC_USDT"}]
*/

//@version=5
strategy(title='CCI High Performance long only', overlay=false )
src = input(close)
length = input.int(20, title='Period', minval=1)
lossp = input.float(8, title='Stop Loss percentage', minval=0.5, step=0.5)
scart = input.float(0.25, title='Close of the signal bar higher than Open %', minval = 0)
upperline = input.int(150, title='Upper Band', minval=0, step=10)
lowline = input.int(-150, title='Low Band', maxval=0, step=10)


// construction of CCI (not on close but in totalprice) and of bands
ma = ta.sma(src, length)
cci = (src - ma) / (0.015 * ta.dev(src, length))
plot(cci, 'CCI', color=color.new(#996A15, 0))
band1 = hline(upperline, 'Upper Band', color=#C0C0C0, linestyle=hline.style_dashed)
band0 = hline(lowline, 'Lower Band', color=#C0C0C0, linestyle=hline.style_dashed)
fill(band1, band0, color=color.new(#9C6E1B, 90), title='Background')
// === INPUT BACKTEST RANGE ===
fromMonth = input.int(defval = 1,    title = "From Month",  minval = 1, maxval = 12)
fromDay   = input.int(defval = 1,    title = "From Day",    minval = 1, maxval = 31)
fromYear  = input.int(defval = 2016, title = "From Year",   minval = 1970)
thruMonth = input.int(defval = 1,    title = "Thru Month",  minval = 1, maxval = 12)
thruDay   = input.int(defval = 1,    title = "Thru Day",    minval = 1, maxval = 31)
thruYear  = input.int(defval = 2112, title = "Thru Year",   minval = 1970)
// === FUNCTION EXAMPLE limit for backtest ===
start     = timestamp(fromYear, fromMonth, fromDay, 00, 00)            // backtest start  window
finish    = timestamp(thruYear, thruMonth, thruDay, 23, 59)            // backtest finish window
window()  => time >= start and time <= finish ? true : false           // create function "within window of time"
//ENTRY CONDITIONS

// strategy: enter when CCI is under the low line and starts increasing. The filter is that the signal candle should mark a close higher than a x-percent
// (0.25%) of the open
// Exit when either when it reaches the target of a prices highest than high level of CCI or fixed stop loss (in percentage)
scart_level = open * (1+scart/100)
entryl = cci[1] < lowline[1] and cci > cci[1] and close > scart_level and window()
exit1 = cci> upperline
strategy.entry('Long', strategy.long, when=entryl)
strategy.close('Long', when=exit1, comment='target')

// money management (only stop loss)
losspel = strategy.position_avg_price * (1 - lossp / 100)
fixed_stop_long = close < losspel
strategy.close('Long', when=fixed_stop_long, comment='Stop Loss')