概述
本策略综合利用两种指标:移均线反转和价格震荡指标,形成交易信号,实现在周期反转出现后抓住反弹的趋势交易策略。
原理
本策略主要利用以下两种技术指标进行交易信号判断:
移均线反转
该部分通过计算收盘价在过去两日的涨跌情况,与快线K值大小的组合,实现判断是否出现反转信号。当价格在过去两日持续上涨,且快线K值低于慢线K值时产生买入信号;当价格在过去两日持续下跌,且快线K值高于慢线K值时产生卖出信号。
价格脱离指标
Detrend Price Oscillator指标通过绘制水平移动平均线,并根据价格与该线的关系来识别价格周期。它过滤掉长于计算周期的趋势,因此可以识别出移动平均线所隐藏的短周期波动。当价格高于平均线时为买入信号,低于平均线时为卖出信号。
本策略将两种指标的信号进行综合,即在出现移均线反转信号时,同时价格脱离指标也给出确认的反转信号,则产生交易指令。这样可以过滤掉部分无效反转信号,在反转后抓住反弹的趋势机会。
优势
该策略最大的优势在于合理利用了两种指标的优势,进行互补确认,可以有效过滤无效信号,增强信号的可靠性。
移均线反转指标本身容易产生错误信号,仅仅依靠它来判断,容易追高杀跌。而引入价格脱离指标进行组合,可以避免在非理想的震荡区间进行反转操作。
价格脱离指标的参数设置也决定了它只识别较短周期的波动,从而与移均线反转的判断非常契合,可以识别合理的反转时机。
风险
该策略主要存在以下风险:
- 反弹力度不足,容易形成套牢
移均线反转容易发生在盘整震荡区间。如果反弹力度不足,很容易再次回调触碰止损线,无法获利。
- 参数设置不当
价格脱离指标的参数设置过大,会识别中长线周期趋势;过小则会增加误判风险。需要针对不同品种谨慎测试。
- 突发事件导致反转失败
重大突发消息事件介入,会打乱原有的趋势判断,导致反转信号失效。这需要关注基本面消息,避免消息事件发生时盲目交易。
优化方向
可以从以下几点进一步优化该策略:
- 增加止损机制
合理设置移动止损或时间止损,可以控制单次损失。
- 结合交易量指标
增加交易量的确认,例如突破平均成交量时才发出信号,可以避免量能不足的无效突破。
- 动态参数优化
根据市场阶段对参数进行动态优化,在趋势明显时适当放宽参数,在震荡时收紧参数。
- 采用机器学习方法动态优化
使用随机森林等机器学习方法对参数组合进行评估和选择,实现动态智能优化。
总结
本策略较好地结合了两种指标的优势,在反转点抓住反弹趋势。虽然仍存在被套、参数优化等问题,但整体思路清晰,逻辑合理,值得进一步测试和优化,以实现稳定获利。
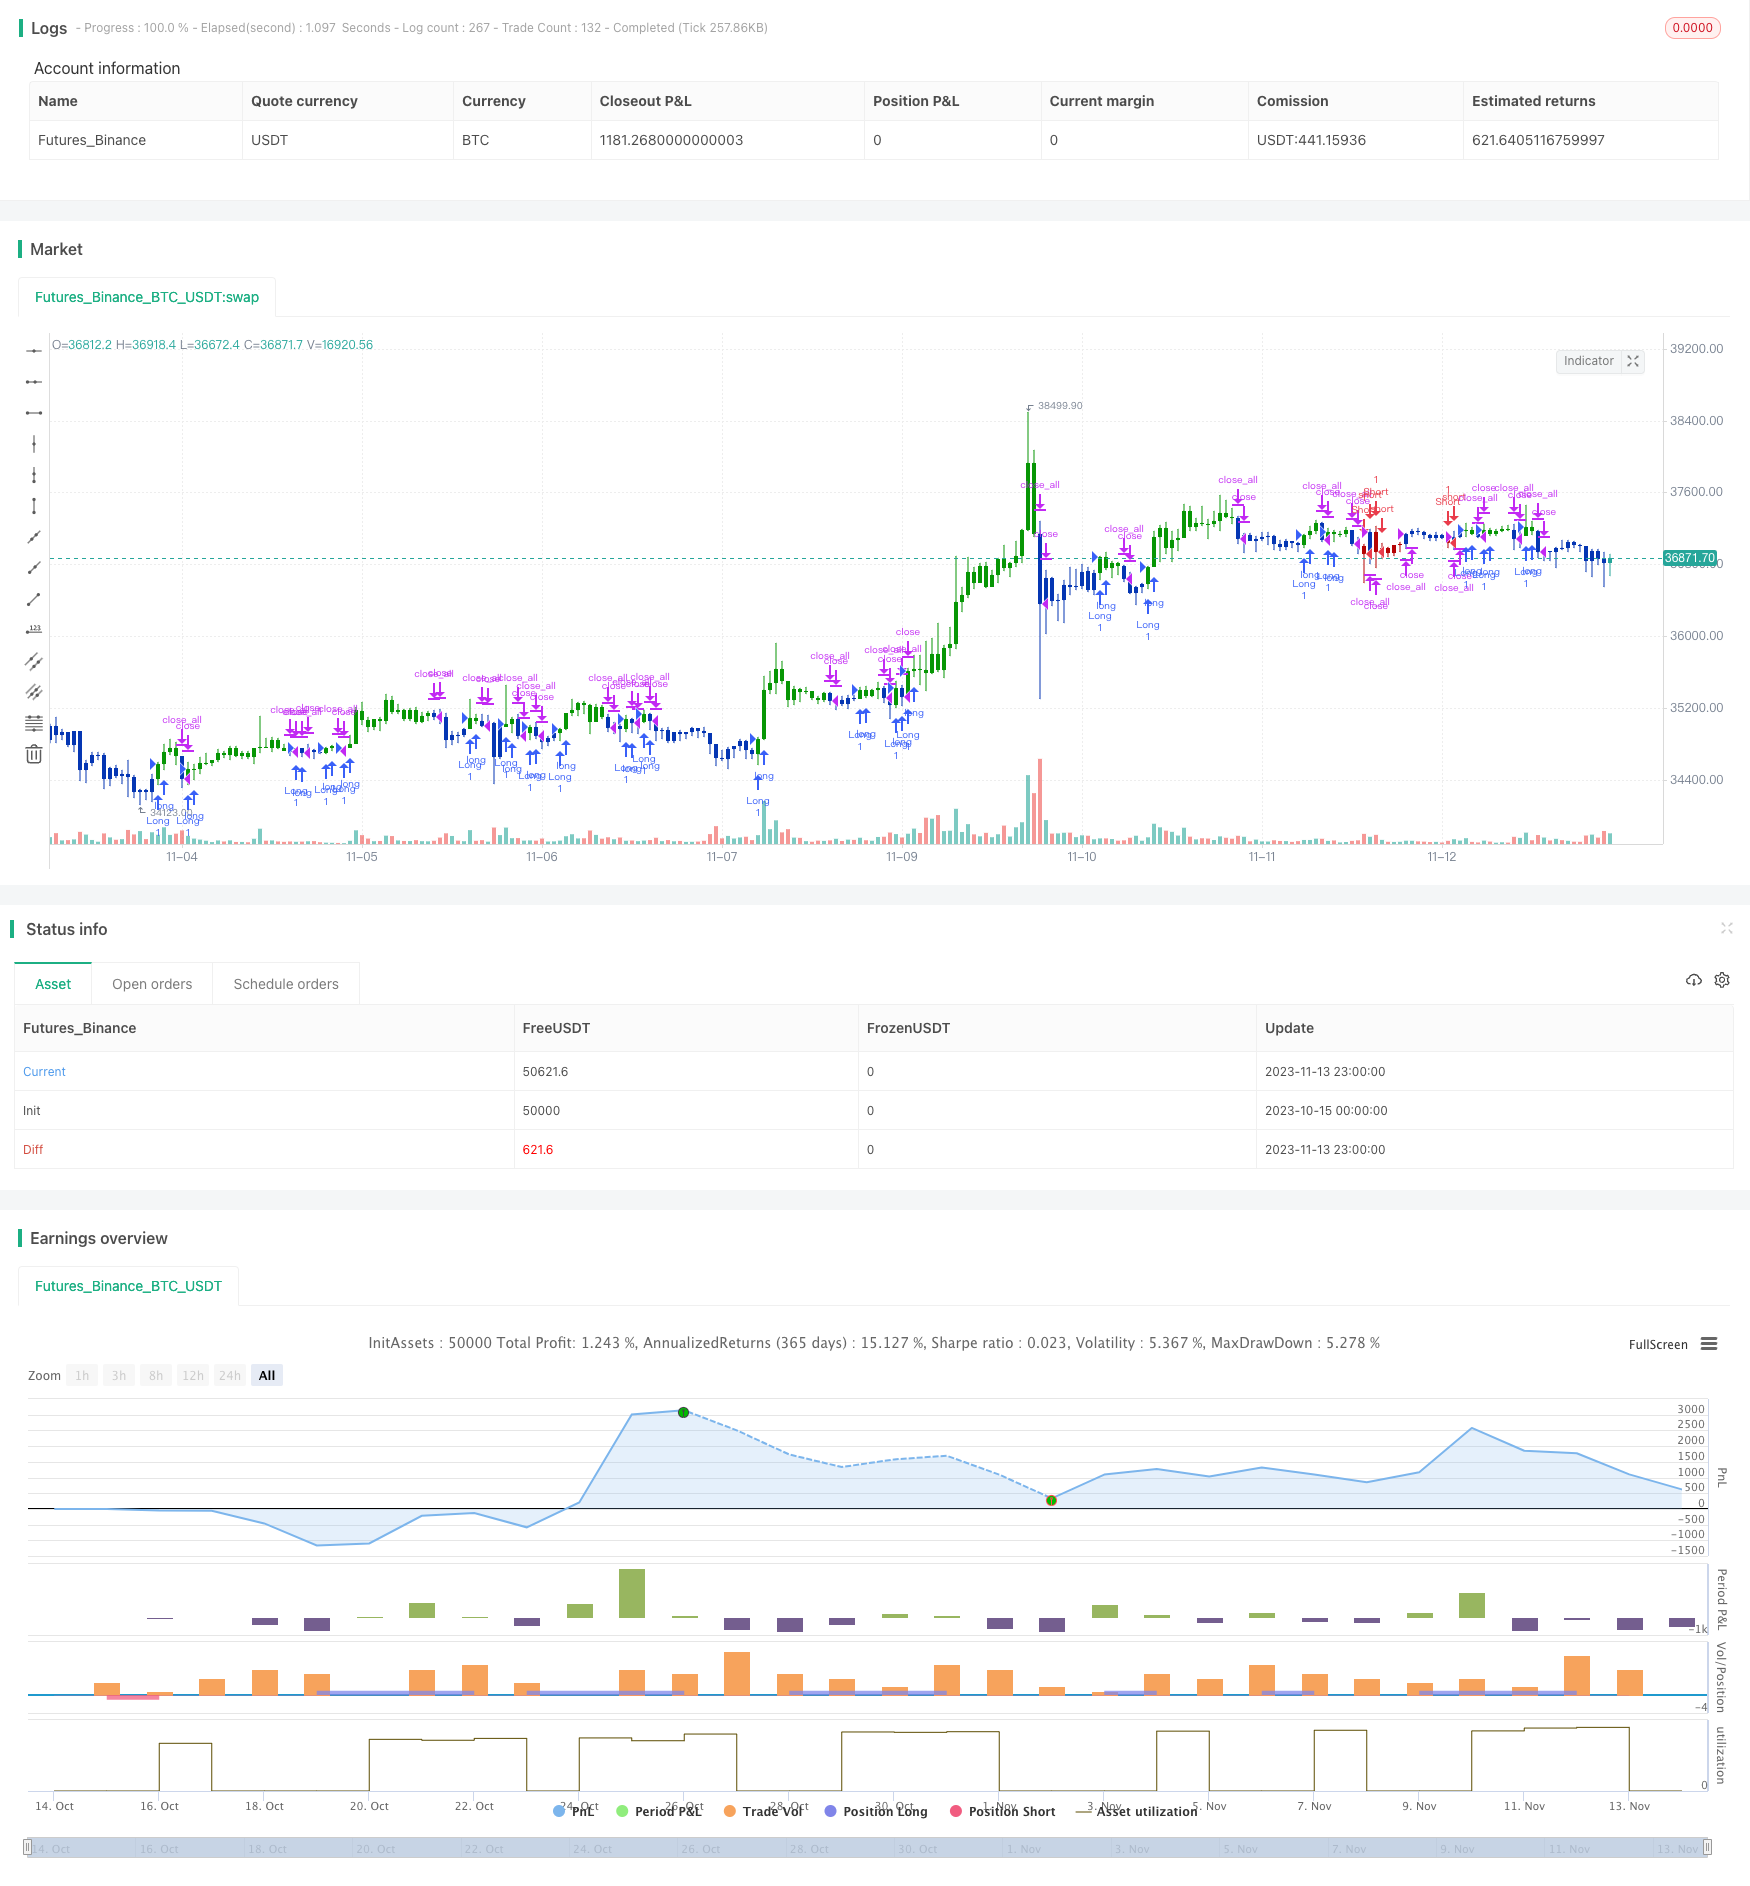
/*backtest
start: 2023-10-15 00:00:00
end: 2023-11-14 00:00:00
period: 1h
basePeriod: 15m
exchanges: [{"eid":"Futures_Binance","currency":"BTC_USDT"}]
*/

//@version=4
////////////////////////////////////////////////////////////
//  Copyright by HPotter v1.0 30/12/2019
// This is combo strategies for get a cumulative signal.
//
// First strategy
// This System was created from the Book "How I Tripled My Money In The
// Futures Market" by Ulf Jensen, Page 183. This is reverse type of strategies.
// The strategy buys at market, if close price is higher than the previous close
// during 2 days and the meaning of 9-days Stochastic Slow Oscillator is lower than 50.
// The strategy sells at market, if close price is lower than the previous close price
// during 2 days and the meaning of 9-days Stochastic Fast Oscillator is higher than 50.
//
// Second strategy
// The Detrend Price Osc indicator is similar to a moving average,
// in that it filters out trends in prices to more easily identify
// cycles. The indicator is an attempt to define cycles in a trend
// by drawing a moving average as a horizontal straight line and
// placing prices along the line according to their relation to a
// moving average. It provides a means of identifying underlying
// cycles not apparent when the moving average is viewed within a
// price chart. Cycles of a longer duration than the Length (number
// of bars used to calculate the Detrend Price Osc) are effectively
// filtered or removed by the oscillator.
//
// WARNING:
// - For purpose educate only
// - This script to change bars colors.
////////////////////////////////////////////////////////////
Reversal123(Length, KSmoothing, DLength, Level) =>
    vFast = sma(stoch(close, high, low, Length), KSmoothing)
    vSlow = sma(vFast, DLength)
    pos = 0.0
    pos := iff(close[2] < close[1] and close > close[1] and vFast < vSlow and vFast > Level, 1,
	         iff(close[2] > close[1] and close < close[1] and vFast > vSlow and vFast < Level, -1, nz(pos[1], 0)))
	pos

DPO(Length) =>
    pos = 0.0
    xPrice = close
    xsma = sma(xPrice, Length)
    nRes = xPrice - xsma
    pos := iff(nRes > 0, 1,
    	     iff(nRes < 0, -1, nz(pos[1], 0)))
    pos

strategy(title="Combo Backtest 123 Detrended Price Oscillator", shorttitle="Combo", overlay = true)
Length = input(14, minval=1)
KSmoothing = input(1, minval=1)
DLength = input(3, minval=1)
Level = input(50, minval=1)
//-------------------------
LengthDPO = input(14, minval=1)
reverse = input(false, title="Trade reverse")
posReversal123 = Reversal123(Length, KSmoothing, DLength, Level)
posDPO = DPO(LengthDPO)
pos = iff(posReversal123 == 1 and posDPO == 1 , 1,
	   iff(posReversal123 == -1 and posDPO == -1, -1, 0))
possig = iff(reverse and pos == 1, -1,
          iff(reverse and pos == -1 , 1, pos))
if (possig == 1)
    strategy.entry("Long", strategy.long)
if (possig == -1)
    strategy.entry("Short", strategy.short)
if (possig == 0)
    strategy.close_all()
barcolor(possig == -1 ? #b50404: possig == 1 ? #079605 : #0536b3 )