マルチトレンド戦略
概要
この戦略は,トレンドの方向を識別する複数の指標を総合的に使用し,トレンド追跡方法を採用し,中短線でトレンドの機会を捕捉します. 戦略は,トレンドを追跡するために特別に設計され,勝利率を増やし,反転を減らすことを目的としています.
戦略原則
WVAP指数で価格の割合を判断する.
RSIは空気の多動性を判断します.
QQE指標は価格突破を特定する.
ADXはトレンドの強さを判断する指標です.
コーラル・トレンド・インディケーターは 基本面の動きを判断します.
LSMAの指数は傾向を判断するのに役立ちます.
複数の指標信号を組み合わせて取引信号を発信する.
この戦略は,主にRSI,QQE,ADXなどの複数の指標によってトレンドの方向と強さを判断し,Coral Trend Indicatorの曲線を基本的トレンド判断基準として使用します. RSIなどの指標が買入シグナルを発信するとき,Coral Trend Indicatorも上昇曲線を示している場合,上昇傾向に適合する高い確率がある場合,戦略は買入を選択します.
戦略的優位性
複数の指標の組み合わせにより 判断の精度が向上します.
収益の確率を高めるためのトレンド追跡を強調する.
市場を切り抜くための突破的な考え方を採用し,
基本指数と組み合わせて逆行を避ける
取引の時間や時刻を合理的に設定し,リスクを低減する.
戦略は明確で,理解し,最適化することが容易です.
この戦略の最大の利点は,複数の指標の組み合わせ判断であり,単一の指標の誤判の可能性を一定程度に軽減し,判断の正確性を高めることができる.また,トレンド追跡と突破思考を強調し,近縁のショートラインの機会を出するのに役立つ.さらに,戦略は基本的指標を加え,逆転操作を避ける.これらのデザインは,戦略の安定性と利潤率を向上させる.
戦略リスク
タイムラグがあるため,最高の入場時間を逃す可能性がある.
撤回管理は不十分で,撤回のリスクは大きい.
基本面の転換が起こると,戦略は信号を逃す可能性があります.
取引コストを考慮しない場合,実用化時に収益が低下するリスクがある.
この戦略の最大のリスクは,多指標の組み合わせ判断が遅滞して,最適な入場時間を逃すことになり,利益の余地に影響を与える可能性があることにある.また,戦略の引き戻し制御は理想的ではないので,引き戻しのリスクが大きい.市場の基本面が転じ,指標が反映されていないとき,損失が生じやすい.実際の適用では,取引コストも利益に一定の影響を与える.
戦略最適化の方向性
損失を抑える戦略に加わり,回収制御を最適化します.
パラメータ設定を最適化し,指標の遅延を短縮する.
基本指標の適用を拡大し,その正確さを向上させる.
機械学習アルゴリズムと組み合わせて,動的パラメータ最適化を実現する.
この戦略の最適化の重点は,引き戻し制御を考慮し,移動止損戦略を追加して利潤をロックし,引き戻しを軽減することができる.同時に,パラメータ設定を最適化し,指標の遅延を短くし,戦略の市場変化に対する感受性を強化することができる.さらに,基本的判断指標をさらに増やし,正確性を向上させることができる.機械学習の方法を適用できれば,パラメータダイナミック最適化を実現できれば,戦略の安定性も大幅に向上する.
要約する
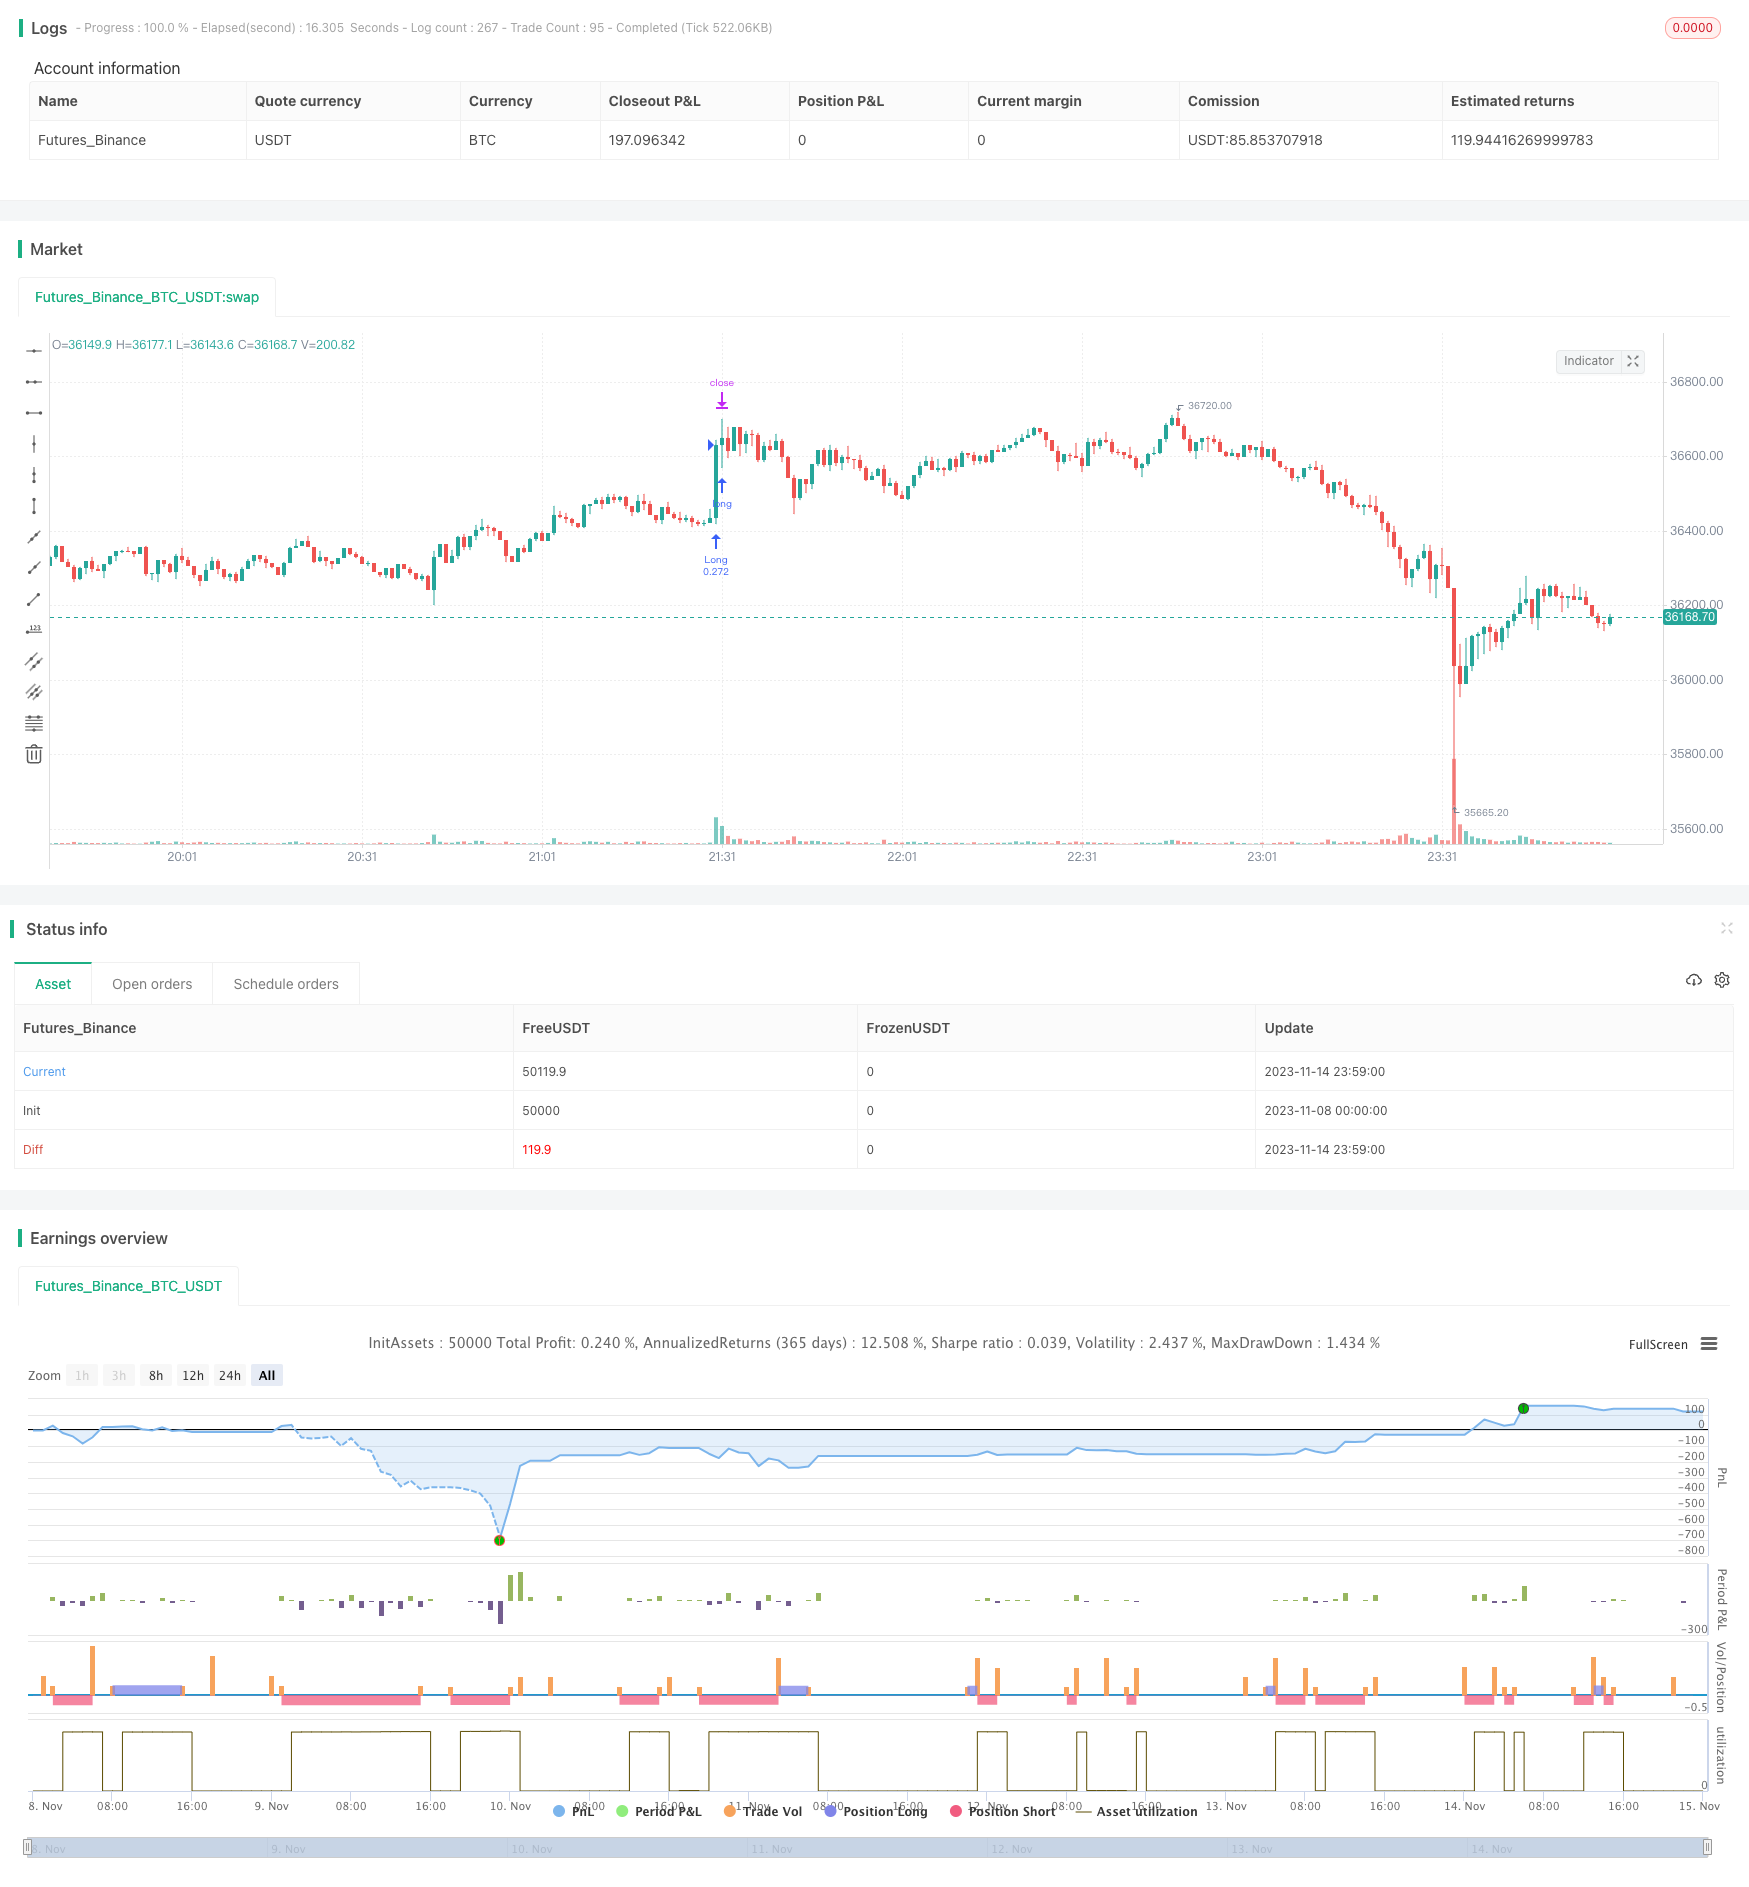
本戦略は,多種多様な指標を総合してトレンドの方向性を判断し,トレンド追跡の理念を採用して設計し,判断の正確性を高め,利益の確率を増やすことを目的としている.戦略は,指標の組み合わせ判断,トレンド追跡を強調し,基本面を組み合わせるなどの優位性を持っているが,誤判時の滞り,撤回制御の不足などの問題もある.将来的には,最適化パラメータを設定し,ストップ・ローズ戦略を完善し,基本面の指標を増やすなどの方法で改善することができ,戦略は実用化においてより効果的になる.
/*backtest
start: 2023-11-08 00:00:00
end: 2023-11-15 00:00:00
period: 1m
basePeriod: 1m
exchanges: [{"eid":"Futures_Binance","currency":"BTC_USDT"}]
*/

// This source code is subject to the terms of the Mozilla Public License 2.0 at https://mozilla.org/MPL/2.0/
// © RolandoSantos

//@version=4
strategy(title = "VWAP Candles Strategy", overlay=true, shorttitle = "VWAP Cndl",  default_qty_type=strategy.cash, default_qty_value=10000, initial_capital=10000)

//Make inputs that set the take profit %
longProfitPerc = input(title="Take Long Profit % ", minval=0.0, step=0.1, defval=0.3) / 100
shortProfitPerc = input(title="Take Short Profit % ", minval=0.0, step=0.1, defval=0.95) / 100

tp = input(100, "Take Profit % QTY (How much profit you want to take after take profit target is triggered)")

// Figure out take profit price
longExitPrice  = strategy.position_avg_price * (1 + longProfitPerc)
shortExitPrice  = strategy.position_avg_price * (1 - shortProfitPerc)

//Use NYSE for Copp Curve entries and exits//
security = input("", title="Change this if you want to see Copp Curve calculated for current ticker. All Copp Curve calculations are base on NYSE Composite")
ticker = security(security,"", close)

///Copp Curve////

period_ = input(21, title="Length", minval=1)
isCentered = input(false, title="Centered")
barsback = period_/2 + 1
ma = sma(close, period_)
dpo = isCentered ? close[barsback] - ma : close - ma[barsback]


instructions =input(title="Standard Copp settings are (10, 14, 11) however, DOUBLE these lengths as alternate settings to (20,28,22) and you will find it may produce better results, but less trades", defval="-")
wmaLength = input(title="WMA Length (Experiment changing this to longer lengths for less trades, but higher win %)", type=input.integer, defval=20)
longRoCLength = input(title="Long RoC Length", type=input.integer, defval=28)
shortRoCLength = input(title="Short RoC Length", type=input.integer, defval=22)
source = ticker
curve = wma(roc(source, longRoCLength) + roc(source, shortRoCLength), wmaLength)

//////////// QQE////////////QQE///////////////////QQE////////////////////////

// This source code is subject to the terms of the Mozilla Public License 2.0 at https://mozilla.org/MPL/2.0/
// © KivancOzbilgic

//@version=4
src=input(close)
length = input(25,"RSI Length", minval=1)
SSF=input(9, "SF RSI SMoothing Factor", minval=1)
showsignals = input(title="Show Crossing Signals?", type=input.bool, defval=true)
highlighting = input(title="Highlighter On/Off ?", type=input.bool, defval=true)
RSII=ema(rsi(src,length),SSF)
TR=abs(RSII-RSII[1])
wwalpha = 1/ length
WWMA = 0.0
WWMA := wwalpha*TR + (1-wwalpha)*nz(WWMA[1])
ATRRSI=0.0
ATRRSI := wwalpha*WWMA + (1-wwalpha)*nz(ATRRSI[1])
QQEF=ema(rsi(src,length),SSF)
QUP=QQEF+ATRRSI*4.236
QDN=QQEF-ATRRSI*4.236
QQES=0.0
QQES:=QUP<nz(QQES[1]) ? QUP : QQEF>nz(QQES[1]) and QQEF[1]<nz(QQES[1]) ? QDN :  QDN>nz(QQES[1]) ? QDN : QQEF<nz(QQES[1]) and QQEF[1]>nz(QQES[1]) ? QUP : nz(QQES[1])
//QQF=plot(QQEF,"FAST",color.maroon,2)
//QQS=plot(QQES,"SLOW",color=color.blue, linewidth=1)
buySignalr = crossover(QQEF, QQES)
sellSignalr = crossunder(QQEF, QQES)
buyr = QQEF > QQES


////QQE////////////////QQE/////////////////QQE/////////////////

//////////////LSMA//////////////////////////


//  LSMA 1 Settings & Plot
lsma1Length = input(100, minval=1, title="LSMA 1")
lsma1Offset = input(title="LSMA 1 Offset", type=input.integer, defval=0)
lsma1Source = input(close, title="LSMA 1 Source")
lsma1 = linreg(lsma1Source, lsma1Length, lsma1Offset)
lsma1_std_dev = stdev(abs(lsma1[1] - lsma1), lsma1Length)
//plot(lsma1, color=(lsma1 > lsma1[1] ? color.yellow : color.blue), title="LSMA 1", linewidth=2, transp=0)

////////////LSMA///////////////////


//////////////////ADX////////////////////

len = input(14)
th = input(20)

TrueRange = max(max(high-low, abs(high-nz(close[1]))), abs(low-nz(close[1])))
DirectionalMovementPlus = high-nz(high[1]) > nz(low[1])-low ? max(high-nz(high[1]), 0): 0
DirectionalMovementMinus = nz(low[1])-low > high-nz(high[1]) ? max(nz(low[1])-low, 0): 0

SmoothedTrueRange = 0.0
SmoothedTrueRange := nz(SmoothedTrueRange[1]) - (nz(SmoothedTrueRange[1])/len) + TrueRange

SmoothedDirectionalMovementPlus = 0.0
SmoothedDirectionalMovementPlus := nz(SmoothedDirectionalMovementPlus[1]) - (nz(SmoothedDirectionalMovementPlus[1])/len) + DirectionalMovementPlus

SmoothedDirectionalMovementMinus = 0.0
SmoothedDirectionalMovementMinus := nz(SmoothedDirectionalMovementMinus[1]) - (nz(SmoothedDirectionalMovementMinus[1])/len) + DirectionalMovementMinus

DIPlus = SmoothedDirectionalMovementPlus / SmoothedTrueRange * 100
DIMinus = SmoothedDirectionalMovementMinus / SmoothedTrueRange * 100
DX = abs(DIPlus-DIMinus) / (DIPlus+DIMinus)*100
ADX = sma(DX, len)

///////////////////ADX/////////////////////


/////////////sqz momentum/////////////////////////

//
// @author LazyBear & ChrisMoody complied by GIS_ABC
//
lengthBB = input(20, title="BB Length")
mult = input(2.0,title="BB MultFactor")
lengthKC=input(20, title="KC Length")
multKC = input(1.5, title="KC MultFactor")

useTrueRange = input(true, title="Use TrueRange (KC)")

// Calculate BB
sourceBB = close
basis = sma(sourceBB, lengthBB)
dev = multKC * stdev(source, lengthBB)
upperBB = basis + dev
lowerBB = basis - dev

// Calculate KC
maKC = sma(sourceBB, lengthKC)
rangeKC = useTrueRange ? tr : (high - low)
rangema = sma(rangeKC, lengthKC)
upperKC = maKC + rangema * multKC
lowerKC = maKC - rangema * multKC

sqzOn  = (lowerBB > lowerKC) and (upperBB < upperKC)
sqzOff = (lowerBB < lowerKC) and (upperBB > upperKC)
noSqz  = (sqzOn == false) and (sqzOff == false)

val = linreg(source  -  avg(avg(highest(high, lengthKC), lowest(low, lengthKC)),sma(close,lengthKC)),lengthKC,0)


////////////////////////////

/////// RSI on EMA/////////////////

lenrsi = input(13, minval=1, title="Length")
srcrsi = linreg(hlc3,100,0)
up = rma(max(change(srcrsi), 0), lenrsi)
down = rma(-min(change(srcrsi), 0), lenrsi)
rsi = down == 0 ? 100 : up == 0 ? 0 : 100 - (100 / (1 + up / down))
rsicolor = rsi > rsi[1] ? color.green : color.red
//plot(rsi,color = rsicolor)
//hline(20,color=color.green)
//hline(80,color=color.red)
vwaprsi = rsi(vwap(hlc3),13)
vwaprsicolor = vwaprsi > vwaprsi[1] ? color.blue : color.yellow
emarsi = ema(rsi,13)
emarsicolor = emarsi > emarsi[1] ? color.green : color.red
//plot(emarsi,color=emarsicolor)
//plot(vwaprsi,color=vwaprsicolor)

/////// RSI on VWMA/////////////////

lenrsiv = input(23, minval=1, title="Length RSI VWMA")
srcrsiv = vwma(linreg(close,23,0),23)
upv = rma(max(change(srcrsiv), 0), lenrsiv)
downv = rma(-min(change(srcrsiv), 0), lenrsiv)
rsiv = downv == 0 ? 100 : upv == 0 ? 0 : 100 - (100 / (1 + upv / downv))
rsicolorv = rsiv > rsiv[1] ? color.green : color.red

/////////////////////////////////////

/////////////////////////////////////

////////////////coral trend////////////////////
//
// @author LazyBear
// List of all my indicators:
// https://docs.google.com/document/d/15AGCufJZ8CIUvwFJ9W-IKns88gkWOKBCvByMEvm5MLo/edit?usp=sharing
//
//study(title="Coral Trend Indicator [LazyBear]", shorttitle="CTI_LB", overlay=true)
srcCT=close
i1 = 1.0
i2 = 1.0
i3 = 1.0
i4 = 1.0
i5 = 1.0
i6 = 1.0

sm =input(21, title="Smoothing Period")
cd = input(0.4, title="Constant D")
ebc=input(false, title="Color Bars")
ribm=input(false, title="Ribbon Mode")
di = (sm - 1.0) / 2.0 + 1.0
c1 = 2 / (di + 1.0)
c2 = 1 - c1
c3 = 3.0 * (cd * cd + cd * cd * cd)
c4 = -3.0 * (2.0 * cd * cd + cd + cd * cd * cd)
c5 = 3.0 * cd + 1.0 + cd * cd * cd + 3.0 * cd * cd
i1 := c1*srcCT + c2*nz(i1[1])
i2 := c1*i1 + c2*nz(i2[1])
i3 := c1*i2 + c2*nz(i3[1])
i4 := c1*i3 + c2*nz(i4[1])
i5 := c1*i4 + c2*nz(i5[1])
i6 := c1*i5 + c2*nz(i6[1])

bfr = -cd*cd*cd*i6 + c3*(i5) + c4*(i4) + c5*(i3)
// --------------------------------------------------------------------------
// For the Pinescript coders: Determining trend based on the mintick step.
// --------------------------------------------------------------------------
//bfrC = bfr - nz(bfr[1]) > syminfo.mintick ? green : bfr - nz(bfr[1]) < syminfo.mintick ? red : blue
//bfrC = bfr > nz(bfr[1]) ? green : bfr < nz(bfr[1])  ? red : blue
//tc=ebc?gray:bfrC
//plot(ribm?na:bfr, title="Trend", linewidth=3)
//bgcolor(ribm?bfrC:na, transp=50)
//barcolor(ebc?bfrC:na)
////////////////////////////////////////////////////////////////

///////////////////VWAP///////////////////


//------------------------------------------------

//------------------------------------------------
NormalVwap=vwap(hlc3)
H = vwap(high)
L = vwap(low)
O = vwap(open)
C = vwap(close)

left = 30

left_low = lowest(left)
left_high = highest(left)
newlow = low <= left_low
newhigh = high >= left_high

q = barssince(newlow)
w = barssince(newhigh)
col2 = q < w ?  #8B3A3A : #9CBA7F
col2b=O > C?color.red:color.lime


AVGHL=avg(H,L)
AVGOC=avg(O,C)
col=AVGHL>AVGOC?color.lime:color.red
col3=open > AVGOC?color.lime:color.red
//plotcandle(O,H,L,C,color=col2b)
//plot(H, title="VWAP", color=red)
//plot(L, title="VWAP", color=lime)
//plot(O, title="VWAP", color=blue)
//plot(C, title="VWAP", color=black)

//plot(NormalVwap, color=col2b)


/////////////////////////////////////////////////////////////////////////////


///Trade Conditions///
t = time(timeframe.period, "0930-1500")

long = vwaprsi > vwaprsi[1] and rsi>rsi[1] and vwaprsi < 20 //vwaprsi > 98 and rsi > 50 and rsi[1] < rsi and rsi[1] < rsi[2] //crossover(rsi,20)//O<C  and O > linreg(hlc3,100,0) and linreg(hlc3,100,0) > linreg(hlc3,100,0)[1] and AVGHL>AVGOC and t //O < C  and close > vwap(hlc3) and ADX > ADX[1]  //and val > nz(val[1]) and close > vwap(hlc3) and open > sma(close,23) and close > vwap(hlc3)  and t  //and rsi > rsi[1] and open > ema(close,13) and open > bfr and bfr > bfr[1]
close_long = crossover(vwaprsi,99.8)  //C < O // linreg(hlc3,100,0) and linreg(hlc3,100,0) < linreg(hlc3,100,0)[1] //O > C and val < nz(val[1]) // and close < vwap(hlc3)
close_short = rsiv > rsiv[1] and rsiv[2] > rsiv[1]//vwaprsi > vwaprsi[1] or rsi > rsi[1] // vwaprsi > 99 and rsi > 99 and rsi > rsi[1] and vwaprsi > vwaprsi[1]//vwaprsi > vwaprsi[1] and rsi>rsi[1] and vwaprsi < 20 //vwaprsi > 98 and rsi > 50 and rsi[1] < rsi and rsi[1] < rsi[2] //crossover(rsi,20)//O<C  and O > linreg(hlc3,100,0) and linreg(hlc3,100,0) > linreg(hlc3,100,0)[1] and AVGHL>AVGOC and t //O < C  and close > vwap(hlc3) and ADX > ADX[1]  //and val > nz(val[1]) and close > vwap(hlc3) and open > sma(close,23) and close > vwap(hlc3)  and t  //and rsi > rsi[1] and open > ema(close,13) and open > bfr and bfr > bfr[1]
short = rsiv > 95 and rsiv < rsiv[1] and rsiv[2] < rsiv[1] //vwaprsi < 1 and rsi < 1 and rsi < rsi[1] and vwaprsi < vwaprsi[1] and t //crossover(vwaprsi,99.8)  //C < O // linreg(hlc3,100,0) and linreg(hlc3,100,0) < linreg(hlc3,100,0)[1] //O > C and val < nz(val[1]) // and close < vwap(hlc3)

//long = vwaprsi > vwaprsi[1] and emarsi > emarsi[1] and emarsi[2] > emarsi[1] and ADX > 25//O<C  and O > linreg(hlc3,100,0) and linreg(hlc3,100,0) > linreg(hlc3,100,0)[1] and AVGHL>AVGOC and t //O < C  and close > vwap(hlc3) and ADX > ADX[1]  //and val > nz(val[1]) and close > vwap(hlc3) and open > sma(close,23) and close > vwap(hlc3)  and t  //and rsi > rsi[1] and open > ema(close,13) and open > bfr and bfr > bfr[1]
//close_long = vwaprsi < vwaprsi[1] or emarsi < emarsi[1]//C < O // linreg(hlc3,100,0) and linreg(hlc3,100,0) < linreg(hlc3,100,0)[1] //O > C and val < nz(val[1]) // and close < vwap(hlc3)
//close_long = O>C  or lsma1 < H  //  or O > linreg(hlc3,100,0) //and linreg(hlc3,100,0) > linreg(hlc3,100,0)[1] and AVGHL>AVGOC and t //O < C  and close > vwap(hlc3) and ADX > ADX[1]  //and val > nz(val[1]) and close > vwap(hlc3) and open > sma(close,23) and close > vwap(hlc3)  and t  //and rsi > rsi[1] and open > ema(close,13) and open > bfr and bfr > bfr[1]
//long = rsi > rsi[1] and rsi[1] >rsi[2] and lsma1 > lsma1[1] and bfr > bfr[1] and O<C and lsma1 > L  and close > close[1] and ADX > ADX[1] and ADX[1] > ADX[2] and ADX > 20 and rsi > rsi[1] and t   // linreg(hlc3,100,0) and linreg(hlc3,100,0) < linreg(hlc3,100,0)[1] //O > C and val < nz(val[1]) // and close < vwap(hlc3)

//close_short = O<C  or lsma1 > H  //  or O > linreg(hlc3,100,0) //and linreg(hlc3,100,0) > linreg(hlc3,100,0)[1] and AVGHL>AVGOC and t //O < C  and close > vwap(hlc3) and ADX > ADX[1]  //and val > nz(val[1]) and close > vwap(hlc3) and open > sma(close,23) and close > vwap(hlc3)  and t  //and rsi > rsi[1] and open > ema(close,13) and open > bfr and bfr > bfr[1]
//short = rsi < rsi[1] and rsi[1] <rsi[2] and lsma1 < lsma1[1] and bfr < bfr[1] and O>C and lsma1 < L  and close < close[1] and ADX > ADX[1] and ADX[1] > ADX[2] and ADX > 20 and rsi < rsi[1] and t   // linreg(hlc3,100,0) and linreg(hlc3,100,0) < linreg(hlc3,100,0)[1] //O > C and val < nz(val[1]) // and close < vwap(hlc3)


/// Start date
startDate = input(title="Start Date", defval=1, minval=1, maxval=31)
startMonth = input(title="Start Month", defval=1, minval=1, maxval=12)
startYear = input(title="Start Year", defval=2021, minval=1800, maxval=2100)


// See if this bar's time happened on/after start date
afterStartDate = true


///Entries and Exits//
if (long and afterStartDate)
    strategy.entry("Long", strategy.long, comment = "Open Long")
//    strategy.close("Short", strategy.short,qty_percent=100, comment = "close Short")
if (short and afterStartDate)
    strategy.entry("Short", strategy.short, comment = "Open Short")


if (close_long and afterStartDate  )
    strategy.close("Long", strategy.long, qty_percent=100, comment="close Long")
//    strategy.entry("Short", strategy.short, comment="Open Short")

if (close_short and afterStartDate  )
    strategy.close("Short", strategy.short, qty_percent=100, comment="close Long")

if ( hour(time) == 15 and minute(time) > 15 )
    strategy.close_all()


//Submit exit orders based on take profit price
if (strategy.position_size > 0 and afterStartDate)
    strategy.exit(id="Long", qty_percent=tp, limit=longExitPrice)

if (strategy.position_size < 0 and afterStartDate)
    strategy.exit(id="Short", qty_percent=tp, limit=shortExitPrice)