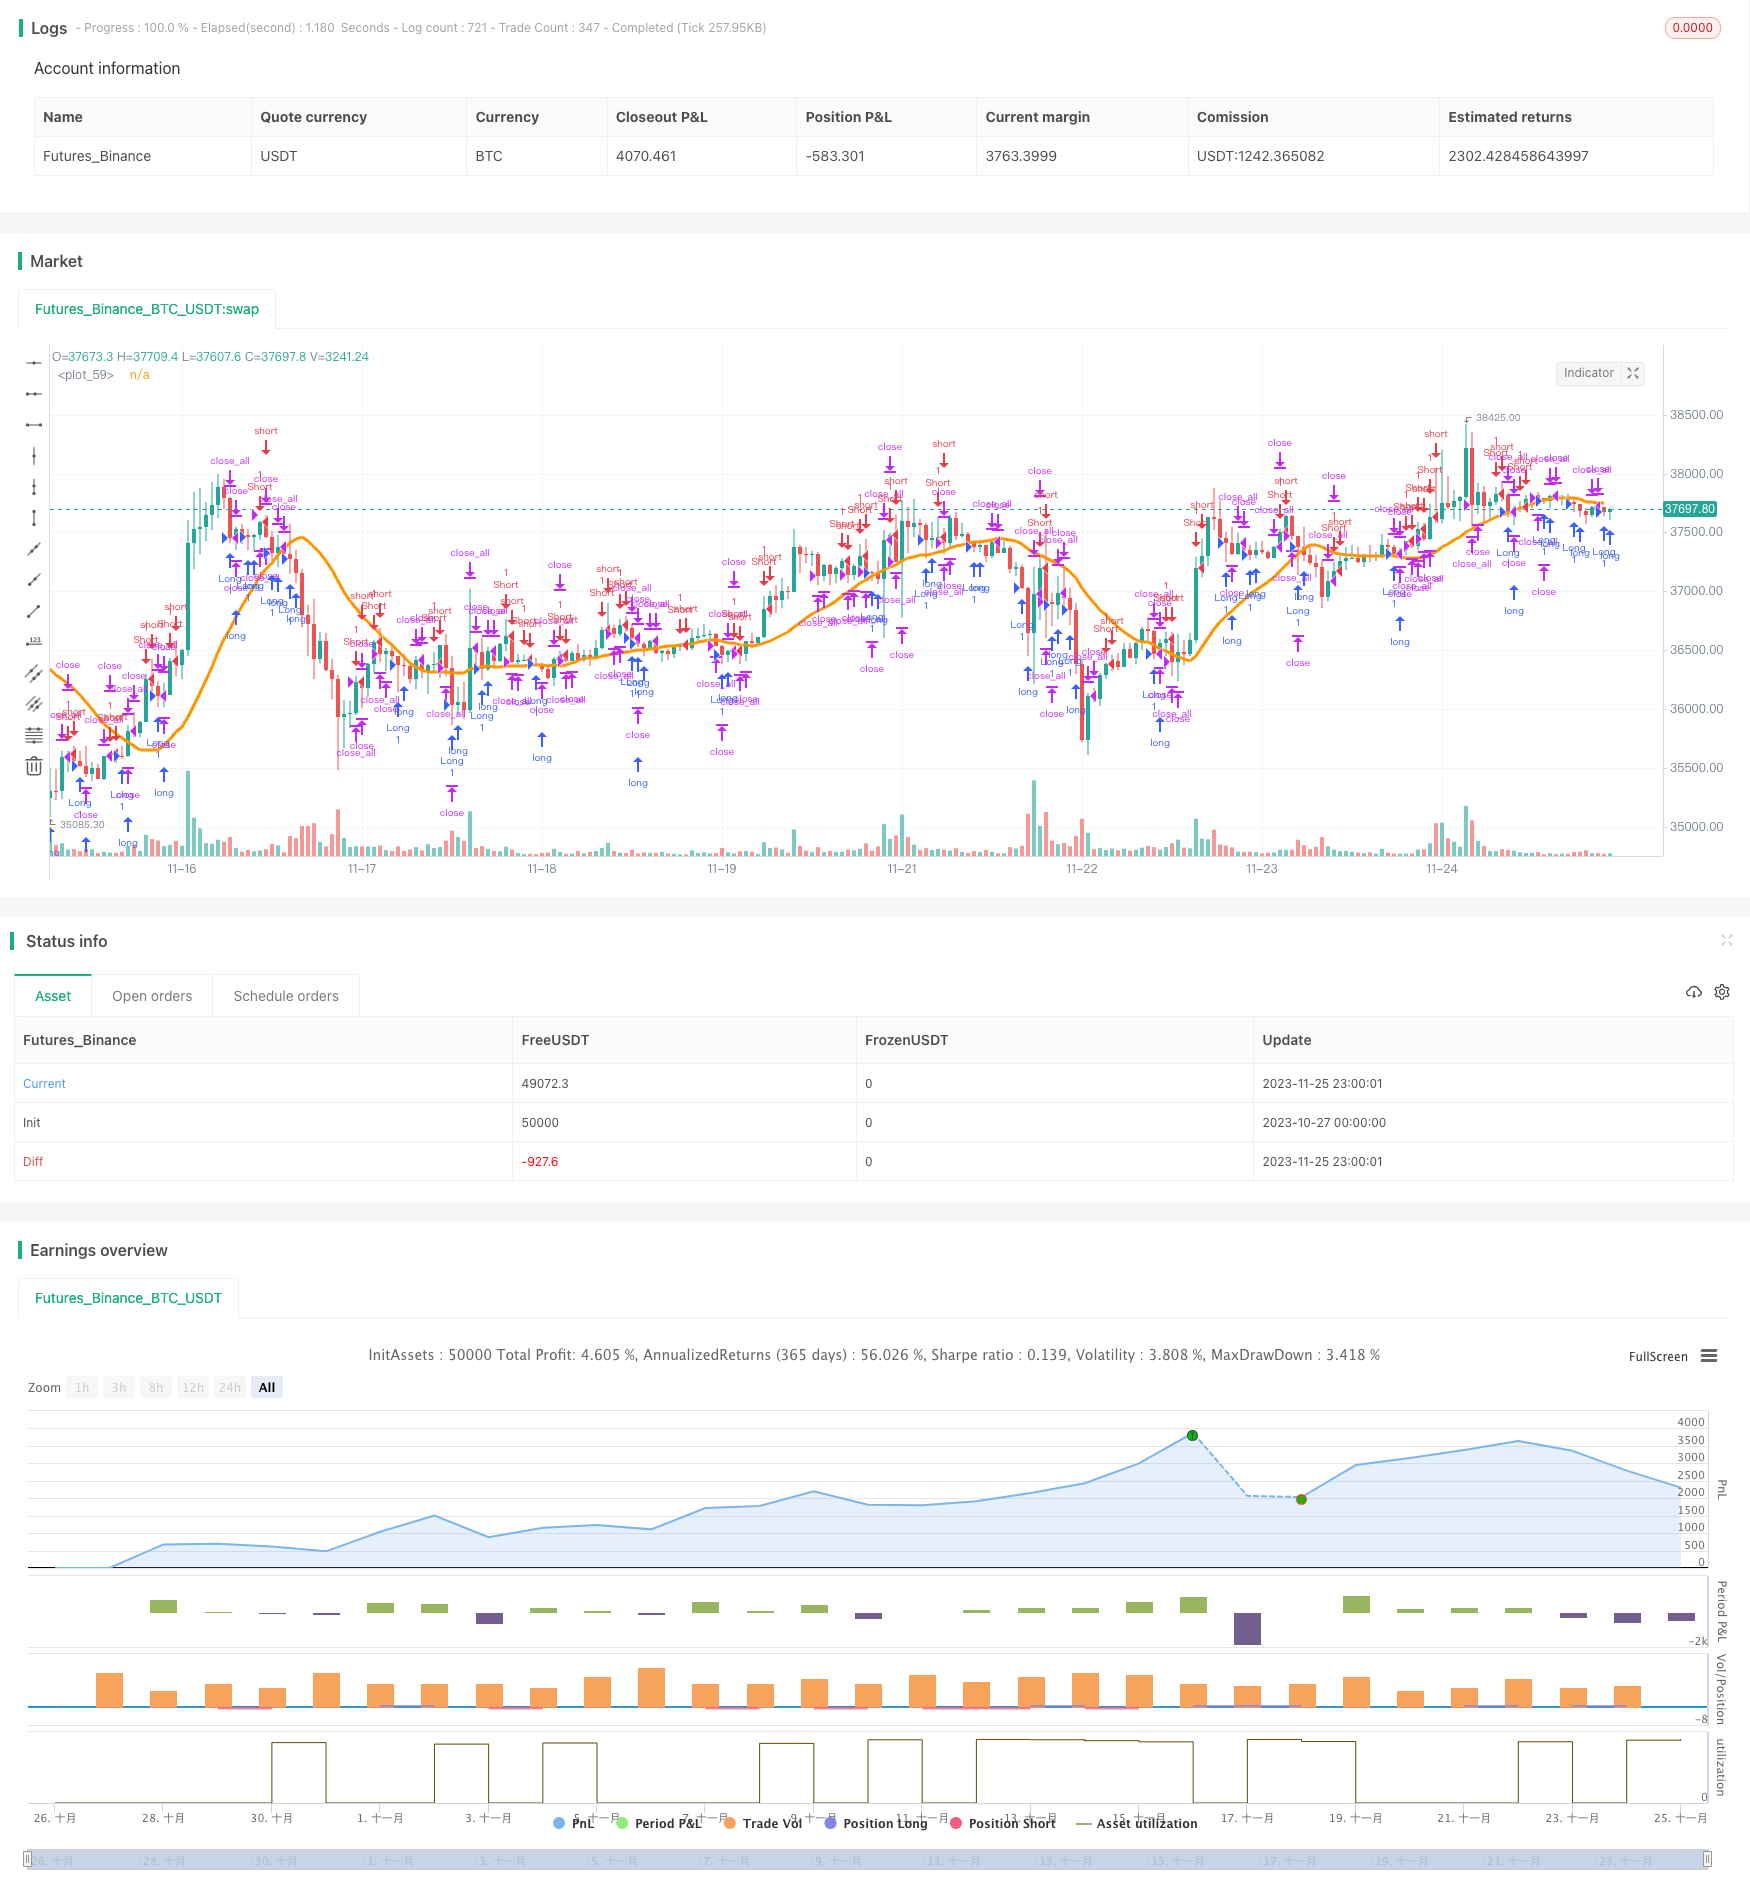
仮想通貨のRSIギャップ・トレーディング戦略
作者: リン・ハーンチャオチャン, 日付: 2023-11-27 11:22:19タグ:

概要: これは仮想通貨市場向けに設計された高速RSIギャップトレーディング戦略である.これは,高速RSI指標とキャンドルスティックチャート上のギャップパターンの両方を活用して取引機会を特定する.
原則 この戦略は,2つの主要技術を使用します. 急速なRSI指標とギャップパターンです.
RSIの上限は70で,下限は30で設定されている.70を超えると過買い,30を下回ると過売りとみなされる.
2つ目は,キャンドルストックチャート上のギャップパターンを検出する.ギャップは,現在の開盤価格と前の閉盤価格の間の空白を意味します.ギャップは高い変動と潜在的なトレンド逆転を意味します.
急速なRSIが過売り状態を示している間にダウンギャップが現れると,ロングに行く.高速なRSIが過買い状態を示している間にアップギャップが現れると,ショートに行く.
さらに,この戦略は,誤った信号を避けるために,SMAおよびMin/Maxインジケーターを含む他のフィルターを利用します.フィルターを通過するときにのみ,実際の取引信号が起動します.
利点: この戦略の最大の利点は,超高速のオーバーバイト/オーバーセールターンとギャップ逆転の機会を捉えることです.特に不安定な暗号市場では,急速なトレンドシフトを把握するのに適しています.通常のRSIと比較して,高速RSIは暗号取引の高周波性に合わせてはるかに早く反応します.追加のフィルターは偽信号を削除し信頼性を向上させます.
リスク:
戦略が直面する主なリスクは以下のとおりである.
-
速度のRSIは過度に敏感で 過剰な誤った信号を引き起こす可能性があります
-
ギャップは,実際の逆転ではなく,通常の価格変動だけかもしれません. 戦略はストップ・ロスのリスクを冒します.
-
低変動期間の間,ポジションは長期間に渡って無効に保たれる.
-
誤ったパラメータ設定は,信号の薄めと低効率につながる可能性があります.
したがって,次の方法が上記のリスクを軽減するのに役立ちます.
-
快速RSIパラメータを調整し RSI期間を増加させれば 敏感度が低下します
-
ダイナミックストップロスを適用して 利益を固定します ギャップピークを追いかけるのを避けます
-
戦略参加率を最適化し 変動が低い環境での参加を制限する
-
安定した設定を保証するために パラメータを継続的にバックテストして最適化します
強化: 主な最適化方向は以下の通りである.
-
MACD,KDJなどの指標を 探求し ギャップを組み合わせて 精度を高めましょう
-
市場変動に基づいて 適応性のあるストップ・ロスのメカニズムを構築する.
-
OBVのようなボリュームインジケーターを組み込み ギャップの後に逆転を確認します
-
フィルターパラメータを最適化して 最低/最大周期を設定して 誤信号を減らすことができます
-
異なる暗号資産のパラメータの適応性を研究します
これらの取り組みは,戦略の安定性,適応性,信頼性を著しく向上させる可能性があります.
結論は 要するに,急速なRSIギャップトレーディング戦略は,不安定な暗号市場のために明確に設計された効率的なアプローチです.継続的なテストと改善により,迅速な市場の逆転を信頼的に捉え,一貫した収益性を達成する可能性があります.
/*backtest
start: 2023-10-27 00:00:00
end: 2023-11-26 00:00:00
period: 1h
basePeriod: 15m
exchanges: [{"eid":"Futures_Binance","currency":"BTC_USDT"}]
*/

//Noro
//2018

//@version=3
strategy(title = "Noro's Fast RSI Strategy v1.5", shorttitle = "Fast RSI str 1.5", overlay = true)

//Settings
needlong = input(true, defval = true, title = "Long")
needshort = input(true, defval = true, title = "Short")
usersi = input(true, defval = true, title = "Use Fast RSI Strategy")
usemm = input(true, defval = true, title = "Use Min/Max Strategy")
usesma = input(false, defval = false, title = "Use SMA Filter")
smaperiod = input(20, defval = 20, minval = 2, maxval = 1000, title = "SMA Filter Period")
fast = input(7, defval = 7, minval = 2, maxval = 50, title = "Fast RSI Period")
limit = input(30, defval = 30, minval = 1, maxval = 100, title = "RSI limit")
rsisrc = input(close, defval = close, title = "RSI Price")
rsibars = input(1, defval = 1, minval = 1, maxval = 20, title = "RSI Bars")
mmbars = input(1, defval = 1, minval = 1, maxval = 5, title = "Min/Max Bars")
showsma = input(false, defval = false, title = "Show SMA Filter")
showarr = input(false, defval = false, title = "Show Arrows")
fromyear = input(2018, defval = 2018, minval = 1900, maxval = 2100, title = "From Year")
toyear = input(2100, defval = 2100, minval = 1900, maxval = 2100, title = "To Year")
frommonth = input(01, defval = 01, minval = 01, maxval = 12, title = "From Month")
tomonth = input(12, defval = 12, minval = 01, maxval = 12, title = "To Month")
fromday = input(01, defval = 01, minval = 01, maxval = 31, title = "From day")
today = input(31, defval = 31, minval = 01, maxval = 31, title = "To day")

//Fast RSI
fastup = rma(max(change(rsisrc), 0), fast)
fastdown = rma(-min(change(rsisrc), 0), fast)
fastrsi = fastdown == 0 ? 100 : fastup == 0 ? 0 : 100 - (100 / (1 + fastup / fastdown))

//Limits
bar = close > open ? 1 : close < open ? -1 : 0
uplimit = 100 - limit
dnlimit = limit

//RSI Bars
upsignal = fastrsi > uplimit ? 1 : 0
dnsignal = fastrsi < dnlimit ? 1 : 0
uprsi = sma(upsignal, rsibars) == 1
dnrsi = sma(dnsignal, rsibars) == 1

//Body
body = abs(close - open)
abody = sma(body, 10)

//MinMax Bars
min = min(close, open)
max = max(close, open)
minsignal = min < min[1] and bar == -1 and bar[1] == -1 ? 1 : 0
maxsignal = max > max[1] and bar == 1 and bar[1] == 1 ? 1 : 0
mins = sma(minsignal, mmbars) == 1
maxs = sma(maxsignal, mmbars) == 1

//SMA Filter
sma = sma(close, smaperiod)
colorsma = showsma ? blue : na
plot(sma, color = colorsma, linewidth = 3)

//Signals
up1 = bar == -1 and (strategy.position_size == 0 or close < strategy.position_avg_price) and dnrsi and body > abody / 5 and usersi
dn1 = bar == 1 and (strategy.position_size == 0 or close > strategy.position_avg_price) and uprsi and body > abody / 5 and usersi
up2 = mins and (close > sma or usesma == false) and fastrsi < 70 and usemm
dn2 = maxs and (close < sma or usesma == false) and fastrsi > 30 and usemm
exit = ((strategy.position_size > 0 and fastrsi > dnlimit and bar == 1) or (strategy.position_size < 0 and fastrsi < uplimit and bar == -1)) and body > abody / 2

//Arrows
col = exit ? black : up1 or dn1 ? blue : up2 or dn2 ? red : na
needup = up1 or up2
needdn = dn1 or dn2
needexitup = exit and strategy.position_size < 0
needexitdn = exit and strategy.position_size > 0
plotarrow(showarr and needup ? 1 : na, colorup = blue, colordown = blue, transp = 0)
plotarrow(showarr and needdn ? -1 : na, colorup = blue, colordown = blue, transp = 0)
plotarrow(showarr and needexitup ? 1 : na, colorup = black, colordown = black, transp = 0)
plotarrow(showarr and needexitdn ? -1 : na, colorup = black, colordown = black, transp = 0)

//Trading
if up1 or up2
    strategy.entry("Long", strategy.long, needlong == false ? 0 : na, when=(time > timestamp(fromyear, frommonth, fromday, 00, 00) and time < timestamp(toyear, tomonth, today, 23, 59)))

if dn1 or dn2
    strategy.entry("Short", strategy.short, needshort == false ? 0 : na, when=(time > timestamp(fromyear, frommonth, fromday, 00, 00) and time < timestamp(toyear, tomonth, today, 23, 59)))

if time > timestamp(toyear, tomonth, today, 23, 59) or exit
    strategy.close_all()
- 高低ブレイカーバックテスト戦略
- 二重移動平均のクロスオーバー取引戦略
- EMA指標に基づくトレンド追跡フラグパターン戦略
- アルファトレンドストラテジー
- イチモク混合均衡表 マクドとチー統合戦略
- 価格動向追跡ストップ損失戦略
- 価格チャネルによって導かれる価格逆転戦略
- KST指標 利益戦略
- ダイナミック・双方向追加位置戦略
- 相対強度指数 フラット逆転戦略
- KDJ RSI クロスオーバー 買い売るシグナル戦略
- イチモク バックテスト TP,SL,クラウド 確認
- 複数の時間枠と平均振幅に基づいたジロスコピー帯戦略
- 2つの移動平均のクロスオーバー逆転戦略
- 動的移動平均を追跡する戦略
- 逆転捕獲戦略
- RSIギャップの逆転戦略
- 3分間の短い専門家アドバイザー戦略
- アクションゾーン ATR リバースオーダー 量子戦略
- MACD トレンド 戦略をフォローする