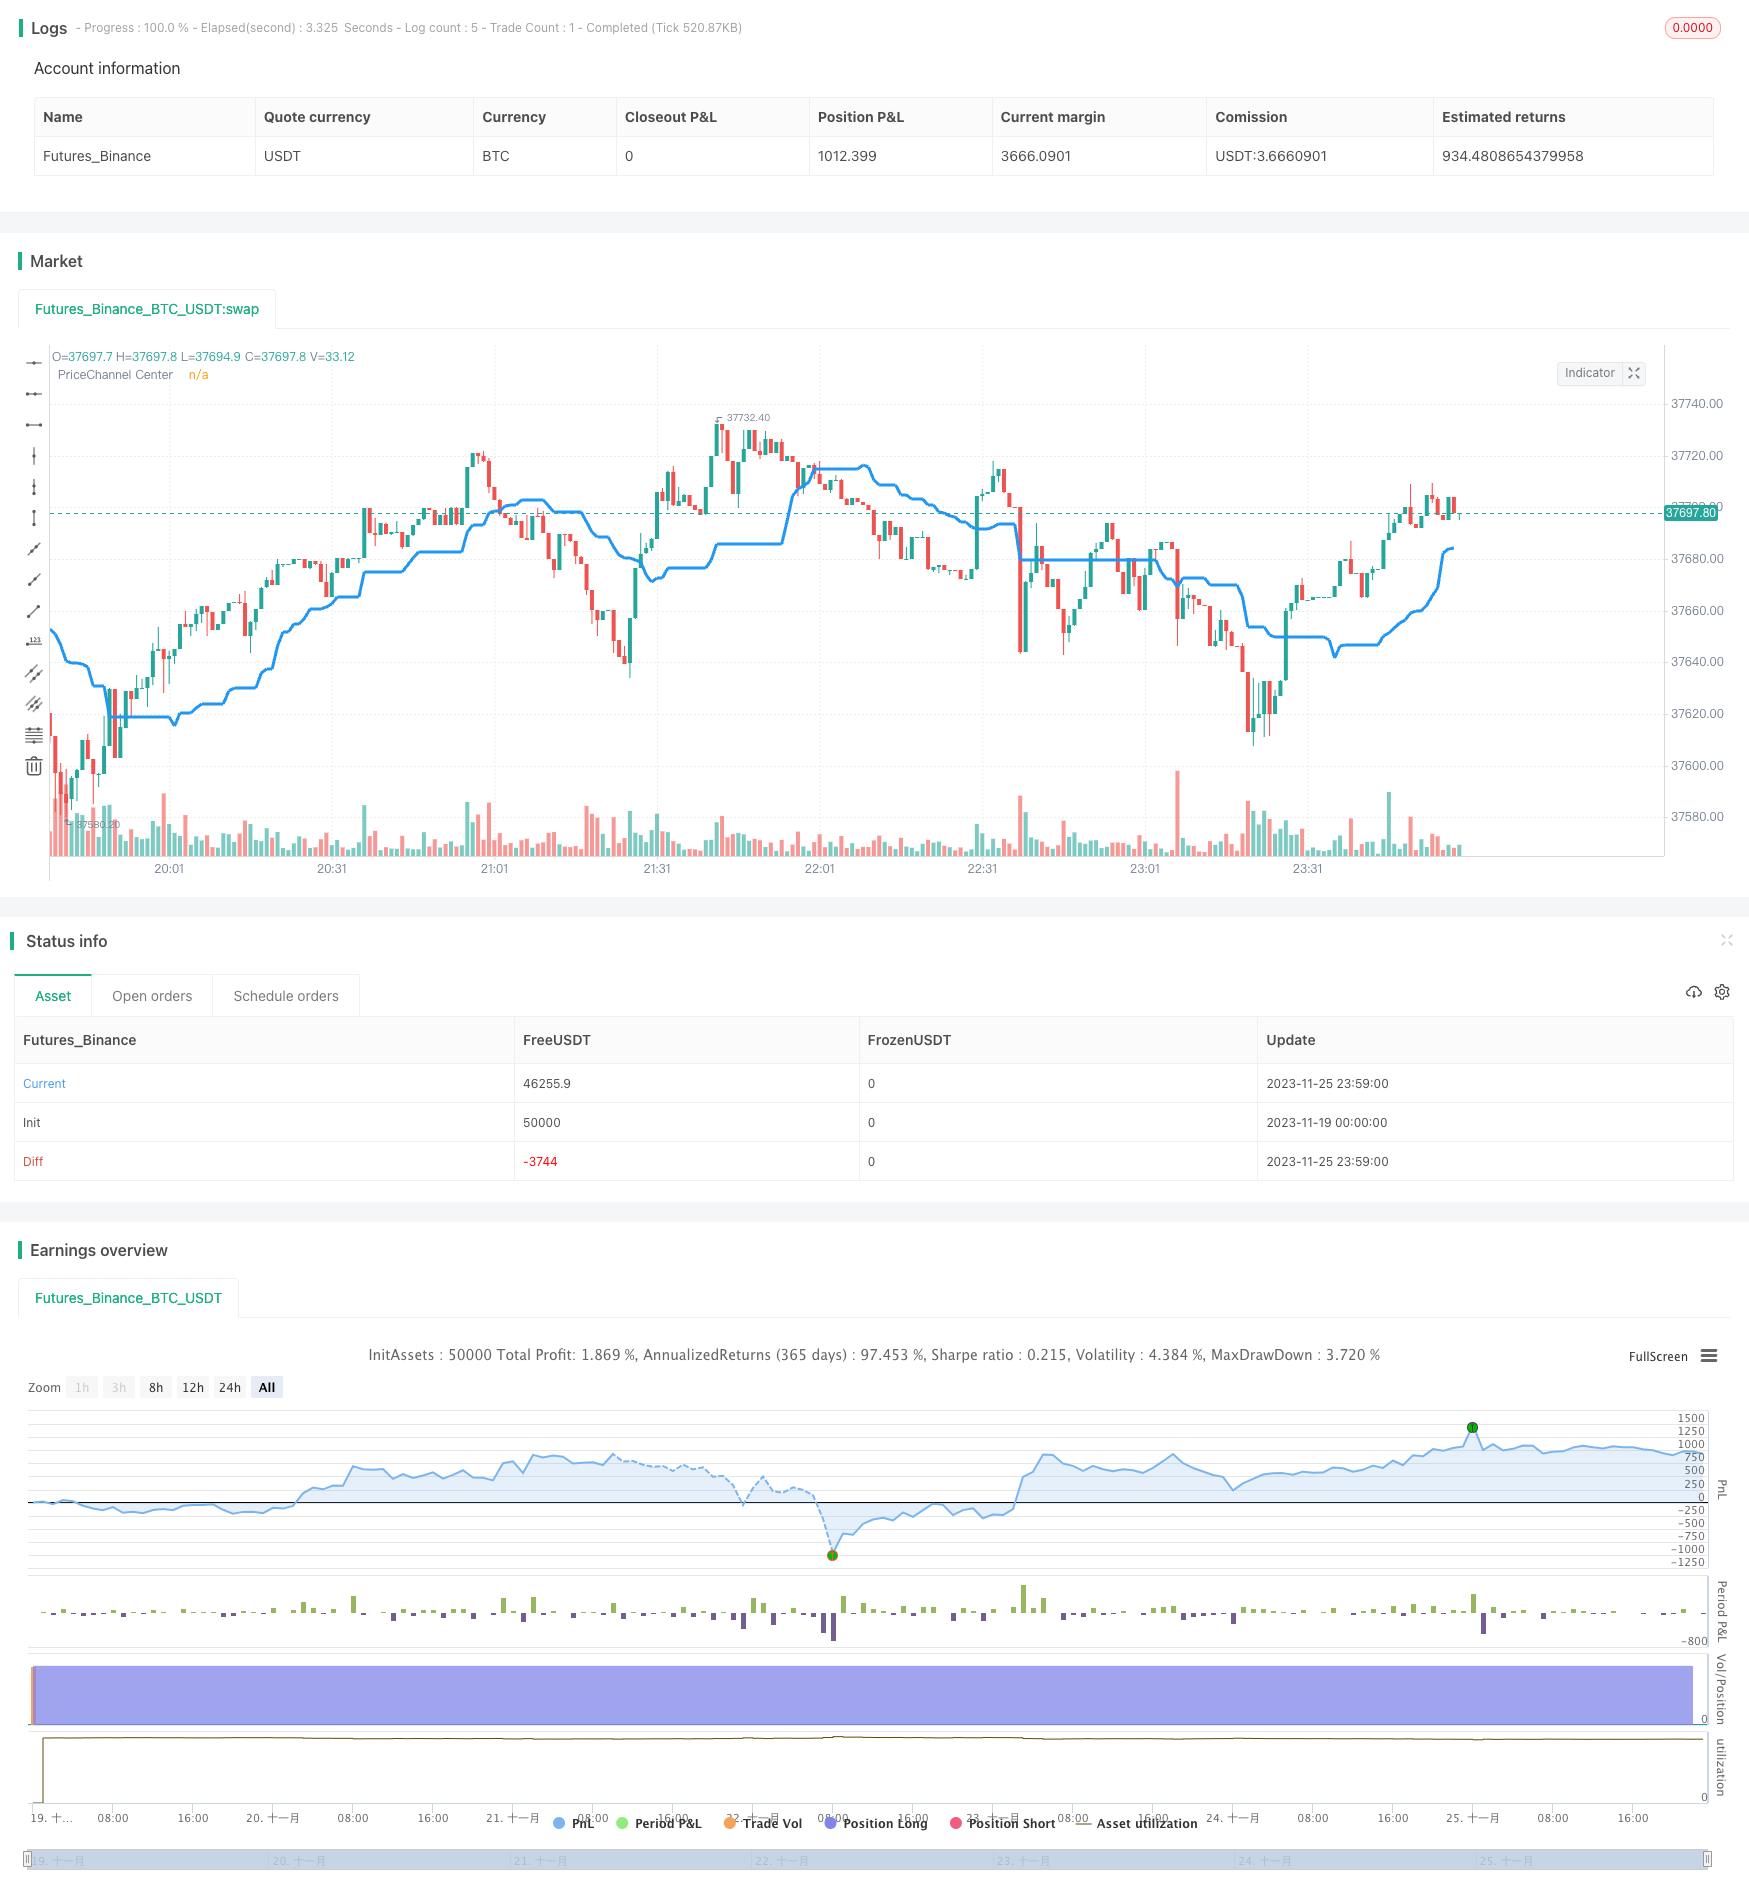
価格チャネルによって導かれる価格逆転戦略
作者: リン・ハーンチャオチャン,日付: 2023年11月27日 11:40:36タグ:

概要
価格チャネルによって導かれる価格逆転戦略は,価格チャネルの中央線を計算して価格変動の傾向方向を決定する.価格がチャネルの中央線に近づくと,長短信号を生成する.この戦略は,複数のフィルター条件を組み合わせて,高い確率の取引機会を探します.
戦略の論理
この戦略のコア指標は価格チャネルの中央線である.最近30のキャンドルスタイルの最高価格と最低価格の平均値として計算される.低値が中央線よりも高くなった場合,上昇傾向とみなされる.高値が中央線よりも低くなった場合,下落傾向とみなされる.
この戦略は,トレンドバックグラウンドが変化するときにのみ取引信号を生成する.つまり,上昇傾向背景では,キャンドルスティックが赤に変わるときにのみショートになります.下落傾向背景では,キャンドルスティックが緑に変わるときにのみロングになります.
さらに,この戦略は,ダブルフィルター条件も設定している:キャンドルスタイルのボディフィルターと価格チャネルバーフィルター.キャンドルスタイルのボディボリュームが平均値の20%を超える場合にのみシグナルがトリガーされ,シグナルをオープンするにはフィルターサイクル内で連続したトレンド信号が必要である.
利点分析
この戦略は,トレンド,値エリア,キャンドルスタイクパターンを組み合わせ,効率的な逆転取引戦略です.主な利点は:
- 価格チャネルを使用して主要トレンドを決定し,レンジバインド市場によって誤導されないようにします.
- 価格チャネルの中央線に近い価格レベルを選択します これは典型的な低買い高売りエリアです
- キャンドルスタイクボディとチャネルバーフィルターは信号の質を高め 偽信号率を低下させます
- 高値を追いかけて低値を売るのを避けるために 明らかな逆転点でのみ ポジションを開きます
リスク と 解決策
この戦略の主なリスクは,価格の逆転点が欠落し,信号を不必要に待つことにある.この戦略は,次の方法で最適化することができます:
- フィルター条件の厳格さを調整し,欠けている取引を減らすためにフィルタリング基準を削減します.
- トレンド逆転の初期段階でのポジションサイズを拡大し,トレンド利益を把握する.
- 信号強さを判断するために他の指標を組み合わせ,フィルターに手動で介入します.
オプティマイゼーションの方向性
この戦略は,次の側面で最適化できます.
- 価格チャネル期間,チャネルバーの数などのパラメータを最適化します
- ストップ・ロスの戦略を追加して ストップ・ロスは一定パーセントに達するとします
- トレーディングボリュームを組み合わせてフィルター強度に干渉します.例えば,取引ボリュームが増強するとフィルタを緩和します.
- 単純なフィルターを入れ替えて 傾向の逆転の可能性を判断する 機械学習モデルを追加します
結論
価格チャネルによって導かれる価格逆転戦略は,価格チャネルを通じて逆転点を決定し,高品質のシグナルを生成するためにダブルフィルター条件を設定する.パラメータ調整とリスク管理に基づいて,信頼性の高い定量戦略である.
/*backtest
start: 2023-11-19 00:00:00
end: 2023-11-26 00:00:00
period: 1m
basePeriod: 1m
exchanges: [{"eid":"Futures_Binance","currency":"BTC_USDT"}]
*/

//Noro
//2018

//@version=2
strategy(title = "Noro's PriceChannel for D1 v1.0", shorttitle = "PriceChannel D1", overlay = true, default_qty_type = strategy.percent_of_equity, default_qty_value = 100.0, pyramiding = 0)

//Settings
needlong = input(true, "long")
needshort = input(true, "short")
slowlen = input(30, defval = 30, minval = 2, maxval = 200, title = "PriceChannel Period")
pcbars = input(1, defval = 1, minval = 1, maxval = 20, title = "PriceChannel Bars")
usecol = input(true, "Use color-filter")
usebod = input(true, "Use body-filter")
needbg = input(false, defval = false, title = "Need trend Background?")
fromyear = input(1900, defval = 1900, minval = 1900, maxval = 2100, title = "From Year")
toyear = input(2100, defval = 2100, minval = 1900, maxval = 2100, title = "To Year")
frommonth = input(01, defval = 01, minval = 01, maxval = 12, title = "From Month")
tomonth = input(12, defval = 12, minval = 01, maxval = 12, title = "To Month")
fromday = input(01, defval = 01, minval = 01, maxval = 31, title = "From day")
today = input(31, defval = 31, minval = 01, maxval = 31, title = "To day")

src = close

//PriceChannel
lasthigh = highest(src, slowlen)
lastlow = lowest(src, slowlen)
center = (lasthigh + lastlow) / 2

//Trend
ub = low > center ? 1 : 0
db = high < center ? 1 : 0
trend = sma(ub, pcbars) == 1 ? 1 : sma(db, pcbars) == 1 ? -1 : trend[1]

//Body
body = abs(close - open)
abody = sma(body, 10)

//Signals
up = trend == 1 and (close < open or usecol == false) and (body > abody / 5 or usebod == false)
dn = trend == -1 and (close > open or usecol == false) and (body > abody / 5 or usebod == false)

//Lines
plot(center, color = blue, linewidth = 3, transp = 0, title = "PriceChannel Center")

//Background
col = needbg == false ? na : trend == 1 ? lime : red
bgcolor(col, transp = 80)

//Trading
if up
    strategy.entry("Long", strategy.long, needlong == false ? 0 : na, when=(time > timestamp(fromyear, frommonth, fromday, 00, 00) and time < timestamp(toyear, tomonth, today, 23, 59)))

if dn
    strategy.entry("Short", strategy.short, needshort == false ? 0 : na, when=(time > timestamp(fromyear, frommonth, fromday, 00, 00) and time < timestamp(toyear, tomonth, today, 23, 59)))

if time > timestamp(toyear, tomonth, today, 23, 59)
    strategy.close_all()
もっと
- RSI インディケーターに基づく定量的な取引戦略
- 動向平均値に基づく戦略をフォローする傾向
- 4つの指標のモメンタム逆転戦略
- ロンドンMACD RSI ビットコイン取引戦略
- 高低ブレイカーバックテスト戦略
- 二重移動平均のクロスオーバー取引戦略
- EMA指標に基づくトレンド追跡フラグパターン戦略
- アルファトレンドストラテジー
- イチモク混合均衡表 マクドとチー統合戦略
- 価格動向追跡ストップ損失戦略
- KST指標 利益戦略
- ダイナミック・双方向追加位置戦略
- 相対強度指数 フラット逆転戦略
- 仮想通貨のRSIギャップ・トレーディング戦略
- KDJ RSI クロスオーバー 買い売るシグナル戦略
- イチモク バックテスト TP,SL,クラウド 確認
- 複数の時間枠と平均振幅に基づいたジロスコピー帯戦略
- 2つの移動平均のクロスオーバー逆転戦略
- 動的移動平均を追跡する戦略
- 逆転捕獲戦略