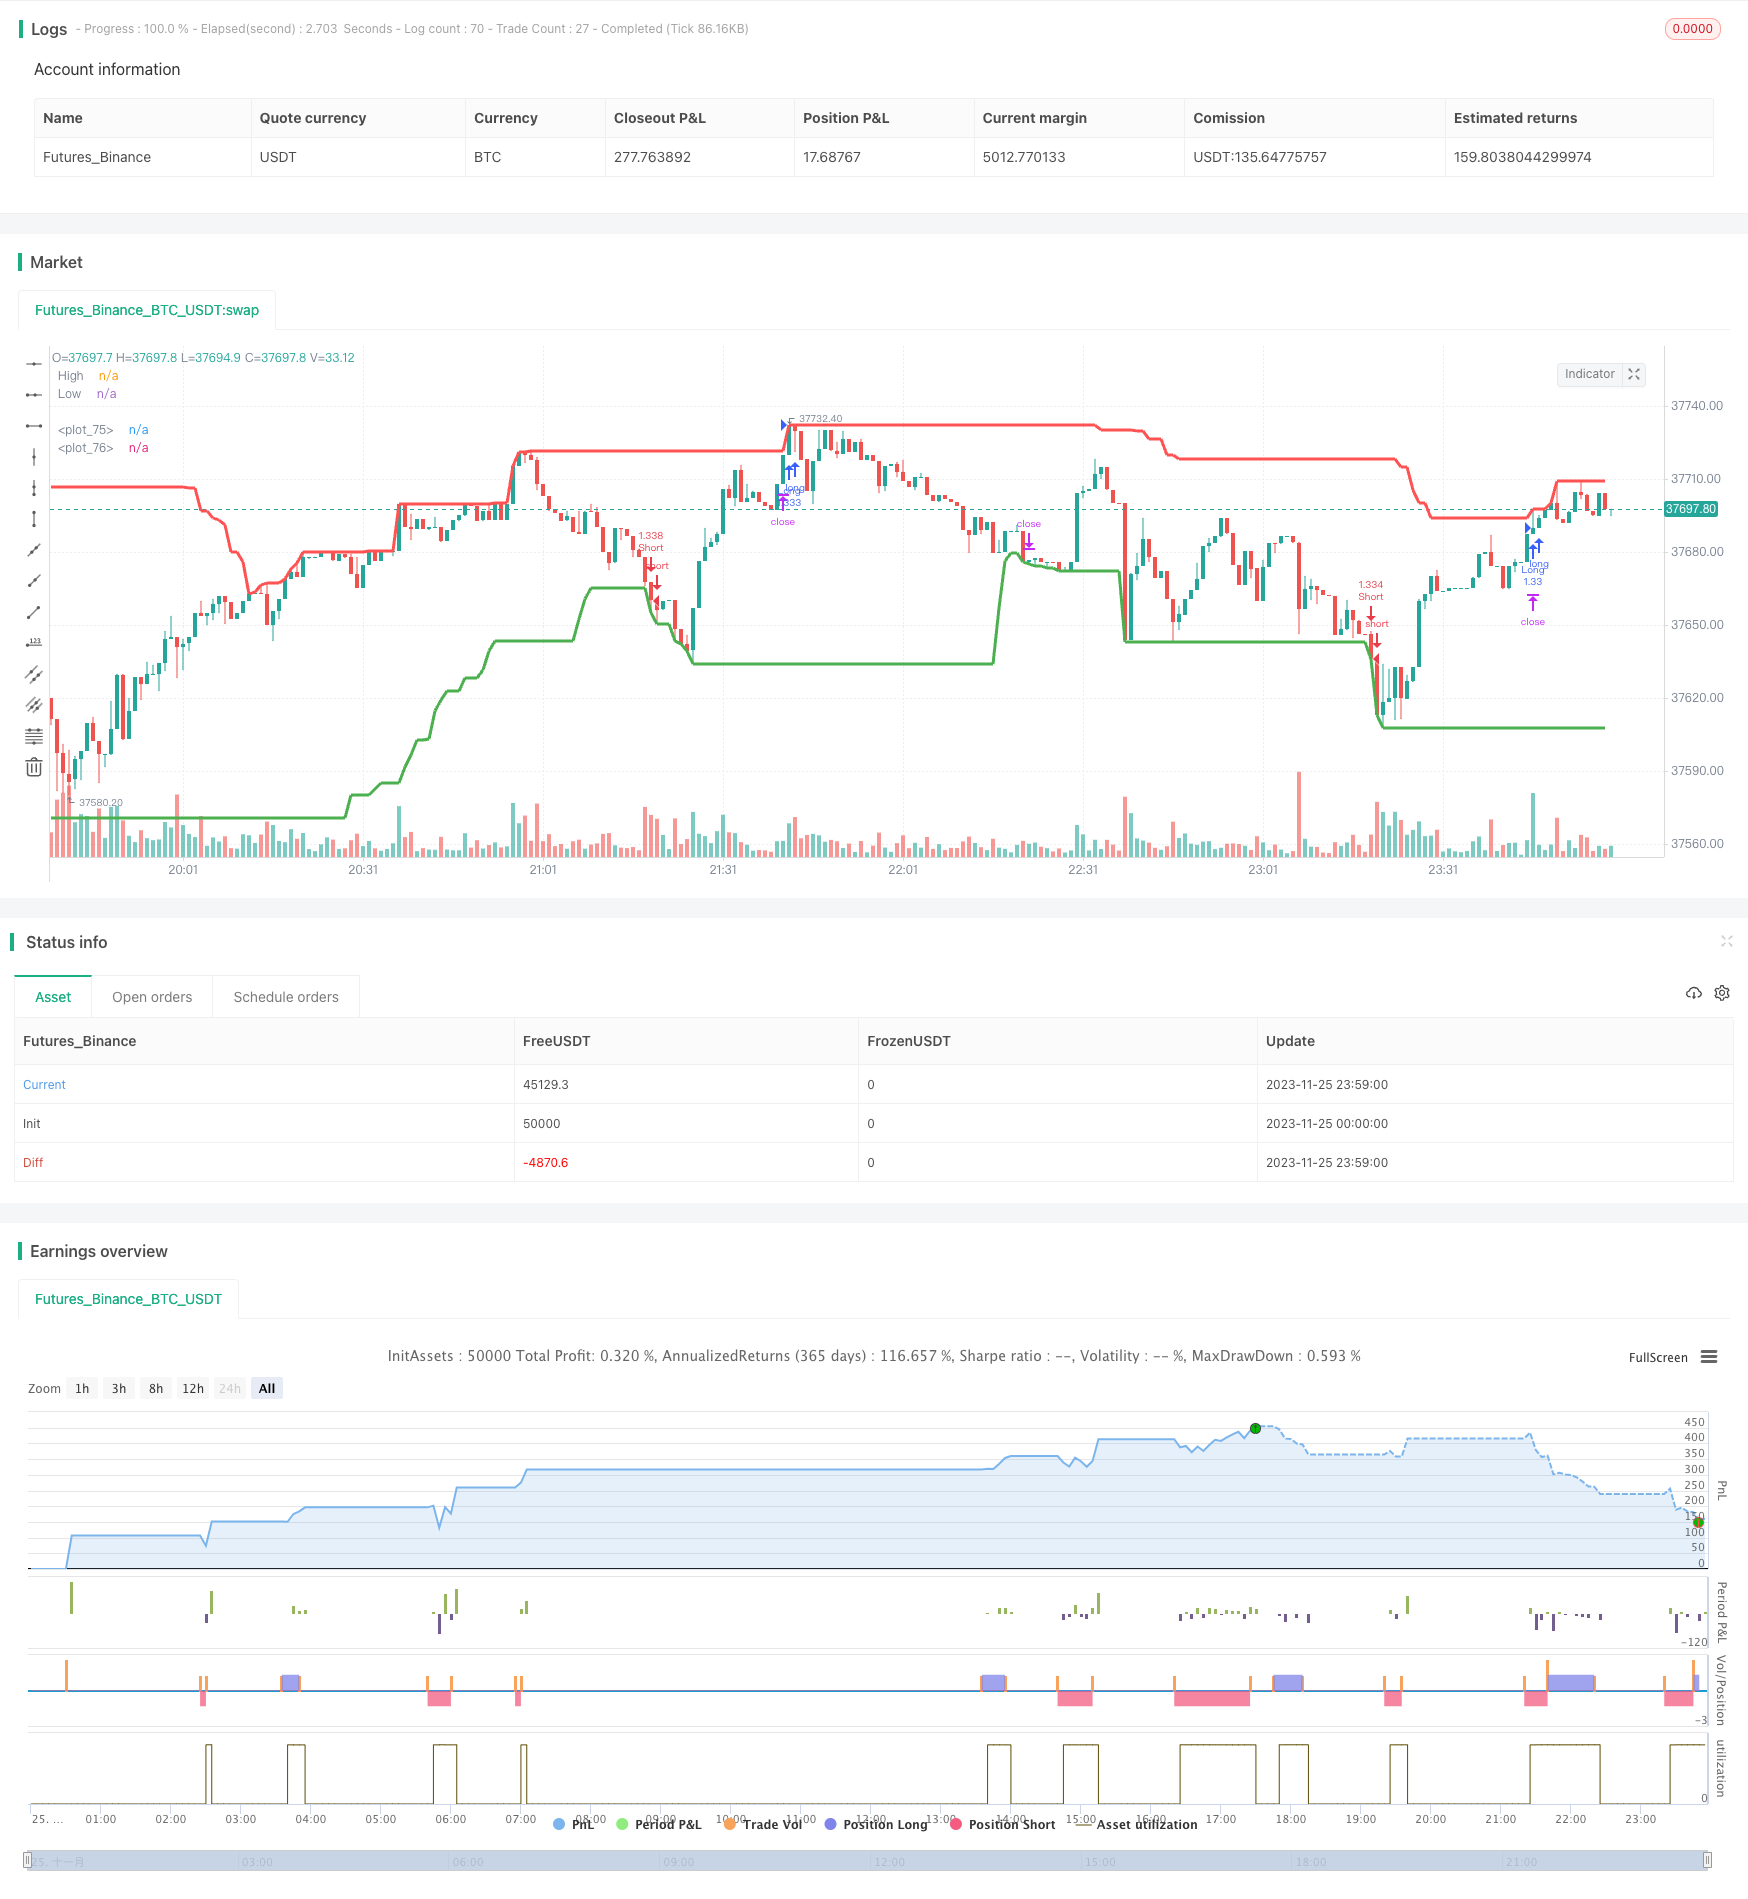
ハイローブレイクアウトバックテスト戦略

概要
高低突破反測戦略は,株式の歴史的高点と低点を利用して,価格がこれらの高低点を突破したかどうかを判断するトレンド追跡戦略である.それは,一定周期内の最高値と最低価格を計算することによって,現在の周期の価格が最近の一定周期の最高値を超えると買入シグナルを生成し,価格が最近の一定周期の最低値を下回ると売出を生成する.このシグナル戦略は,トレンド追跡戦略の一種であり,株式価格のトレンド特性を捉えることができ,実戦価値があります.
戦略原則
この戦略の核心的な論理は,特定の周期内における最高値と最低値の計算である.最高値と最低値の計算では,閉店価格または最高値と最低価格を使用する選択ができます. そして,現在のK線の閉店価格または最高値が,最近の一定周期内における最高値を超えているかどうかを判断し,もしそうなら,その上位の一定周期の最高値が既に存在している場合,購入信号を生成します. 同様に,現在のK線の閉店価格または最低値が,最近の一定周期内における最低価格より低いかどうかを判断し,その上位の一定周期の最低値が既に存在している場合,売却信号を生成します.
買取シグナルが生成されると,戦略は,その価格で買取し,ストップ・ロス・価格とストップ・プレイス・価格を設定する.価格がストップ・ロス・価格に触れたとき,戦略はストップ・ロスを退出する.価格がストップ・プレイス・価格に触れたとき,戦略はストップ・プレイス・価格を退出する.売り信号の論理も同様である。
優位分析
この高低ブレイク・バック・テスティング戦略には以下の利点があります.
- 戦略の論理はシンプルで,理解し,実行しやすい.
- 株価のトレンド特性を把握し,価格のトレンドに沿って動きます.
- Findingのパラメータを調整することで,最も適切な策略パラメータの組み合わせを調整できます.
- 危険を制御する内蔵の止損と停止装置
- 視覚化された表示は,パラメータ調整と結果分析を非常に便利にします.
リスク分析
この戦略にはいくつかのリスクがあります.
- 取引を繰り返したり,過剰に取引したりする傾向があります.
- 価格が揺れ動いている時,頻繁に取引を開始します.
- 予測値が適当でないと,大きなトレンドの機会を逃してしまうかもしれない.
- 株価の変動の頻度や幅を考慮していない.
- 信号は他の指標と組み合わせて検証されていません.
これらのリスクを制御するために,以下の方法で最適化できます.
- 適正にストップを縮小し,保有期間を延長する.
- ポジション開設条件を高め,頻繁に開設しないようにする.
- パラメータを最適化して,最適なパラメータの組み合わせを見つけます.
- 他の指標と組み合わせたフィルター信号.
最適化の方向
この高低突破反測戦略は,以下の点で最適化できます.
パラメータ最適化: 異なるパラメータの組み合わせをより体系的にテストすることで,最適なパラメータを見つけることができる.
他の指標と組み合わせたフィルタリング信号.例えば,移動平均指標と組み合わせた場合があり,価格が最高値を突破し,短期移動平均線が長期移動平均線を穿越したときにのみ買い信号が生成される.
株価の変動頻度を考慮する.例えば,ATR指標を組み合わせて,株価の変動が拡大したときに,突破の幅を適切に緩めることができる.
トレンド市と振動市を区別する. 傾向が明らかな段階では,トレンドを追跡するためにパラメータを適切に緩和する. 振動市場では,パラメータを適切に強化する.
ポジション管理機構を増やす.例えば,損失が一定比率に達したときにポジション開設を停止するなど.
要約する
全体として,高低突破反測戦略は,シンプルで実用的なトレンド追跡戦略である.価格が一定の周期内の最高値と最低値を突破したかどうかを判断することによって取引信号を決定する.この戦略は,シンプルで,トレンド追跡し,パラメータの最適化などの利点を有し,同時に,過剰な取引を生じ,振動市場などの処理できないリスクもあります.
/*backtest
start: 2023-11-25 00:00:00
end: 2023-11-26 00:00:00
period: 1m
basePeriod: 1m
exchanges: [{"eid":"Futures_Binance","currency":"BTC_USDT"}]
*/

//@version=3
strategy("High/Low Breaker Backtest 1.0", overlay=true, initial_capital=1000, default_qty_type=strategy.percent_of_equity, default_qty_value=100, max_bars_back=700)

// Strategy Settings
takeProfitPercentageLong = input(.1, title='Take Profit Percentage Long', type=float)/100
stopLossPercentageLong = input(0.15, title='Stop Loss Percentage Long', type=float)/100
takeProfitPercentageShort = input(.1, title='Take Profit Percentage Short', type=float)/100
stopLossPercentageShort = input(0.15, title='Stop Loss Percentage Short', type=float)/100


candlesBack = input(title="Number of candles back",  defval=50)
useHighAndLows =  input(true, title="Use high and lows (uncheck to use close)", defval=true)
lastBarsBackMinimum =  input(title="Number of candles back to ignore for last high/low",  defval=30)
showHighsAndLows = input(true, title="Show high/low lines", defval=true)

getIndexOfLowestInSeries(series, period) =>
    index = 0
    current = series
    for i = 1 to period
        if series[i] <= current
            index := i
            current := series[i]
    index

getIndexOfHighestInSeries(series, period) =>
    index = 0
    current = series
    for i = 1 to period
        if series[i] >= current
            index := i
            current := series[i]
    index

indexOfHighestInRange = getIndexOfHighestInSeries(useHighAndLows ? high : close, candlesBack)
indexOfLowestInRange = getIndexOfLowestInSeries(useHighAndLows ? low : close, candlesBack)

max = useHighAndLows ? high[indexOfHighestInRange] : close[indexOfHighestInRange]
min = useHighAndLows ? low[indexOfLowestInRange] : close[indexOfLowestInRange]

barsSinceLastHigh = indexOfHighestInRange
barsSinceLastLow = indexOfLowestInRange

isNewHigh = (useHighAndLows ? high > max[1] : close > max[1]) and (barsSinceLastHigh[1] + 1 > lastBarsBackMinimum)
isNewLow = (useHighAndLows ? low < min[1] : close < min[1]) and (barsSinceLastLow[1] + 1 > lastBarsBackMinimum)

alertcondition(condition=isNewHigh, title="New High", message="Last High Broken")
alertcondition(condition=isNewLow, title="New Low", message="Last Low Broken")

if high > max
    max := high
    barsSinceLastHigh := 0

if low < min
    min := low
    barsSinceLastLow := 0

plot( showHighsAndLows ? max : na, color=red, style=line, title="High", linewidth=3)
plot( showHighsAndLows ? min : na, color=green, style=line, title="Low", linewidth=3)

// Strategy Entry/Exit Logic
goLong =isNewHigh
longStopLevel = strategy.position_avg_price * (1 - stopLossPercentageLong)
longTakeProfitLevel = strategy.position_avg_price * (1 + takeProfitPercentageLong)

goShort = isNewLow
shortStopLevel = strategy.position_avg_price * (1 + stopLossPercentageShort)
shortTakeProfitLevel = strategy.position_avg_price * (1 - takeProfitPercentageShort)

strategy.entry("Long", strategy.long, when=goLong)
strategy.exit("Long Exit", "Long", stop=longStopLevel, limit=longTakeProfitLevel)

strategy.entry("Short", strategy.short, when=goShort)
strategy.exit("Short Exit", "Short", stop=shortStopLevel, limit=shortTakeProfitLevel)

plot(goShort ? shortStopLevel : na, color=yellow, style=linebr, linewidth=2)
plot(goShort ? shortTakeProfitLevel : na, color=blue, style=linebr, linewidth=2)
plot(goLong ? longStopLevel : na, color=yellow, style=linebr, linewidth=2)
plot(goLong ? longTakeProfitLevel : na, color=blue, style=linebr, linewidth=2)