デュアルインジケーターの組み合わせによるクレイジーな日中スキャルピング戦略

概要
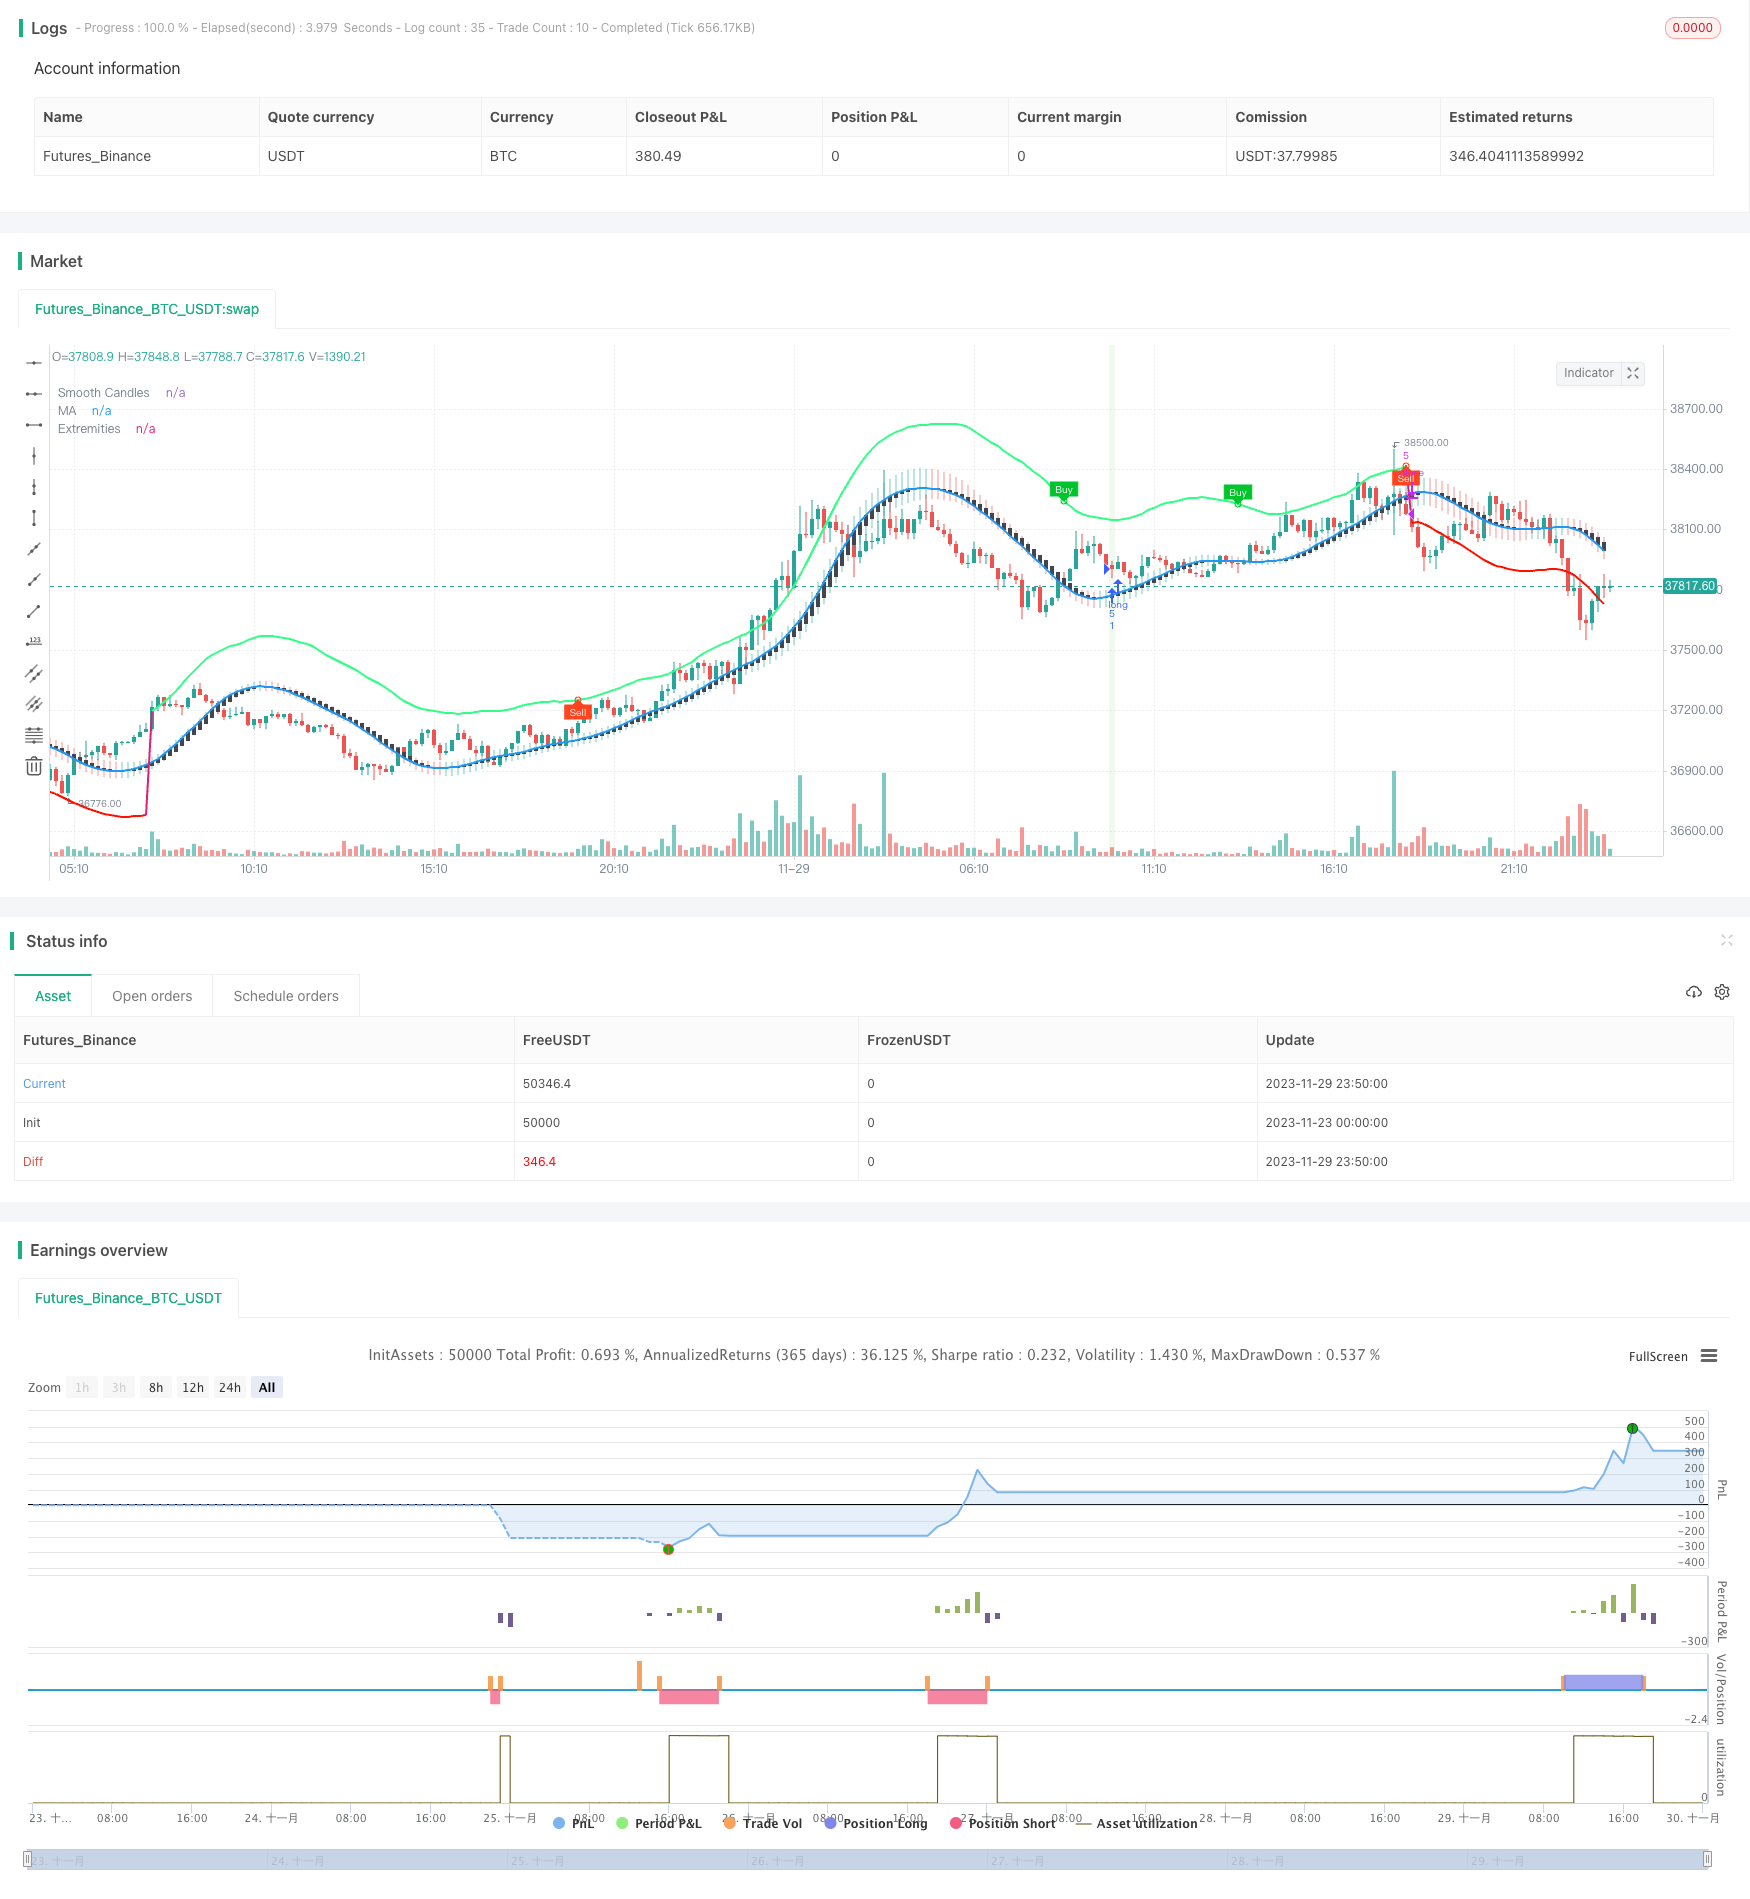
この戦略は,LuxAlgoが開発したTMOとAMAの2つの指標の買入シグナルを組み合わせて,振動的なリストラでトレンド開始の機会を捕捉する.これは,TMOの買入シグナル,AMAの買入ピーク値,K線実体量が徐々に拡大するなど,複数の条件を満たした後,多空を行う.止損方法は,最近のNK線の最高価格最低価格である.
戦略原則
TMO指標は価格の動きを反映する。それは震動指標のタイプであり,価格が逸脱した場合に取引信号を発する。AMA指標は平滑な移動平均指標である。それは価格の変動の範囲を示し,価格が上下軌道に近づくと超買い超売り現象を表す。
この戦略の主要な論理は,TMO指標は価格トレンドを反映して取引シグナルを提供し,AMA指標は価格が逆転する可能性のある領域を表示し,K線実体量と組み合わせてトレンドの開始を確認する.したがって,それらの組み合わせは取引の成功率を向上させる.具体的には,戦略は以下の状況でポジションを多めに開くか空白にする.
- TMO指数は,価格が上方から偏っているという多重シグナルで,AND AMA指数は,多重極値として現れます.
- TMO指数で空調信号が表示され,これは価格が下方へ逆転した,AND AMA指数で空調の極小値が表示された
- この3つのK線を要求する実体数が増加している.
このようにして,単一の指標によって引き起こされる偽信号の問題を解決します. ストップ・ロスは,最近のN根K線内の最高価格最低価格を選択し,リスクを比較的に制御できます.
戦略的優位性
この戦略には以下の利点があります.
指標の組み合わせにより,信号の正確性が向上する. TMO指標とAMA指標は相互検証し,偽信号を減少させ,信号の正確性が向上する.
複数の条件の組み合わせで,トレンドの始まりをキャプチャする.戦略が設定したTMO指数信号,AMA指数極値,K線実体量放大などの複数の条件により,トレンドの始まりのタイミングを効果的にキャプチャすることができる.これは,Scalping戦略が追求する目標である.
Kラインのストップ方式でリスクをコントロールする.Kラインの最近の最高価格最低価格をストップ方式として採用することで,各項のリスクを比較的によくコントロールできる.また,指標の再計算によって生じる遅れのリスクを逆転させない.
簡潔で有効な取引論理。この戦略は2つの指標だけで比較的に完全なScalping戦略を実現している.複雑ではなく,論理は簡潔で明確である。そして,例の結果から判断すると,戦略は良い収益を実現している。
戦略リスク
この戦略には以下のリスクがあります.
頻繁に入場リスクをとる.スカルピング戦略として,その保有期間は短く,取引費用が高い場合,利益に一定の影響を与える.
K線ストップは過激なリスクである. 最新の最高値の最低価格をストップ方法として採用すると,比較的激進になり,市場のノイズを完全にフィルターできず,ストップが誘発される確率は増加する.
パラメータ最適化の難しさのリスク. 策略は複数のパラメータを扱うため,最適なパラメータの組み合わせを見つけるのは困難である.
最適化の方向
この戦略は以下の方向から最適化できます.
市場取引量などのフィルタリング指標を追加することで,偽信号をフィルタリングでき,信号の質をさらに向上させることができます.
止損方法にフィルタリング条件を追加して,止損が過度に激しくならないようにする.例えば,止損をトリガーする前に数根のK線確認を待って,止損する.
パラメータ最適化を行い,指標のパラメータの最適な組み合わせを見つける.これは,より多くのノイズをフィルターして,戦略の勝利率を向上させる可能性がある.主に,TMO指標長さ,AMA指標長さ,倍数などのパラメータを最適化する.
戦略の論理に最も適合する取引品種と周期を見つけるために,異なる品種と時間周期で反転と实盘を試みる.
要約する
この戦略は,TMO指標とAMA指標を組み合わせた取引シグナルを使用して,動揺する状況でトレンドが始まるタイミングを探し,スカルピング操作を行います.これは,信号の正確性が高く,トレンドを早期に捕捉し,リスクを制御する利点があります.この戦略は,さらなるパラメータとルール最適化が行われた後,非常に強力な実戦価値を持つ日内スカルピング戦略になることができます.
/*backtest
start: 2023-11-23 00:00:00
end: 2023-11-30 00:00:00
period: 10m
basePeriod: 1m
exchanges: [{"eid":"Futures_Binance","currency":"BTC_USDT"}]
*/

// This source code is subject to the terms of the Mozilla Public License 2.0 at https://mozilla.org/MPL/2.0/
// © Kaspricci

//@version=5
strategy("TradeIQ - Crazy Scalping Trading Strategy [Kaspricci]", overlay=true, initial_capital = 1000, currency = currency.USD)

headlineTMO = "TMO Settings"

tmoLength   = input.int(7, "TMO Length", minval = 1, group = headlineTMO)
tmoSource   = input.source(close, "TMO Source", group = headlineTMO)

// calculate values
osc         = ta.mom(ta.sma(ta.sma(tmoSource, tmoLength), tmoLength), tmoLength)

// determine color of historgram
oscColor    = osc > osc[1] and osc > 0 ? #00c42b : osc < osc[1] and osc > 0 ? #4ee567 : osc < osc[1] and osc < 0 ? #ff441f : osc > osc[1] and osc < 0 ? #c03920 : na

// plot histogram
//plot(osc, "OSC", oscColor, linewidth = 3, style = plot.style_histogram)

// conditon to find highs and lows
up          = ta.highest(tmoSource, tmoLength)
dn          = ta.lowest(tmoSource, tmoLength)

// define conditions to be used for finding divergence
phosc = ta.crossunder(ta.change(osc), 0)
plosc = ta.crossover (ta.change(osc), 0)

// test for divergence
bear = osc > 0 and phosc and ta.valuewhen(phosc,osc,0) < ta.valuewhen(phosc,osc,1) and ta.valuewhen(phosc,up,0) > ta.valuewhen(phosc,up,1) ? 1 : 0
bull = osc < 0 and plosc and ta.valuewhen(plosc,osc,0) > ta.valuewhen(plosc,osc,1) and ta.valuewhen(plosc,dn,0) < ta.valuewhen(plosc,dn,1) ? 1 : 0

// -------------------------------------------------------------------------------------------------------------

headlineAMA = "AMA Settings"

amaSource   = input.source(defval = close, title = "AMA Source", group = headlineAMA)
amaLength   = input.int(defval = 50, title = "AMA Length", minval = 2, group = headlineAMA)


amaMulti    = input.float(defval = 2.0, title = "Factor", minval = 1)

amaShowCd   = input(defval = true , title = "As Smoothed Candles")
amaShowEx   = input(defval = true,   title = "Show Alternating Extremities")

amaAlpha    = input.float(1.0, "Lag",       minval=0, step=.1, tooltip='Control the lag of the moving average (higher = more lag)', group= 'AMA Kernel Parameters')
amaBeta     = input.float(0.5, "Overshoot", minval=0, step=.1, tooltip='Control the overshoot amplitude of the moving average (higher = overshoots with an higher amplitude)', group='AMA Kernel Parameters')

// -------------------------------------------------------------------------------------------------------------

headlineSL = "Stop Loss Settings"

slLength    = input.int(defval = 10, title = "SL Period", minval = 1, group = headlineSL, tooltip = "Number of bars for swing high / low")

// -------------------------------------------------------------------------------------------------------------

var b       = array.new_float(0)
var float x = na

if barstate.isfirst
    for i = 0 to amaLength - 1
        x := i / (amaLength - 1)
        w = math.sin(2 * 3.14159 * math.pow(x, amaAlpha)) * (1 - math.pow(x, amaBeta))
        array.push(b, w)

// local function to filter the source
filter(series float x) =>
    sum = 0.

    for i = 0 to amaLength - 1
        sum := sum + x[i] * array.get(b,i)

    sum / array.sum(b)

// apply filter function on source series

srcFiltered = filter(amaSource)

deviation   = ta.sma(math.abs(amaSource - srcFiltered), amaLength) * amaMulti

upper       = srcFiltered + deviation
lower       = srcFiltered - deviation

//----
crossHigh   = ta.cross(high, upper)
crossLow    = ta.cross(low, lower)

var os      = 0
os          := crossHigh ? 1 : crossLow ? 0 : os[1]

ext         = os * upper + (1 - os) * lower

//----
os_css = ta.rsi(srcFiltered, amaLength) / 100

extColor    = os == 1 ? #30FF85 : #ff1100

plot(srcFiltered, "MA", amaShowCd ? na : color.black, 2, editable = false)
plot(amaShowEx ? ext : na, "Extremities", ta.change(os) ? na : extColor, 2, editable=false)

// handle smoothed candles
var float h = na
var float l = na
var float c = na
var float body = na

if amaShowCd
    h := filter(high)
    l := filter(low)
    c := filter(amaSource)
    body := math.abs(math.avg(c[1], c[2]) - c)

ohlc_os = ta.rsi(c, amaLength) / 100

plotcandle(math.avg(c[1], c[2]), h, l, c, "Smooth Candles", #434651, bordercolor = na, editable = false, display = amaShowCd ? display.all : display.none)

// -------------------------------------------------------------------------------------------------------------

plotshape(bull ? ext : na, "Bullish Circle", shape.circle,    location.absolute, color = #00c42b, size=size.tiny)
plotshape(bear ? ext : na, "Bearish Circle", shape.circle,    location.absolute, color = #ff441f, size=size.tiny)
plotshape(bull ? ext : na, "Bullish Label",  shape.labeldown, location.absolute, color = #00c42b, text="Buy", textcolor=color.white, size=size.tiny)
plotshape(bear ? ext : na, "Bearish Label",  shape.labelup,   location.absolute, color = #ff441f, text="Sell", textcolor=color.white, size=size.tiny)

// -------------------------------------------------------------------------------------------------------------

candleSizeIncreasing = body[2] < body[1] and body[1] < body[0]

longEntryCond   = os == 1 and bull
shortEntryCond  = os == 0 and bear

longEntry       = strategy.opentrades == 0 and candleSizeIncreasing and not candleSizeIncreasing[1] and ta.barssince(longEntryCond)  < ta.barssince(os == 0) and ta.barssince(longEntryCond) < ta.barssince(bear)
shortEntry      = strategy.opentrades == 0 and candleSizeIncreasing and not candleSizeIncreasing[1] and ta.barssince(shortEntryCond) < ta.barssince(os == 1) and ta.barssince(shortEntryCond) < ta.barssince(bull)

longExit        = strategy.opentrades > 0 and strategy.position_size > 0 and (bear or os == 0)
shortExit       = strategy.opentrades > 0 and strategy.position_size < 0 and (bull or os == 1)

recentSwingHigh = ta.highest(high, slLength) // highest high of last candles
recentSwingLow  = ta.lowest(low,   slLength) // lowest low of recent candles

bgcolor(longEntry  ? color.rgb(76, 175, 79, 90) : na)
bgcolor(shortEntry ? color.rgb(255, 82, 82, 90) : na)

slLong          = (close - recentSwingLow) / syminfo.mintick  // stop loss in ticks
slShort         = (recentSwingHigh - close) / syminfo.mintick // stop loss in ticks

newOrderID         = str.tostring(strategy.closedtrades + strategy.opentrades + 1)
curOrderID         = str.tostring(strategy.closedtrades + strategy.opentrades)

alertMessageForEntry = "Trade {0} - New {1} Entry at price: {2} with stop loss at: {3}"

if (longEntry)
    alertMessage = str.format(alertMessageForEntry, newOrderID, "Long", close, recentSwingLow)

    strategy.entry(newOrderID, strategy.long, alert_message = alertMessage)
    strategy.exit("Stop Loss Long", newOrderID, loss = slLong, alert_message = "Stop Loss for Trade " + newOrderID)

if(longExit)
    strategy.close(curOrderID, alert_message = "Close Trade " + curOrderID)

if (shortEntry)
    alertMessage = str.format(alertMessageForEntry, newOrderID, "Short", close, recentSwingLow)

    strategy.entry(newOrderID, strategy.short, alert_message = alertMessage)
    strategy.exit("Stop Loss Short", newOrderID, loss = slShort, alert_message = "Stop Loss for Trade " + newOrderID)

if(shortExit)
    strategy.close(curOrderID, alert_message = "Close Trade " + curOrderID)