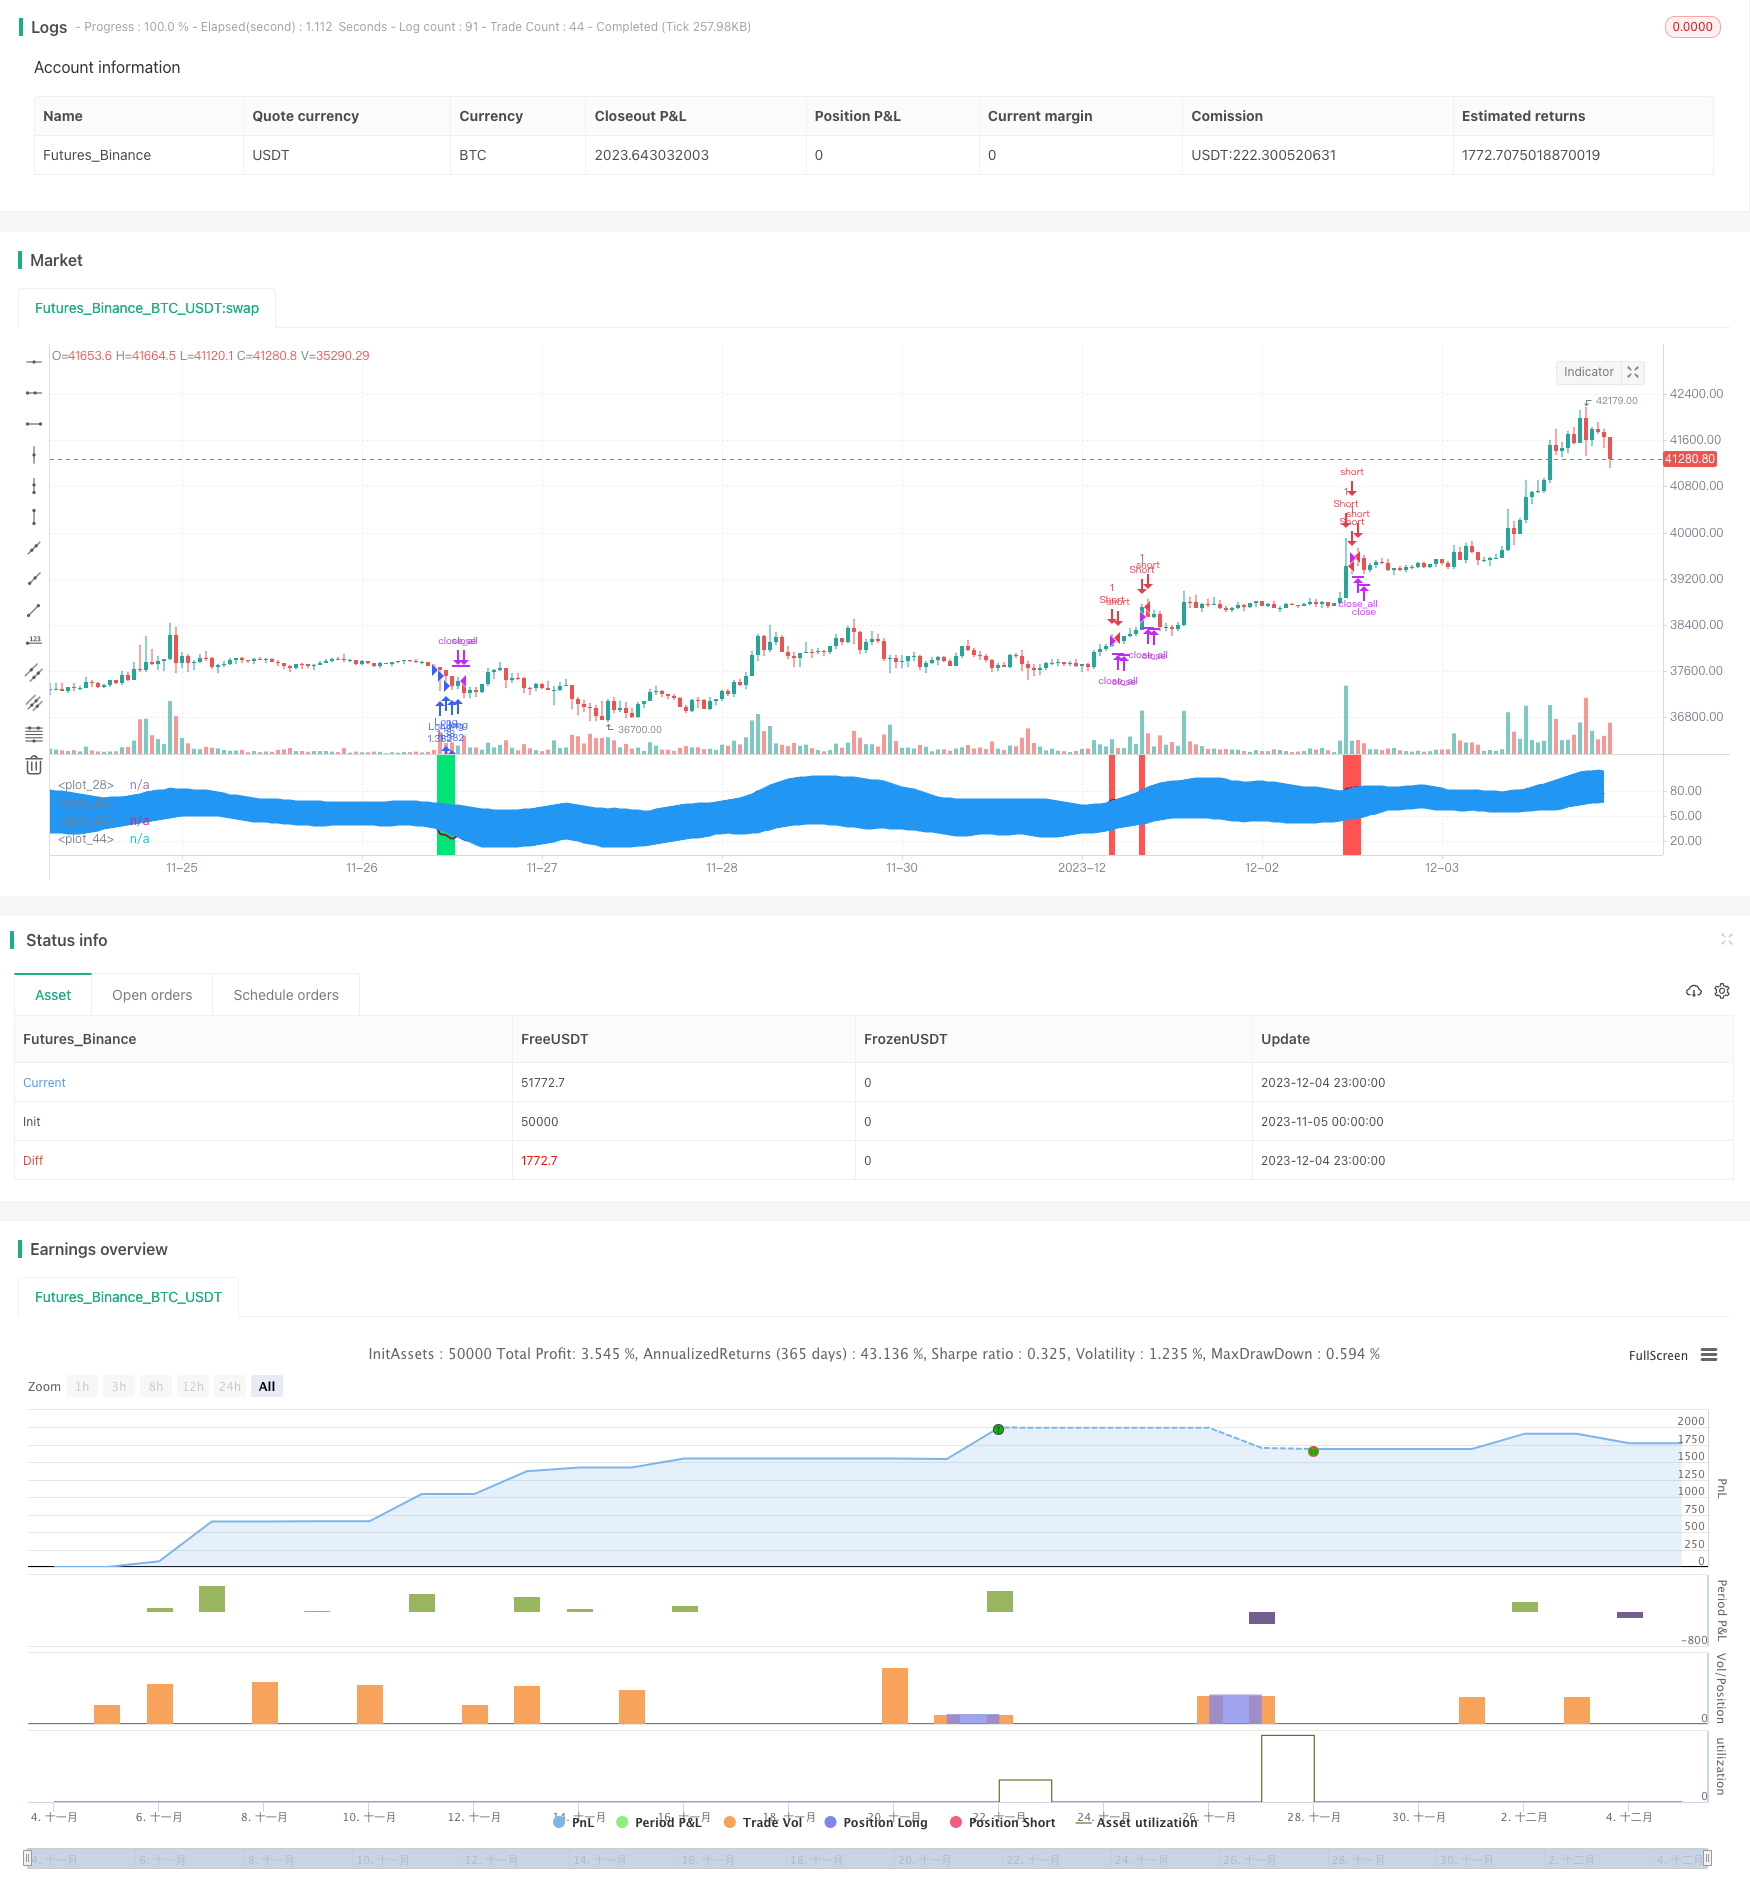
BBパーセント指数傾向の衰退戦略
作者: リン・ハーンチャオチャン, 日付: 2023-12-06 14:43:39タグ:

概要
この戦略は,BBパーセントインデックスとRSIおよびMFI指標を組み合わせたものです.これは,RSI過剰販売/過剰購入信号とMFI過剰販売/過剰購入信号とともに,ボリンジャーバンド上下レールの価格ブレイクを検出することによって,長期および短期間の決定を下します.これは典型的なトレンド消退トレード戦略です.
戦略の論理
- BB%は,ボリンガーチャネルを通して市場の方向性を判断するボリンガー中間帯との関係性における価格の標準偏差を表します.
- RSIとMFI指標を組み込み,過剰購入と過剰販売の条件を決定する. RSIは,過剰購入と過剰販売のレベルを決定するために,一定の期間中の平均利益と平均損失を比較する. MFIは,過剰購入と過剰販売のレベルを決定するために,ボリュームを上下に比較する.
- 価格がボリンジャー下線を上向きに突破すると,ロング;価格がボリンジャー上線を下向きに突破すると,ショート.同時に,RSIおよびMFI指標からの過剰販売/過剰購入信号をフィルタリングに使用します.
利点
- トレンドが消える取引は,市場の傾向を回避し,収益の変動を軽減します.
- 複数の指標の組み合わせにより 信号がフィルター化され 意思決定の正確性が向上します
- パラメータ化設定は,戦略のリスク・リターン特性を調整するのに柔軟です.
- コモディティ,フォレックス,暗号通貨など,非常に不安定な商品に適用できます.
リスク と 解決策
- ボリンジャー・ブレイクから誤った信号が発信する可能性が高いため,フィルタリングのために複数の指標の組み合わせが必要です.
- 突破信号の判断には 適切な緩和基準が必要です 良い機会を逃さないために
- ポジションのサイズ,ストップ・ロスのラインの上昇など,リスクを制御するためにパラメータ設定を調整する.
オプティマイゼーションの方向性
- ATR インディケーターなどの変動性に基づくストップ・ロスのメカニズムを組み込む.
- マシン学習モデルを導入し 信号の質を判断する
- 参加する楽器を動的に調整するために,楽器選択メカニズムを最適化する.
- 意思決定の枠組みを改善するために 感情指標やニュースなどの要素を 追加します
結論
この戦略は主に高変動性非トレンド型機器に適用される.ボリンガーチャネルと指標の組み合わせを通じてトレンド淡化取引を実装する.リスク・リターン特性はパラメータを調整することによって制御できる.さらなる改善は,意思決定品質を最適化するためにより多くの補助指標とモデルを導入することによって行われ,それによってより良い戦略パフォーマンスを達成することができる.
/*backtest
start: 2023-11-05 00:00:00
end: 2023-12-05 00:00:00
period: 1h
basePeriod: 15m
exchanges: [{"eid":"Futures_Binance","currency":"BTC_USDT"}]
*/

//Noro
//2018

//@version=2
strategy(title = "BB%/MFI/RSI", shorttitle = "BB%/MFI/RSI", default_qty_type = strategy.percent_of_equity, default_qty_value = 100, pyramiding = 100)

//Settings
needlong = input(true, defval = true, title = "Long")
needshort = input(false, defval = false, title = "Short")
capital = input(100, defval = 100, minval = 1, maxval = 10000, title = "Lot, %")
fromyear = input(1900, defval = 1900, minval = 1900, maxval = 2100, title = "From Year")
toyear = input(2100, defval = 2100, minval = 1900, maxval = 2100, title = "To Year")
frommonth = input(01, defval = 01, minval = 01, maxval = 12, title = "From Month")
tomonth = input(12, defval = 12, minval = 01, maxval = 12, title = "To Month")
fromday = input(01, defval = 01, minval = 01, maxval = 31, title = "From Day")
today = input(31, defval = 31, minval = 01, maxval = 31, title = "To Day")

source = hlc3
length = input(14, minval=1), mult = input(2.0, minval=0.001, maxval=50), bblength = input(50, minval=1, title="BB Period")
DrawRSI_f=input(true, title="Draw RSI?", type=bool)
DrawMFI_f=input(false, title="Draw MFI?", type=bool)
HighlightBreaches=input(true, title="Highlight Oversold/Overbought?", type=bool)

DrawMFI = (not DrawMFI_f) and (not DrawRSI_f) ? true : DrawMFI_f
DrawRSI = (DrawMFI_f and DrawRSI_f) ? false : DrawRSI_f
// RSI
rsi_s = DrawRSI ? rsi(source, length) : na
plot(DrawRSI ? rsi_s : na, color=maroon, linewidth=2)

// MFI
upper_s = DrawMFI ? sum(volume * (change(source) <= 0 ? 0 : source), length) : na
lower_s = DrawMFI ? sum(volume * (change(source) >= 0 ? 0 : source), length) : na
mf = DrawMFI ? rsi(upper_s, lower_s) : na
plot(DrawMFI ? mf : na, color=green, linewidth=2)

// Draw BB on indices
bb_s = DrawRSI ? rsi_s : DrawMFI ? mf : na
basis = sma(bb_s, length)
dev = mult * stdev(bb_s, bblength)
upper = basis + dev
lower = basis - dev
plot(basis, color=red)
p1 = plot(upper, color=blue)
p2 = plot(lower, color=blue)
fill(p1,p2, blue)

b_color = (bb_s > upper) ? red : (bb_s < lower) ? lime : na
bgcolor(HighlightBreaches ? b_color : na, transp = 0)

//Signals
up = bb_s < lower and close < open
dn = bb_s > upper and close > open
size = strategy.position_size
lp = size > 0 and close > open
sp = size < 0 and close < open
exit = (up == false and dn == false) and (lp or sp)

//Trading
lot = strategy.position_size == 0 ? strategy.equity / close * capital / 100 : lot[1]
if up
    if strategy.position_size < 0
        strategy.close_all()

    strategy.entry("Long", strategy.long, needlong == false ? 0 : lot, when=(time > timestamp(fromyear, frommonth, fromday, 00, 00) and time < timestamp(toyear, tomonth, today, 23, 59)))

if dn
    if strategy.position_size > 0
        strategy.close_all()

    strategy.entry("Short", strategy.short, needshort == false ? 0 : lot, when=(time > timestamp(fromyear, frommonth, fromday, 00, 00) and time < timestamp(toyear, tomonth, today, 23, 59)))

if time > timestamp(toyear, tomonth, today, 23, 59) or exit
    strategy.close_all()
もっと
- MA トレンドフィルターによるボリンジャー・バンド逆転
- RSIに基づく定量的な取引戦略
- 複数の移動平均のクロスオーバー取引戦略
- 移動平均のクロスオーバー戦略
- オート S/R ブレイクアウト戦略
- モメントム 価格チャネル開閉戦略
- 市場動向を指向する改善された移動平均のクロスオーバー戦略
- ダイナミック・キャンドルスティック・ビッグ・ヤング・ライン・トレーディング・戦略
- SSL ハイブリッド アウト アロー 量子 戦略
- 2つの移動平均 ADX タイミング戦略
- MACD ボリンガータートル取引戦略
- トリプル・スーパートレンドとストック・RSI戦略
- 1% 利益移動平均のクロス戦略
- 重量化定量移動平均のクロスオーバー取引戦略
- 複数の補助RSI指標戦略
- 2つの移動平均のクロスオーバートレンド戦略
- 逆転ボリンガーバンド戦略
- アダプタブルなATR-ADXトレンド戦略 V2
- 二重要素サイクル取引戦略
- 平均 最高 最高 最低 スウィンガー戦略