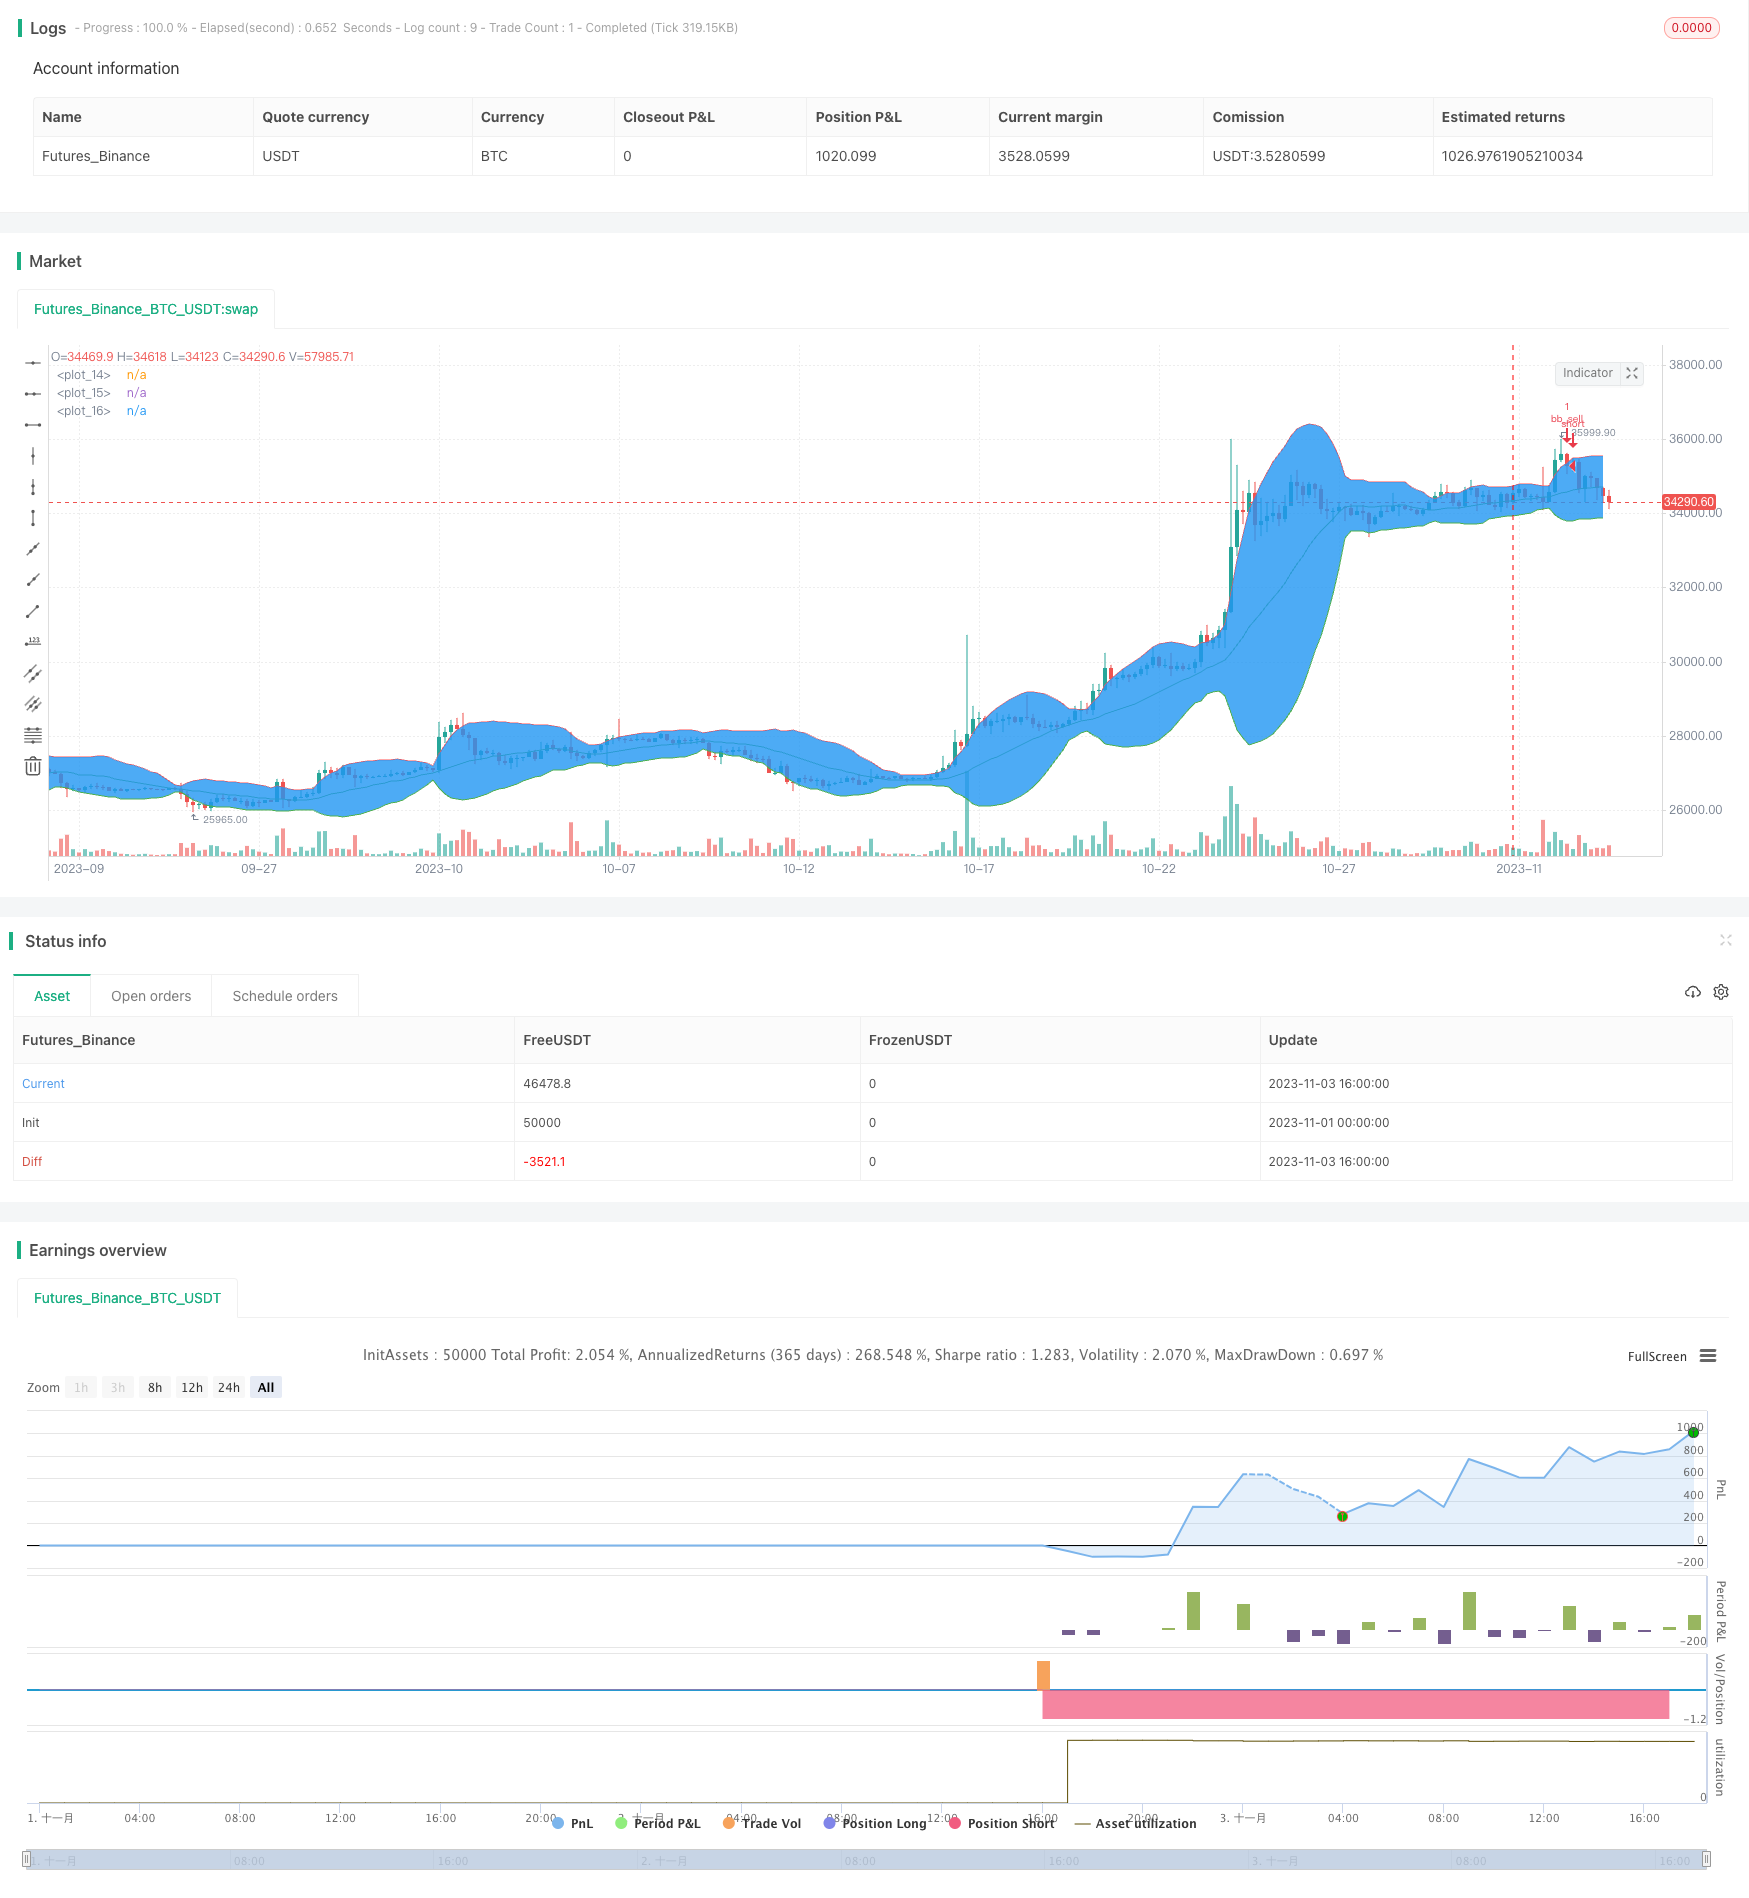
The Reversal Bollinger Bands strategy is a FOREX trading strategy based on Bollinger Bands. It works best on JPY pairs. When price breaks through the Bollinger Bands upper or lower limit, it takes a reverse operation with the target price set to the highest or lowest point of the last 10 candlesticks.
The strategy builds the upper and lower rails based on the 20-day simple moving average and its 2 times standard deviation. When the closing price of the current candlestick breaks through the lower rail, go long; when it breaks through the upper rail, go short. The stop loss price is set to the lowest price of the last 10 candlesticks, and the take profit price is set to the highest price of the last 10 candlesticks.
Specifically, if the opening price of the previous candlestick is lower than the lower rail, and the closing price of the current candlestick is also lower than the lower rail, then go long. The stop loss price is set to the lowest price of the last 10 candlesticks, and the take profit price is set to the highest price of the last 10 candlesticks.
On the contrary, if the opening price of the previous candlestick is higher than the upper rail, and the closing price of the current candlestick is also higher than the upper rail, then go short. The stop loss price is set to the highest price of the last 10 candlesticks, and the take profit price is set to the lowest price of the last 10 candlesticks.
This strategy has the characteristics of reversal trading. When the price breaks through the Bollinger Bands, it indicates that a trend reversal is taking place, so a reverse operation is taken. The setting of stop loss and take profit is also reasonable to obtain a good risk-reward ratio.
In addition, this strategy has few parameters and is simple to implement and easy to understand. And JPY pairs fluctuate greatly, which is suitable for this strategy.
The biggest risk of this strategy is that it cannot effectively determine the inflection point of the trend. After the price breaks through the upper and lower limits of the Bollinger Bands, the original trend may continue to run. If reverse market making is taken at this time, it is likely to cause losses.
In addition, the stop loss and take profit settings for recent highs and lows also carry risks. If a V-shaped reversal occurs in the market, the stop loss may be directly broken through. The take profit setting may also not accurately predict and fail to fully enjoy the profits from the market reversal.
To control risks, a reasonable stop loss can be set to reduce losses per trade. Moving stop loss can also be adopted to lock in profits and appropriately adjust the take profit location.
The strategy can be optimized in the following aspects:
Increase filter conditions to avoid wrong signals. Trading volume filters can be set to ensure that trading volume expands when there is a breakout to confirm the trend reversal.
Optimize parameter settings. Test the impact of different parameter settings on results to find the optimal parameter combination.
Verify buy and sell signals with other indicators such as RSI and other oscillators to confirm signal reliability.
Use machine learning and other methods to dynamically optimize stop loss and take profit locations to make the strategy more adaptive.
The Reversal Bollinger Bands strategy is an simple and practical short-term trading strategy overall. It has reversible operations and controllable risks, suitable for intraday trading. But parameters and filter conditions need further optimization to reduce false signals and improve efficiency. If combined with other technical indicators and dynamic stop loss and take profit, the performance of this strategy still has great room for improvement.
/*backtest start: 2023-11-01 00:00:00 end: 2023-11-03 18:59:59 period: 4h basePeriod: 15m exchanges: [{"eid":"Futures_Binance","currency":"BTC_USDT"}] */ //@version=4 // Initial settings strategy("Bulle de bollinger", overlay = true) // Parameter Settings mdl = sma(close, 20) dev = stdev(close, 20) upr = mdl + 2*dev lwr = mdl - 2*dev // Plot plot(mdl, color = color.green) // Plot moving average p1 = plot(upr, color = color.red) // Plot Upper_band p2 = plot(lwr, color = color.green) // Plot lower band fill(p1, p2, color = color.blue) // Fill transparant color between the 2 plots // Strategy entry & close if open[1] < lwr[1] and close[1] < lwr[1] // Previous price lower than lower band and current close is higher than lower band stop_level = lowest(10) profit_level = highest(10) strategy.entry(id = 'bb_buy', long = true) strategy.exit("TP/SL", "bb_buy", stop=stop_level, limit=profit_level) if open[1] > upr[1] and close[1] > upr // Previous price is higher than higher band & current close is lower the higher band stop_level = highest(10) profit_level = lowest(10) strategy.entry(id = 'bb_sell', long = false) strategy.exit("TP/SL", "bb_sell", stop=stop_level, limit=profit_level)