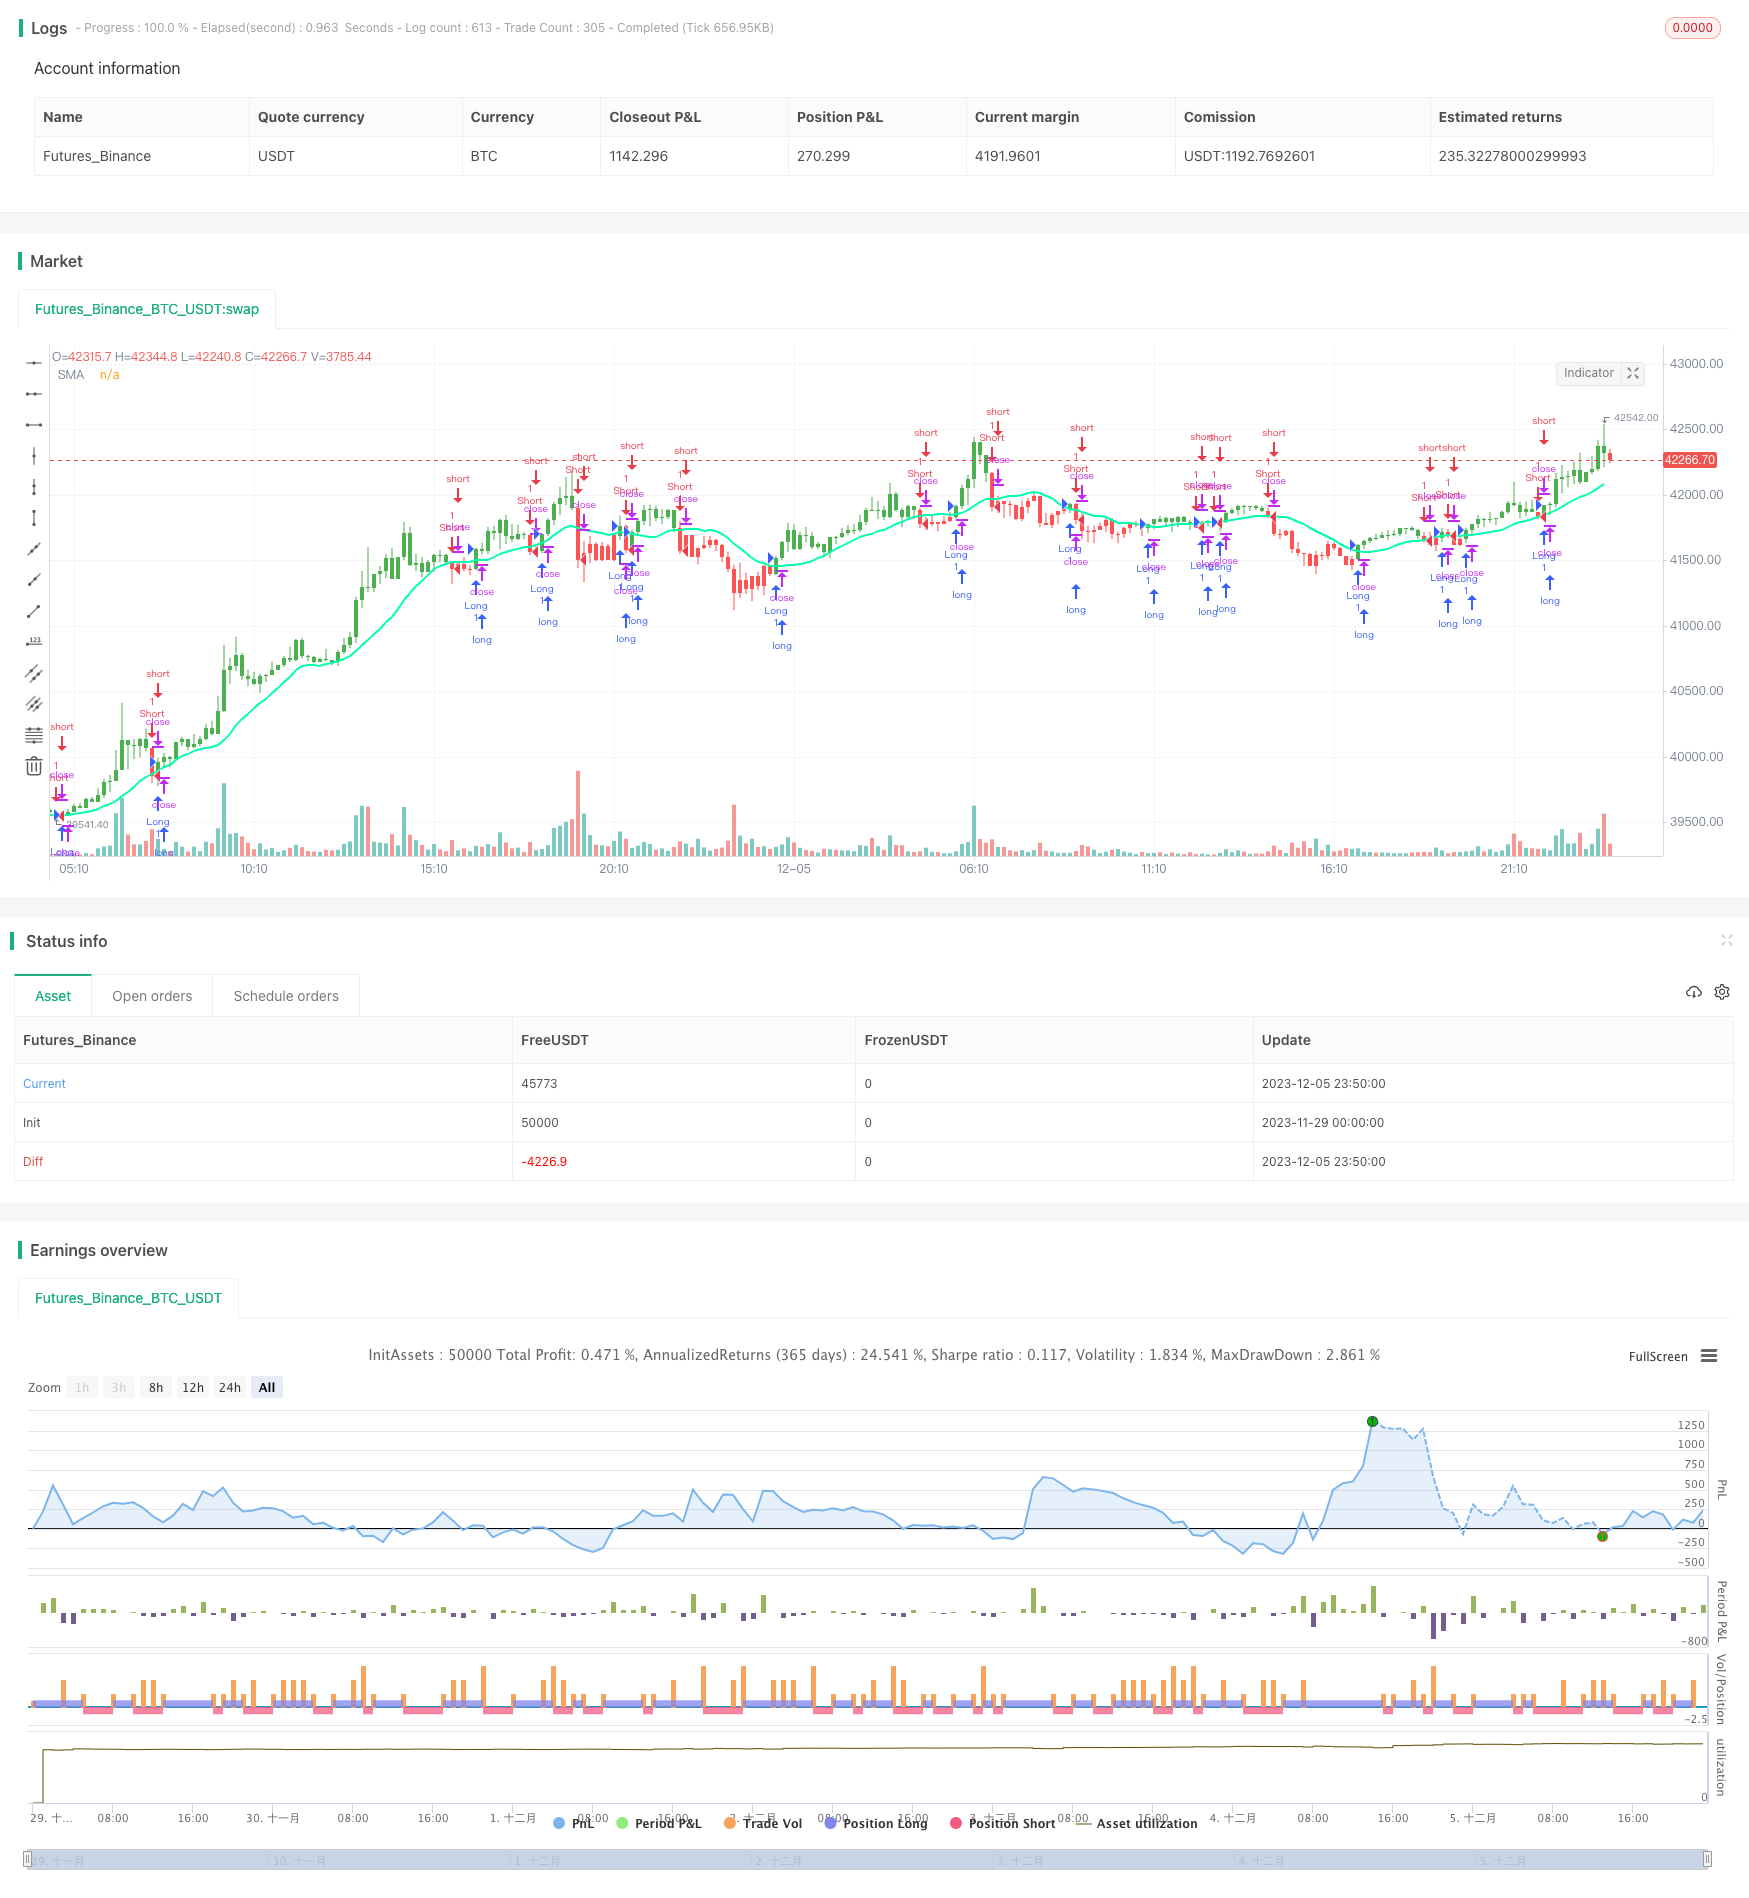
双動平均逆転追跡戦略
作者: リン・ハーンチャオチャン, 日時: 2023-12-07 17:40:12タグ:

この戦略の主なアイデアは,移動平均の黄金十字と死十字を取引信号として使用し,入口とストップをするためにダブル移動平均の価格ブレイクと組み合わせることである.短期移動平均が長期移動平均を超えると購入信号を生成し,短期移動平均が長期移動平均を下回ると販売信号を生成する.したがって,戦略はトレンドフォローと平均逆転の両方の特徴を持っています.
詳細な運営原則は以下のとおりです.
-
短期の単純な移動平均値 (SMA) と長期の単純な移動平均値を計算する.
-
価格が移動平均値以上または以下であるかを比較する.移動平均値以上の価格がロングポジションを示し,下の価格がショートポジションを示します.
-
短SMAが長SMAを横切るとロングSMAが横切るとロングSMAが横切るとショート.
-
ロングとショートを切り替える
この戦略の主な利点は以下の通りです.
-
二重移動平均戦略は,トレンドフォローと平均逆転の両方を組み合わせ,市場のトレンドを追跡し,逆転機会を把握することを利用します.
-
移動平均値の金十字と死十字は 持続性があるため 誤ったブレイクをフィルタリングするのに役立ちます
-
移動平均理論に基づいて,トレンドとレンジ・バインド市場での利益を固定することが有益です.
この戦略の主なリスクは,
-
二重移動平均戦略はパラメータに敏感である.パラメータの設定が正しくない場合,過剰取引または機会を逃す可能性があります.
-
失敗したブレイクアウトは損失を招く可能性があります. リスクを制御するために効果的なストップが実施されるべきです.
-
トレンドの逆転が成功する保証はない.元のトレンドが継続して損失をもたらす可能性があります.
主な最適化方向:
-
最適なパラメータ組み合わせを見つけるために移動平均パラメータをテストし最適化します
-
トレンドとレンジングの市場を区別するために,トレンド決定指標を追加します.
-
リスクをコントロールするために効果的なストップロスを実施します.例えば,ストップロスの後退,ストップオーダーの損失など.
-
戦略の安定性を高めるために他の指標と組み合わせる.
結論として,二重移動平均逆転追跡戦略として,トレンドトラッキングと逆転取引の両方を考慮に入れる.適切なパラメータ最適化とリスク管理により,良い結果を達成することができます.しかし,いかなる戦略も方向性エラー,ストップ損失失敗などのリスクに直面します. 変化する市場に適応するために継続的なテストと最適化が必要です.
/*backtest
start: 2023-11-29 00:00:00
end: 2023-12-06 00:00:00
period: 10m
basePeriod: 1m
exchanges: [{"eid":"Futures_Binance","currency":"BTC_USDT"}]
*/

// This source code is subject to the terms of the Mozilla Public License 2.0 at https://mozilla.org/MPL/2.0/
// © HPotter
//  Simple SMA strategy
//
// WARNING:
//      - For purpose educate only
//      - This script to change bars colors
//@version=4
strategy(title="Simple SMA Strategy Backtest", shorttitle="SMA Backtest", precision=6, overlay=true)
Resolution = input(title="Resolution", type=input.resolution, defval="D")
Source = input(title="Source", type=input.source, defval=close)
xSeries = security(syminfo.tickerid, Resolution, Source)
Length = input(title="Length", type=input.integer, defval=14, minval=2)
TriggerPrice = input(title="Trigger Price", type=input.source, defval=close)
BarColors = input(title="Painting bars", type=input.bool, defval=true)
ShowLine = input(title="Show Line", type=input.bool, defval=true)
UseAlerts = input(title="Use Alerts", type=input.bool, defval=false)
reverse = input(title="Trade Reverse", type=input.bool, defval=false)
pos = 0
xSMA = sma(xSeries, Length)
pos := iff(TriggerPrice > xSMA, 1,
         iff(TriggerPrice < xSMA, -1, nz(pos[1], 0)))
nRes = ShowLine ? xSMA : na
alertcondition(UseAlerts == true and pos != pos[1] and pos == 1, title='Signal Buy', message='Strategy to change to BUY')
alertcondition(UseAlerts == true and pos != pos[1] and pos == -1, title='Signal Sell', message='Strategy to change to SELL')
alertcondition(UseAlerts == true and pos != pos[1] and pos == 0, title='FLAT', message='Strategy get out from position')
possig = iff(reverse and pos == 1, -1,
           iff(reverse and pos == -1, 1, pos))
if (possig == 1)
    strategy.entry("Long", strategy.long)
if (possig == -1)
    strategy.entry("Short", strategy.short)
if (possig == 0)
    strategy.close_all()
nColor = BarColors ? possig == -1 ? color.red : possig == 1 ? color.green : color.blue : na
barcolor(nColor)
plot(nRes, title='SMA', color=#00ffaa, linewidth=2, style=plot.style_line)
- kNNベースのトレンドフォロー戦略
- シンプルなモメンタム戦略,SMA,EMA,ボリュームに基づく
- ドンチアン・チャネルズ ブレイク量的な取引戦略
- N 連続的な高値 閉じる 脱出戦略
- 賢明な定量的な底辺逆転取引戦略
- Bollinger + RSI ダブル戦略 (ロングのみ) v1.2
- CCIのゼロ・クロス・トレーディング戦略
- 2つの移動平均価格逆転のブレイクアウト戦略
- 移動平均回帰取引戦略
- 移動平均 総和 ウィリアムズ 商業 買取圧力指標 戦略
- 移動平均総和 MACD 戦略
- EMAの骨格戦略
- ランダム数に基づく定量的な取引戦略
- MACD をベースとした二重取引戦略
- 黄金取引のためのEMA離脱とパラボリックSARとCCI戦略
- EMAモメンタム移動平均クロスオーバー戦略
- カマリラピホットポイント 突破と勢力の逆転 低吸収金十字戦略
- ドンチアン・チャネル ストップ・ロスト戦略
- ストラテジーをフォローする渦振動器のトレンド
- 日中のピボットポイント取引戦略