概述
该策略的核心思想是根据唐奇安通道的价格突破情况来进行买卖操作,属于趋势跟踪类型的量化策略。它可以自动识别价格通道,当价格突破通道上沿时开仓做多,当价格回落至通道下沿附近或止损点时平仓。该策略旨在捕捉中长线的价格趋势,适用于股指期货等金融衍生品的算法交易。
原理
该策略基于唐奇安通道指标,唐奇安通道是通过一个给定周期内的最高价和最低价画出的通道区域。其计算方法是:
上轨 = 近n周期内的最高价 下轨 = 近n周期内的最低价
当价格突破上轨时认为进入多头趋势,当价格跌破下轨时认为进入空头趋势。该策略仅考虑突破上轨的情况。
具体交易逻辑是:
- 使用n周期最高价画出唐奇安通道上轨
- 当收盘价突破上轨时,做多入场
- 止盈方式为收盘价回落至通道下轨附近或设定的止损点
优势
该策略具有以下优势:
- 策略思路清晰,易于理解和实现
- 唐奇安通道指标成熟可靠,容易判断趋势方向
- 自动识别通道,无需人工判断走势
- 可配置参数,适应性强
- 含有止损机制,可以限制 losses
风险
该策略也存在一些风险:
- 唐奇安通道可能出现平假破,导致不必要的亏损
- 止损位置设置不当可能扩大 losses
- 临近通道时需要注意反转风险
- 参数设置(周期长度等)不当会影响策略效果
对应解决方法:
- 结合其他指标过滤平假破
- 优化止损位置,平滑退出
- 考虑通道附近加大交易量或扩大止盈范围
- 测试不同参数,找到最优参数
优化方向
该策略还可从以下方面进行优化:
- 增加其他指标判断,避免平假破,例如MACD、KD等
- 优化止损机制,例如随价格波动的移动止损
- 优化参与度控制,例如只在波动加大时交易
- 参数优化,寻找最优参数组合
总结
该策略整体思路清晰,易于理解和实现,利用成熟的唐奇安通道指标自动识别趋势方向。同时配置较为灵活,可根据实际需要调整。通过止损和参数优化,可以取得较好的效果。总体来说,该策略既易于上手,又具备一定的效率,适合作为量化交易的入门策略之一。
策略源码
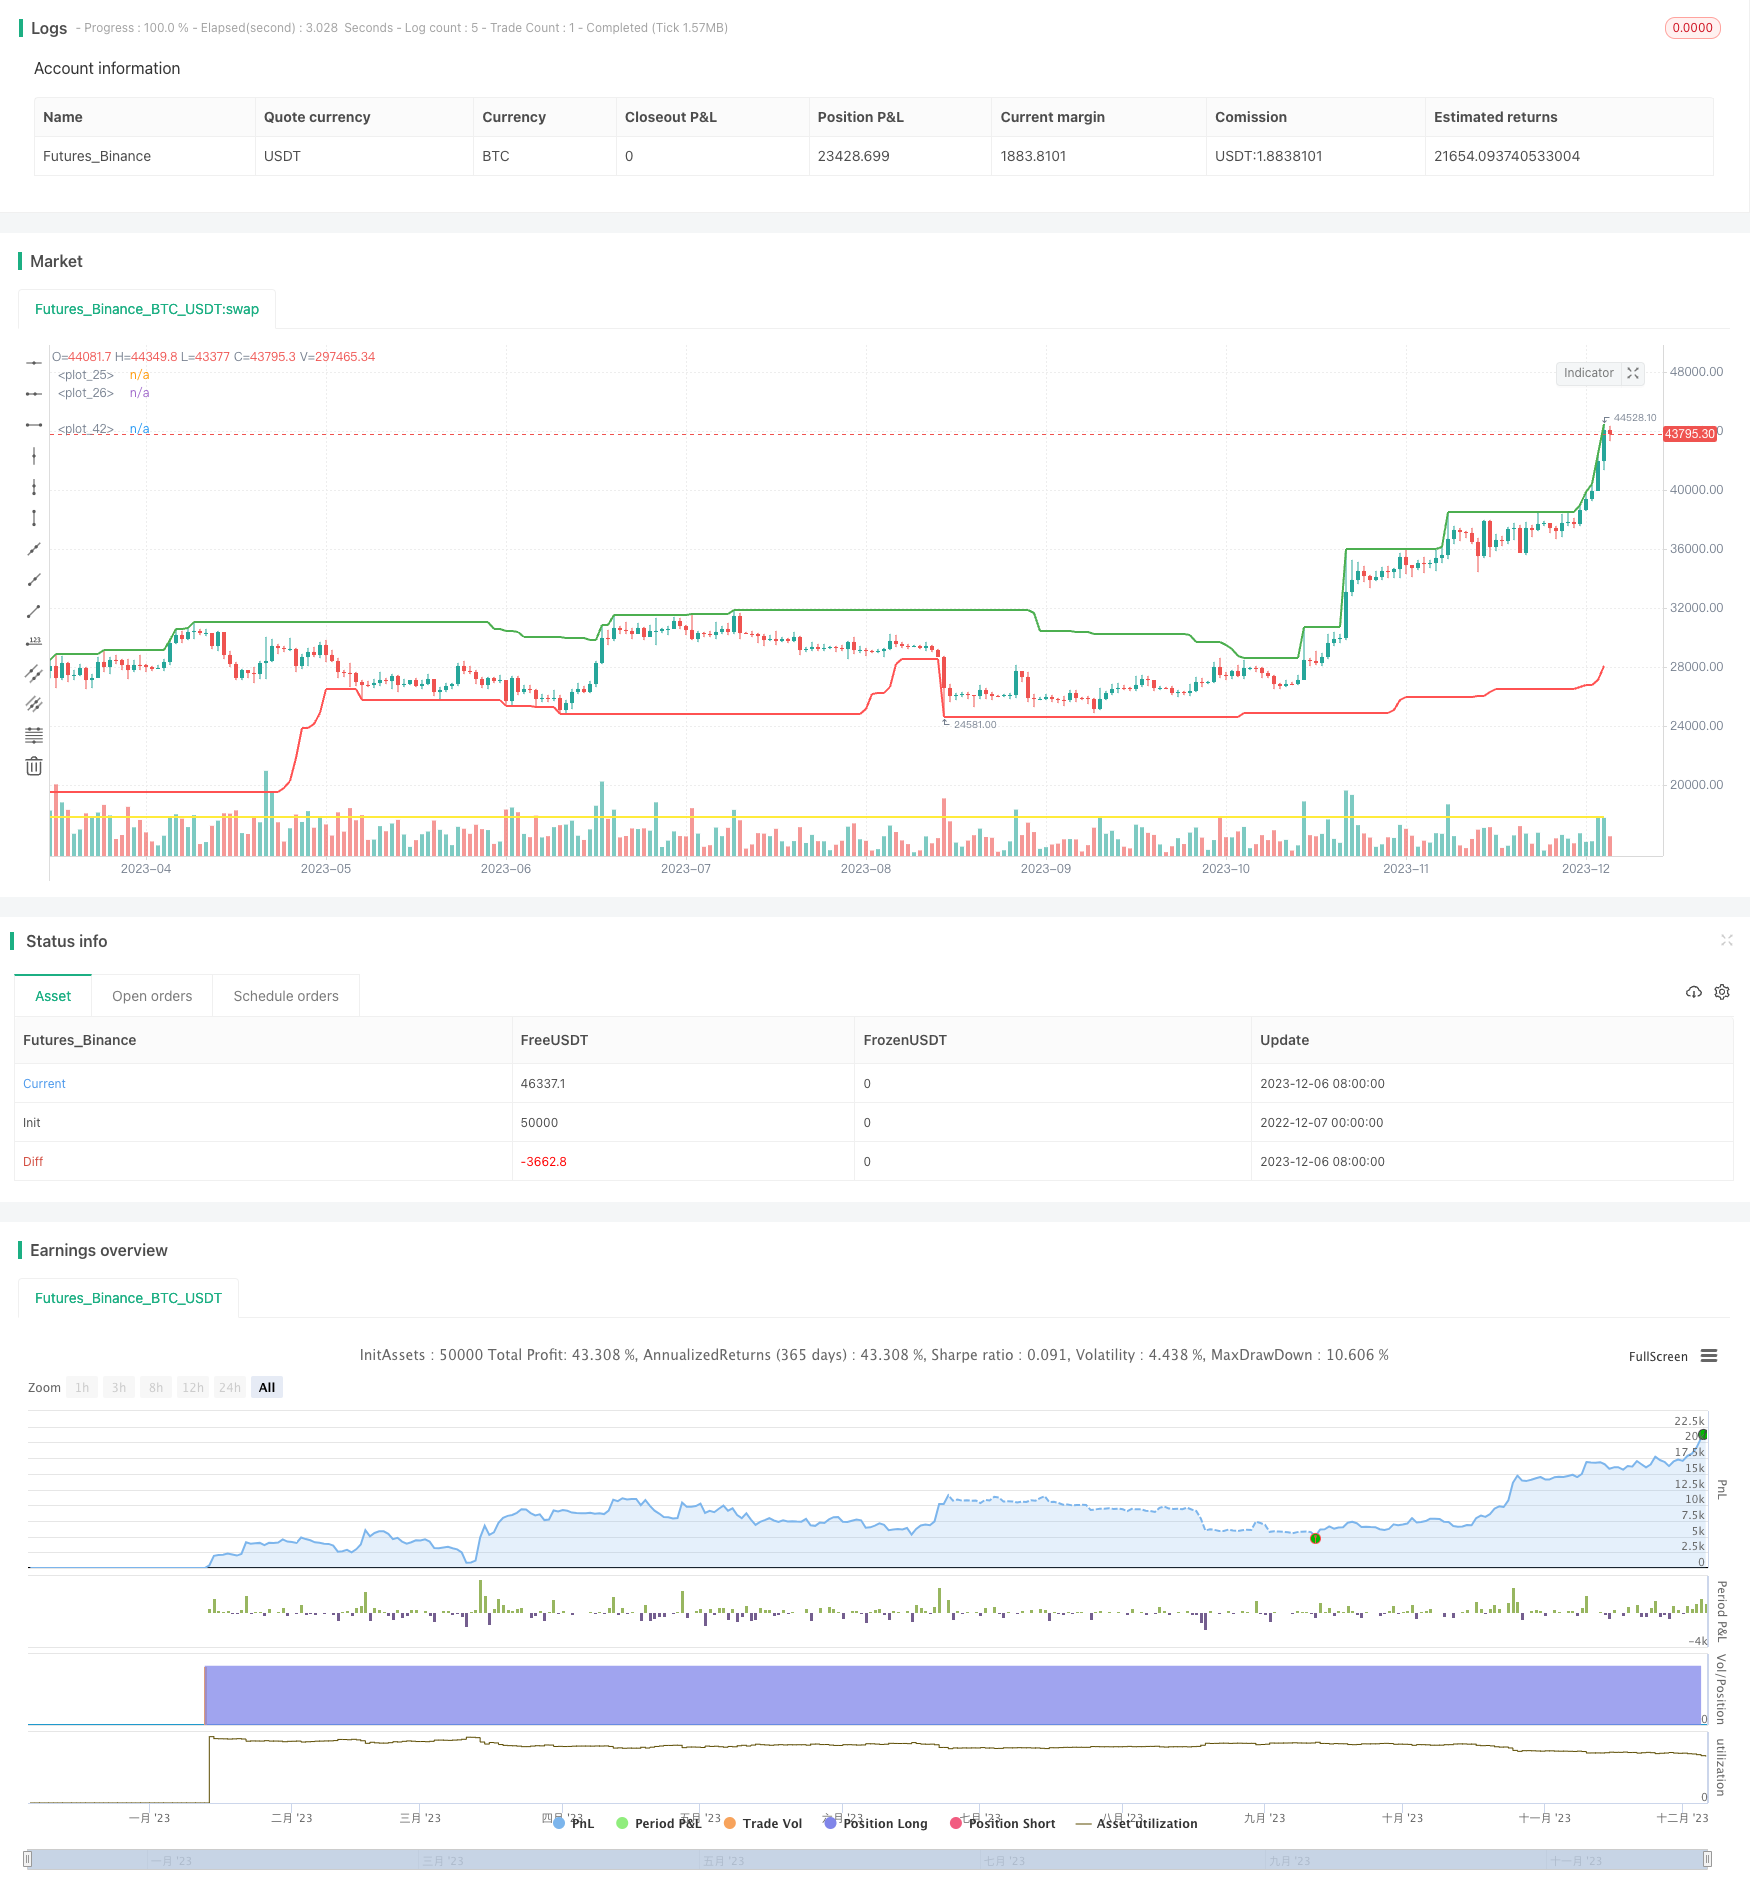
/*backtest
start: 2022-12-07 00:00:00
end: 2023-12-07 00:00:00
period: 1d
basePeriod: 1h
exchanges: [{"eid":"Futures_Binance","currency":"BTC_USDT"}]
*/

// This source code is subject to the terms of the Mozilla Public License 2.0 at https://mozilla.org/MPL/2.0/
// © Giovanni_Trombetta

// Strategy to capture price channel breakouts

//@version=4
strategy("ChannelsBreakout", max_bars_back=50, overlay=true)

instrument = input(1, title = "Select 1: Stock/Forex, 2: Future")
money = input(10000, title = "Money for each trade")
backtest_start = input(2000, "Insert first year to backtest")
period = input(50, title = "Period in bars of Donchian Channel")
monetary_stoploss = input(1000, title = "Monetary Stop Loss")

quantity = if instrument != 1
    1
else
    int(money / close)

upBarrier = highest(high,period)
downBarrier = lowest(low,period)
up = highest(high,period / 4)
down = lowest(low,period / 4)

plot(upBarrier, color=color.green, linewidth=2)
plot(downBarrier, color=color.red, linewidth=2)
plot(up, color=color.lime, linewidth=1)
plot(down, color=color.orange, linewidth=2)

longCondition = crossover(close, upBarrier[1]) and year >= backtest_start

if (longCondition)
    strategy.entry("Long", strategy.long, quantity, when = strategy.position_size == 0)

closeCondition = crossunder(close, down[1]) or down < down[1]

if (closeCondition)
    strategy.close("Long", comment = "Trailing")

stop_level = strategy.position_avg_price - monetary_stoploss / strategy.position_size
strategy.exit("StopLoss", from_entry = "Long", stop = stop_level)
plot(stop_level, color=color.yellow, linewidth=2)

// l = label.new(bar_index, na,
//   text="PineScript Code", color= color.lime, textcolor = color.white,
//   style=label.style_labelup, yloc=yloc.belowbar, size=size.normal)
// label.delete(l[1])