Noro ボラティリティ チャネル スキャルピング戦略
作成日:
2023-12-11 17:06:27
最終変更日:
2023-12-11 17:06:27
コピー:
0
クリック数:
431
1
フォロー
1212
フォロワー
概要
Noro’s Price Channel Scalping Strategy (Noro’s Price Channel Scalping Strategy) は,価格チャネルと価格波動帯に基づくスカルピング取引戦略である.この戦略は,価格チャネルと価格波動をもたらす市場トレンドを識別し,トレンド方向の転換時に入場する.
戦略原則
この策略は,まず価格の最高価格チャネル (lasthigh) と最低価格チャネル (lastlow) を計算し,次に価格チャネルの中央線 (center) を計算する.それから,価格と中央線の距離 (dist) と,距離の単純な移動平均 (distsma) を計算する.これに基づいて,中央線の1倍 (hdとld) と2倍 (hd2とld2) の価格変動帯を計算することができる.
価格が中線から1倍離れた波動帯を上から穿越したときに看板と判断され,価格が中線から1倍離れた波動帯を下から穿越したときに看板と判断されます. 策略は衰退の兆候が現れたときに逆転開場を行う. 例えば,看板の傾向の下では,もし2つの陽線が現れたら,第2の陽線が閉じる時に空きをする.看板の傾向の下では,もし2つの陰線が現れたら,第2の陰線が閉じる時に多めにする.
戦略的優位性
- 価格チャネルを活用して市場動向の方向性を判断し,誤った取引を避ける
- 価格変動によるトレンドの衰えを判断し,転換点を正確に捉える
- スカルピングで,迅速な利益を得ることができます.
戦略リスク
- 価格の波動が大きい場合,価格チャネルと波動帯は機能しなくなります.
- スキャルピング取引は取引頻度が高く,取引コストと滑り場リスクを増加させる可能性があります.
- 損失のリスクを抑えるために,十分に考えるべきストップ・ローズ戦略
戦略の最適化
- 価格チャネルと波動帯のパラメータを最適化して,より多くの市場状況に適応する
- 他の指標と組み合わせたトレンドと転換点
- ストップ・ロスの策略を増やす
- 取引コストと滑点の影響
要約する
ノロ波動チャネルスカルピング戦略は,全体的に見ると,スカルピング取引に非常に適した戦略である.価格チャネルと波動帯を使って市場の動きを判断し,ピークまたは底盤の兆候が現れたときに逆転してポジションを開きます.この戦略は,取引頻度が高く,利益が迅速ですが,一定のリスクも伴います.さらなる最適化により,この戦略は,より多くの異なる市場で適用できます.
ストラテジーソースコード
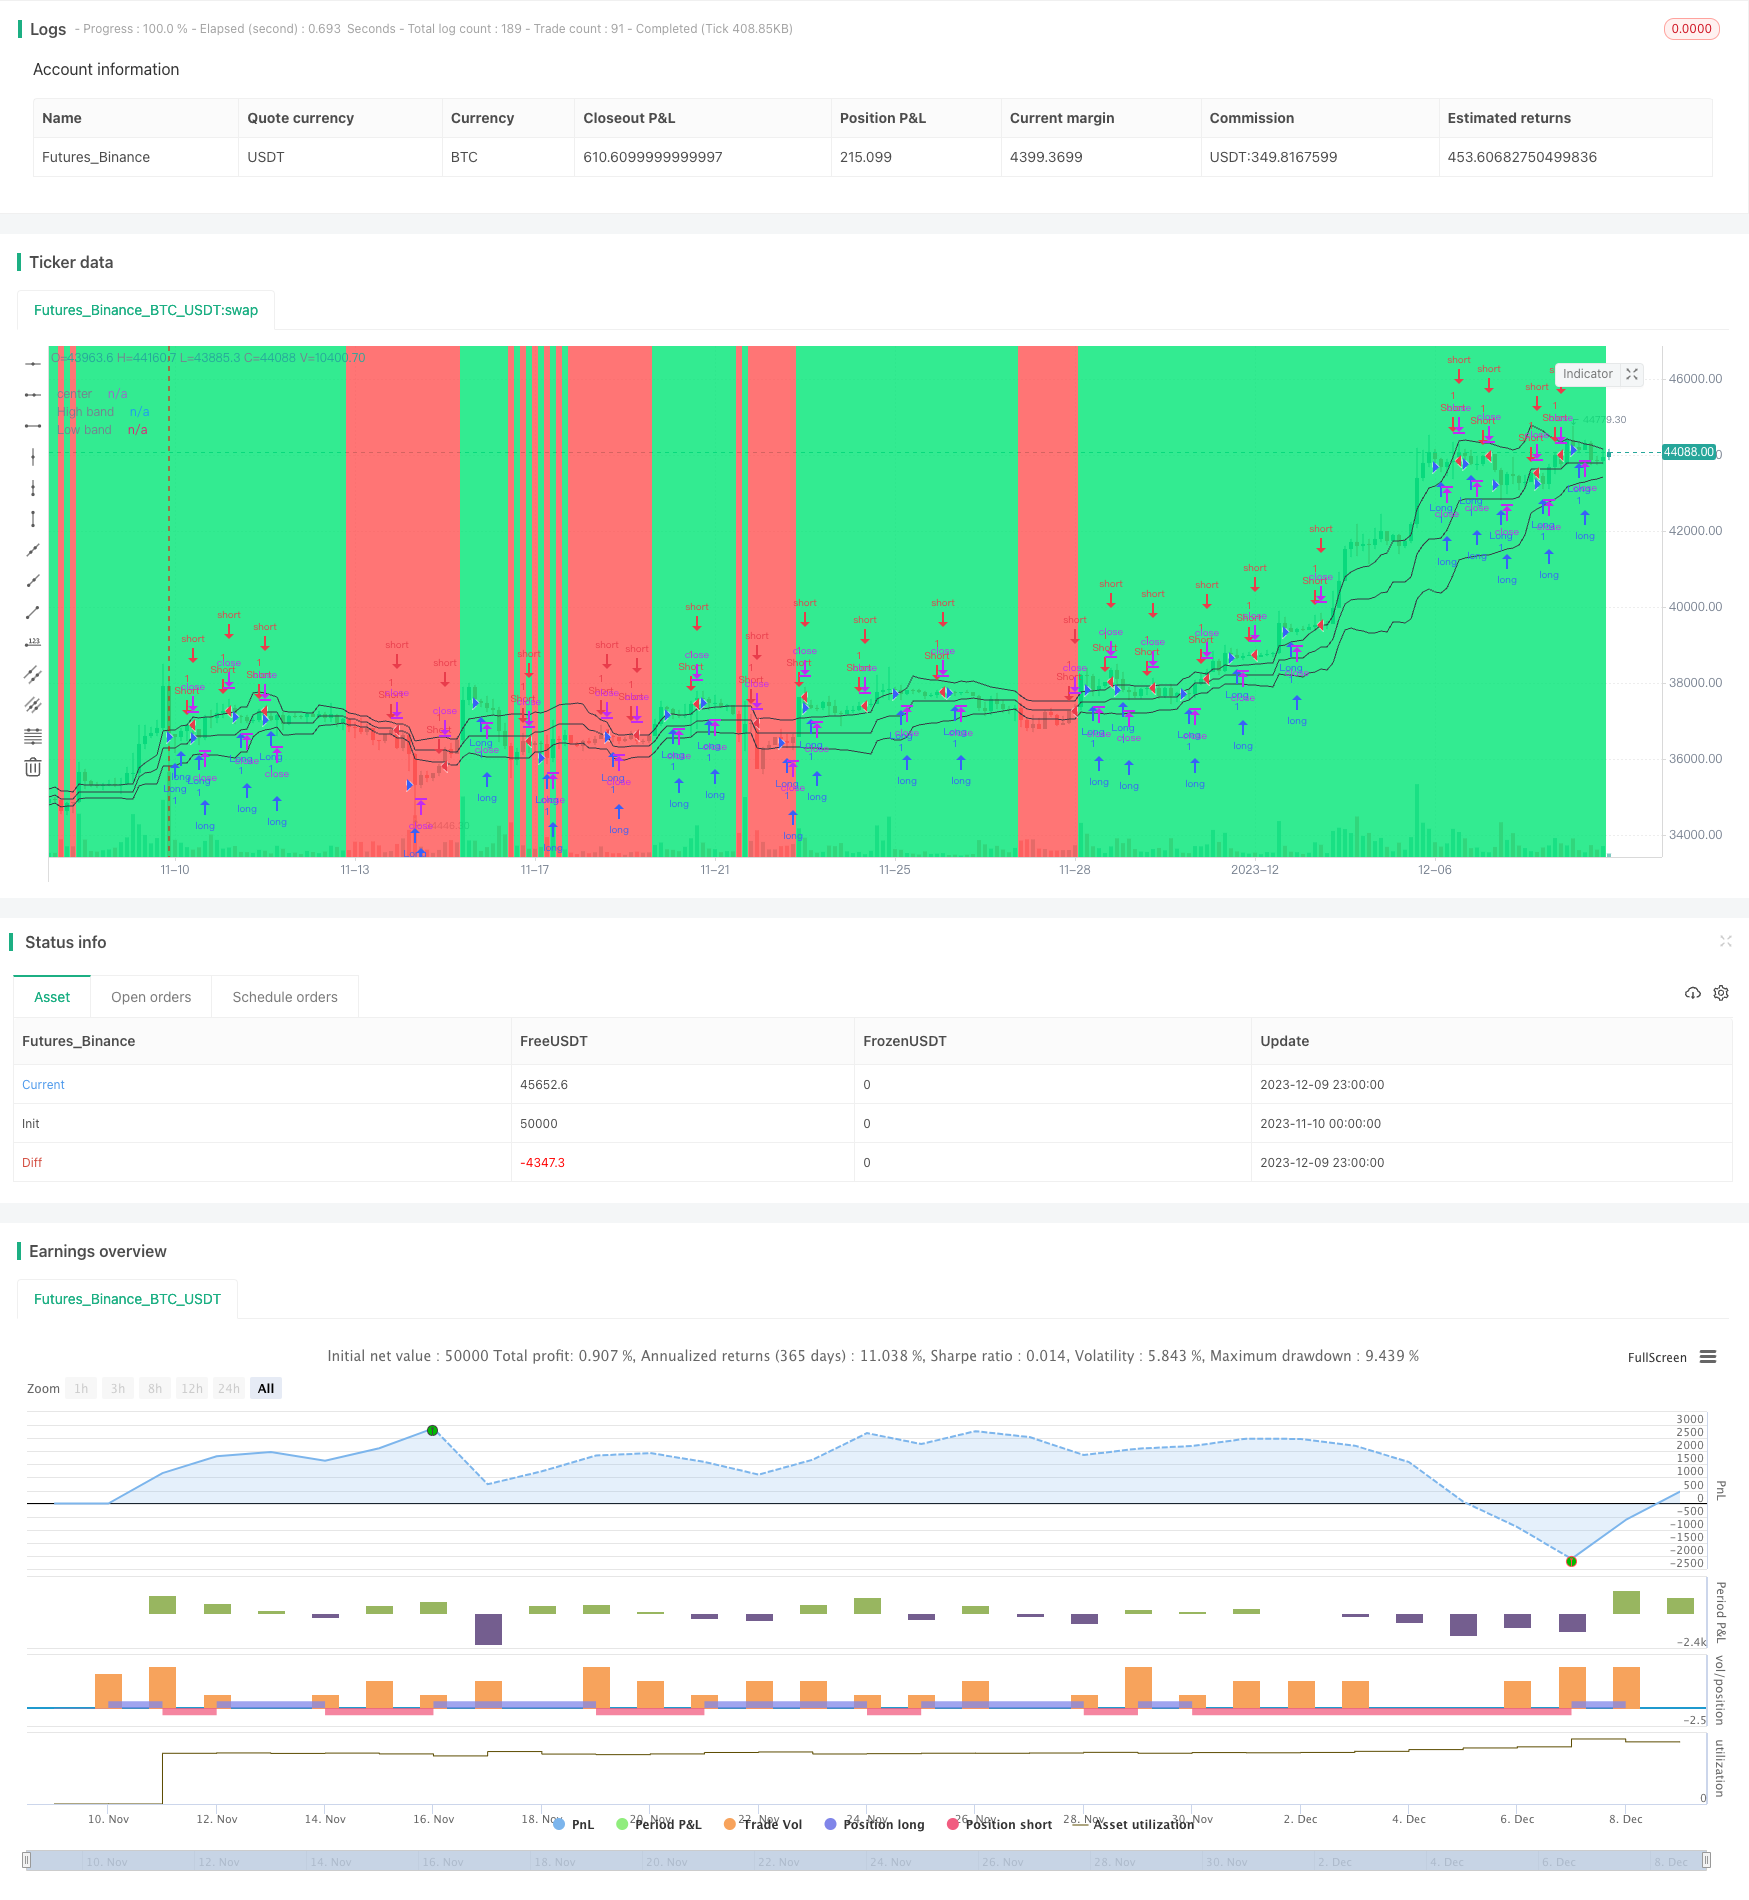
/*backtest
start: 2023-11-10 00:00:00
end: 2023-12-10 00:00:00
period: 3h
basePeriod: 15m
exchanges: [{"eid":"Futures_Binance","currency":"BTC_USDT"}]
*/


//@version=2
strategy("Noro's Bands Scalper Strategy v1.0", shorttitle = "Scalper str 1.0", overlay=true, default_qty_type = strategy.percent_of_equity, default_qty_value=100.0, pyramiding=0)

//Settings
needlong = input(true, defval = true, title = "Long")
needshort = input(true, defval = true, title = "Short")
len = input(20, defval = 20, minval = 2, maxval = 200, title = "Period")
needbb = input(true, defval = true, title = "Show Bands")
needbg = input(true, defval = true, title = "Show Background")
src = close

//PriceChannel
lasthigh = highest(src, len)
lastlow = lowest(src, len)
center = (lasthigh + lastlow) / 2

//Distance
dist = abs(src - center)
distsma = sma(dist, len)
hd = center + distsma
ld = center - distsma
hd2 = center + distsma * 2
ld2 = center - distsma * 2

//Trend
trend = close < ld and high < hd ? -1 : close > hd and low > ld ? 1 : trend[1]

//Lines
colo = needbb == false ? na : black
plot(hd, color = colo, linewidth = 1, transp = 0, title = "High band")
plot(center, color = colo, linewidth = 1, transp = 0, title = "center")
plot(ld, color = colo, linewidth = 1, transp = 0, title = "Low band")

//Background
col = needbg == false ? na : trend == 1 ? lime : red
bgcolor(col, transp = 80)

//Signals
bar = close > open ? 1 : close < open ? -1 : 0
up7 = trend == 1 and bar == -1 and bar[1] == -1 ? 1 : 0
dn7 = trend == 1 and bar == 1 and bar[1] == 1 and close > strategy.position_avg_price ? 1 : 0
up8 = trend == -1 and bar == -1 and bar[1] == -1 and close < strategy.position_avg_price ? 1 : 0
dn8 = trend == -1 and bar == 1 and bar[1] == 1 ? 1 : 0

if up7 == 1 or up8 == 1
    strategy.entry("Long", strategy.long, needlong == false ? 0 : trend == -1 ? 0 : na)

if dn7 == 1 or dn8 == 1
    strategy.entry("Short", strategy.short, needshort == false ? 0 : trend == 1 ? 0 : na)