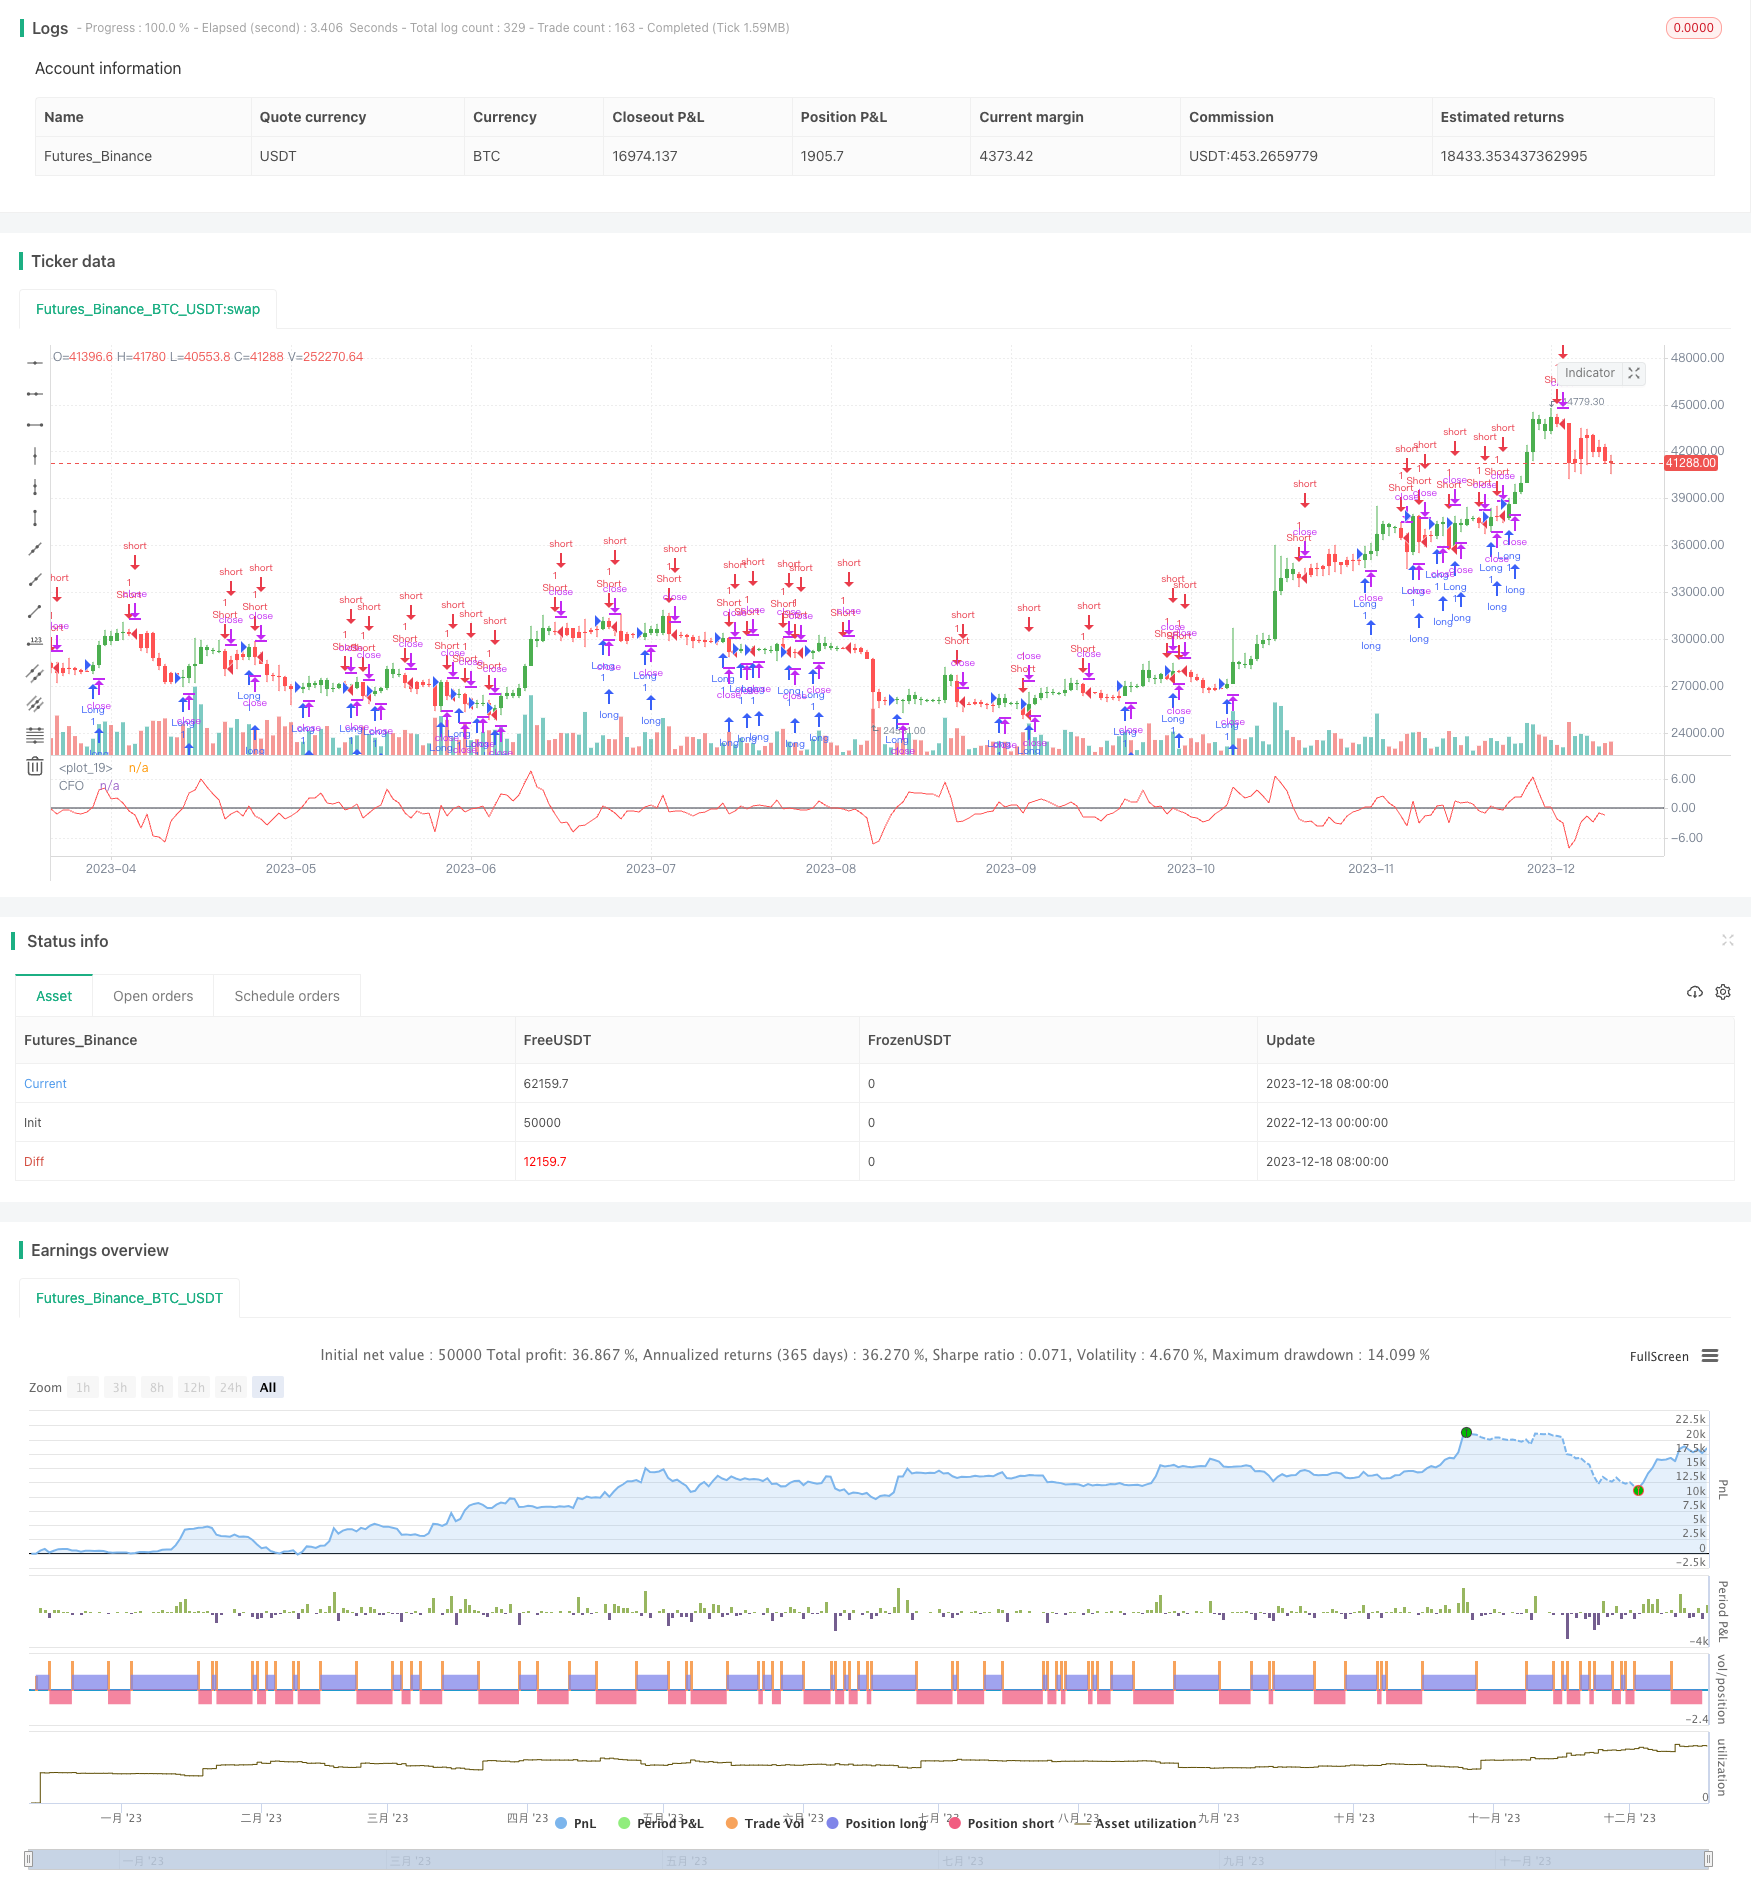
ターンポイント予測オシレーター バックテスト戦略
作者: リン・ハーンチャオチャン開催日:2023年12月20日 13:44:26タグ:

概要
この戦略は,トゥシャール・チャンデによって開発されたピボットポイント予測振動器をバックテストする.振動器は,閉値とn期間線形回帰予測価格の割合差を計算する. 予想価格が閉値よりも大きいとき0を超越し,低ければ0を下回る. これは,市場のターニングポイントを特定するために使用することができます.
戦略の論理
この戦略は,ピボットポイント予測オシレーターを使用して市場の方向性を決定する.具体的には,n 期間の線形回帰予測価格と実際の閉店価格の割合差を計算する. パーセント差が0を超えると,長くなってしまう. パーセント差が0を下回ると,短くなってしまう. 完全な取引論理は以下のとおりである:
- n 期間の線形回帰予測価格 xLG を計算する
- 閉じる価格と予想価格の%差を計算する xCFO
- xCFO と 0 と出力信号 possig の関係を決定する
- xCFO > 0 と long が許容される,possig = 1
- xCFO < 0 と短が許される,possig = -1
- そうでなければ possig = 0
- 信号に基づいて長か短か
戦略は単純で直線的です 市場が過大評価されているか過小評価されているか判断するために実際の価格と予測価格を比較し,取引信号を生成します
利点分析
この戦略には以下の利点があります.
- 論理が明確で 分かりやすく実行できます
- 数少ないパラメータで 調節が簡単です
- 時間枠の選択に柔軟性があり 異なる市場に対応できます
- 長いと短い間を切り替えるのに便利です
- 視覚的な指標は明確な取引信号を形成します.
リスク分析
この戦略にはいくつかのリスクもあります:
- 線形回帰予測は タイミングが悪いので 効果が維持されないかもしれません
- パラメータの不正な選択は,過剰な取引を引き起こす可能性があります.
- ブラック・スワン・イベントは 間違った信号を引き起こす可能性があります
対策:
- 線形回帰予測の有効性を確保するために他の指標と組み合わせる.
- パラメータを最適化して 取引頻度を下げる
- ストップロスを追加して単一の取引損失を制御します.
オプティマイゼーションの方向性
戦略は以下の点で改善できる:
- 取引信号を豊かにするために,MAやその他の指標と組み合わせます.
- ストップ・ロスを追加して 巨額の損失を回避します
- パラメータを最適化して 最高の組み合わせを見つけます
- オートマチックに 利益を取ります
- 取引コストを考慮し 合理的なストップロスを設定し 利益を得ます
結論
ピボットポイント予報振動器 (Pivot Point Forecast Oscillator) は,線形回帰予報価格を利用した量子取引戦略である.この戦略はシンプルな論理と柔軟なパラメータを有し,明確な取引信号を生成する.ストップ損失を最適化,パラメータ選択,他の指標信号を組み合わせ,より良い取引パフォーマンスを達成するためにさらなる改善の余地がある.
/*backtest
start: 2022-12-13 00:00:00
end: 2023-12-19 00:00:00
period: 1d
basePeriod: 1h
exchanges: [{"eid":"Futures_Binance","currency":"BTC_USDT"}]
*/

//@version=2
////////////////////////////////////////////////////////////
//  Copyright by HPotter v1.0 19/03/2018
// The Chande Forecast Oscillator developed by Tushar Chande The Forecast
// Oscillator plots the percentage difference between the closing price and
// the n-period linear regression forecasted price. The oscillator is above
// zero when the forecast price is greater than the closing price and less
// than zero if it is below.
//
// You can change long to short in the Input Settings
// WARNING:
//  - For purpose educate only
//  - This script to change bars colors.
////////////////////////////////////////////////////////////
strategy(title="Chande Forecast Oscillator Backtest", shorttitle="CFO")
Length = input(14, minval=1)
Offset = input(0)
reverse = input(false, title="Trade reverse")
hline(0, color=black, linestyle=line)
xLG = linreg(close, Length, Offset)
xCFO = ((close -xLG) * 100) / close
pos = iff(xCFO > 0, 1,
       iff(xCFO < 0, -1, nz(pos[1], 0)))
possig = iff(reverse and pos == 1, -1,
          iff(reverse and pos == -1, 1, pos))
if (possig == 1)
    strategy.entry("Long", strategy.long)
if (possig == -1)
    strategy.entry("Short", strategy.short)
barcolor(possig == -1 ? red: possig == 1 ? green : blue )
plot(xCFO, color=red, title="CFO")
もっと
- 動向平均に基づく戦略をフォローする傾向
- RSI トレーディング戦略
- トートル・トレンド・トレーディング・システム
- 複数の移動平均値のクロスオーバー取引戦略
- 柔軟なMA/VWAPクロスオーバー戦略,ストップ・ロス/テイク・プロフィート
- ボリンジャー・バンドに基づく価格アクション戦略
- 2つの移動平均範囲のブレークアウト戦略
- 移動平均線を持つグリッド戦略
- 二重移動平均知能追跡戦略
- RSI-EMA トレンドブレイク戦略
- 移動平均戦略に基づく統合されたイチモク・ケルトナー取引システム
- 二重追跡の亀取引戦略
- イチモク・キンコ・ヒョー ベースBTC取引戦略
- AO指標に基づく傾向 戦略をフォローする
- ユニバーサル・スナイパー戦略
- 二重指標ハイブリッド量的な取引戦略
- ボリンジャー・バンドス・モメンタム・ブレイクアウト戦略
- ボリンジャー・バンド 移動平均に基づく短期逆転量的な戦略
- グラデントMACD量子戦略
- 双方向の迅速量的な逆転取引戦略