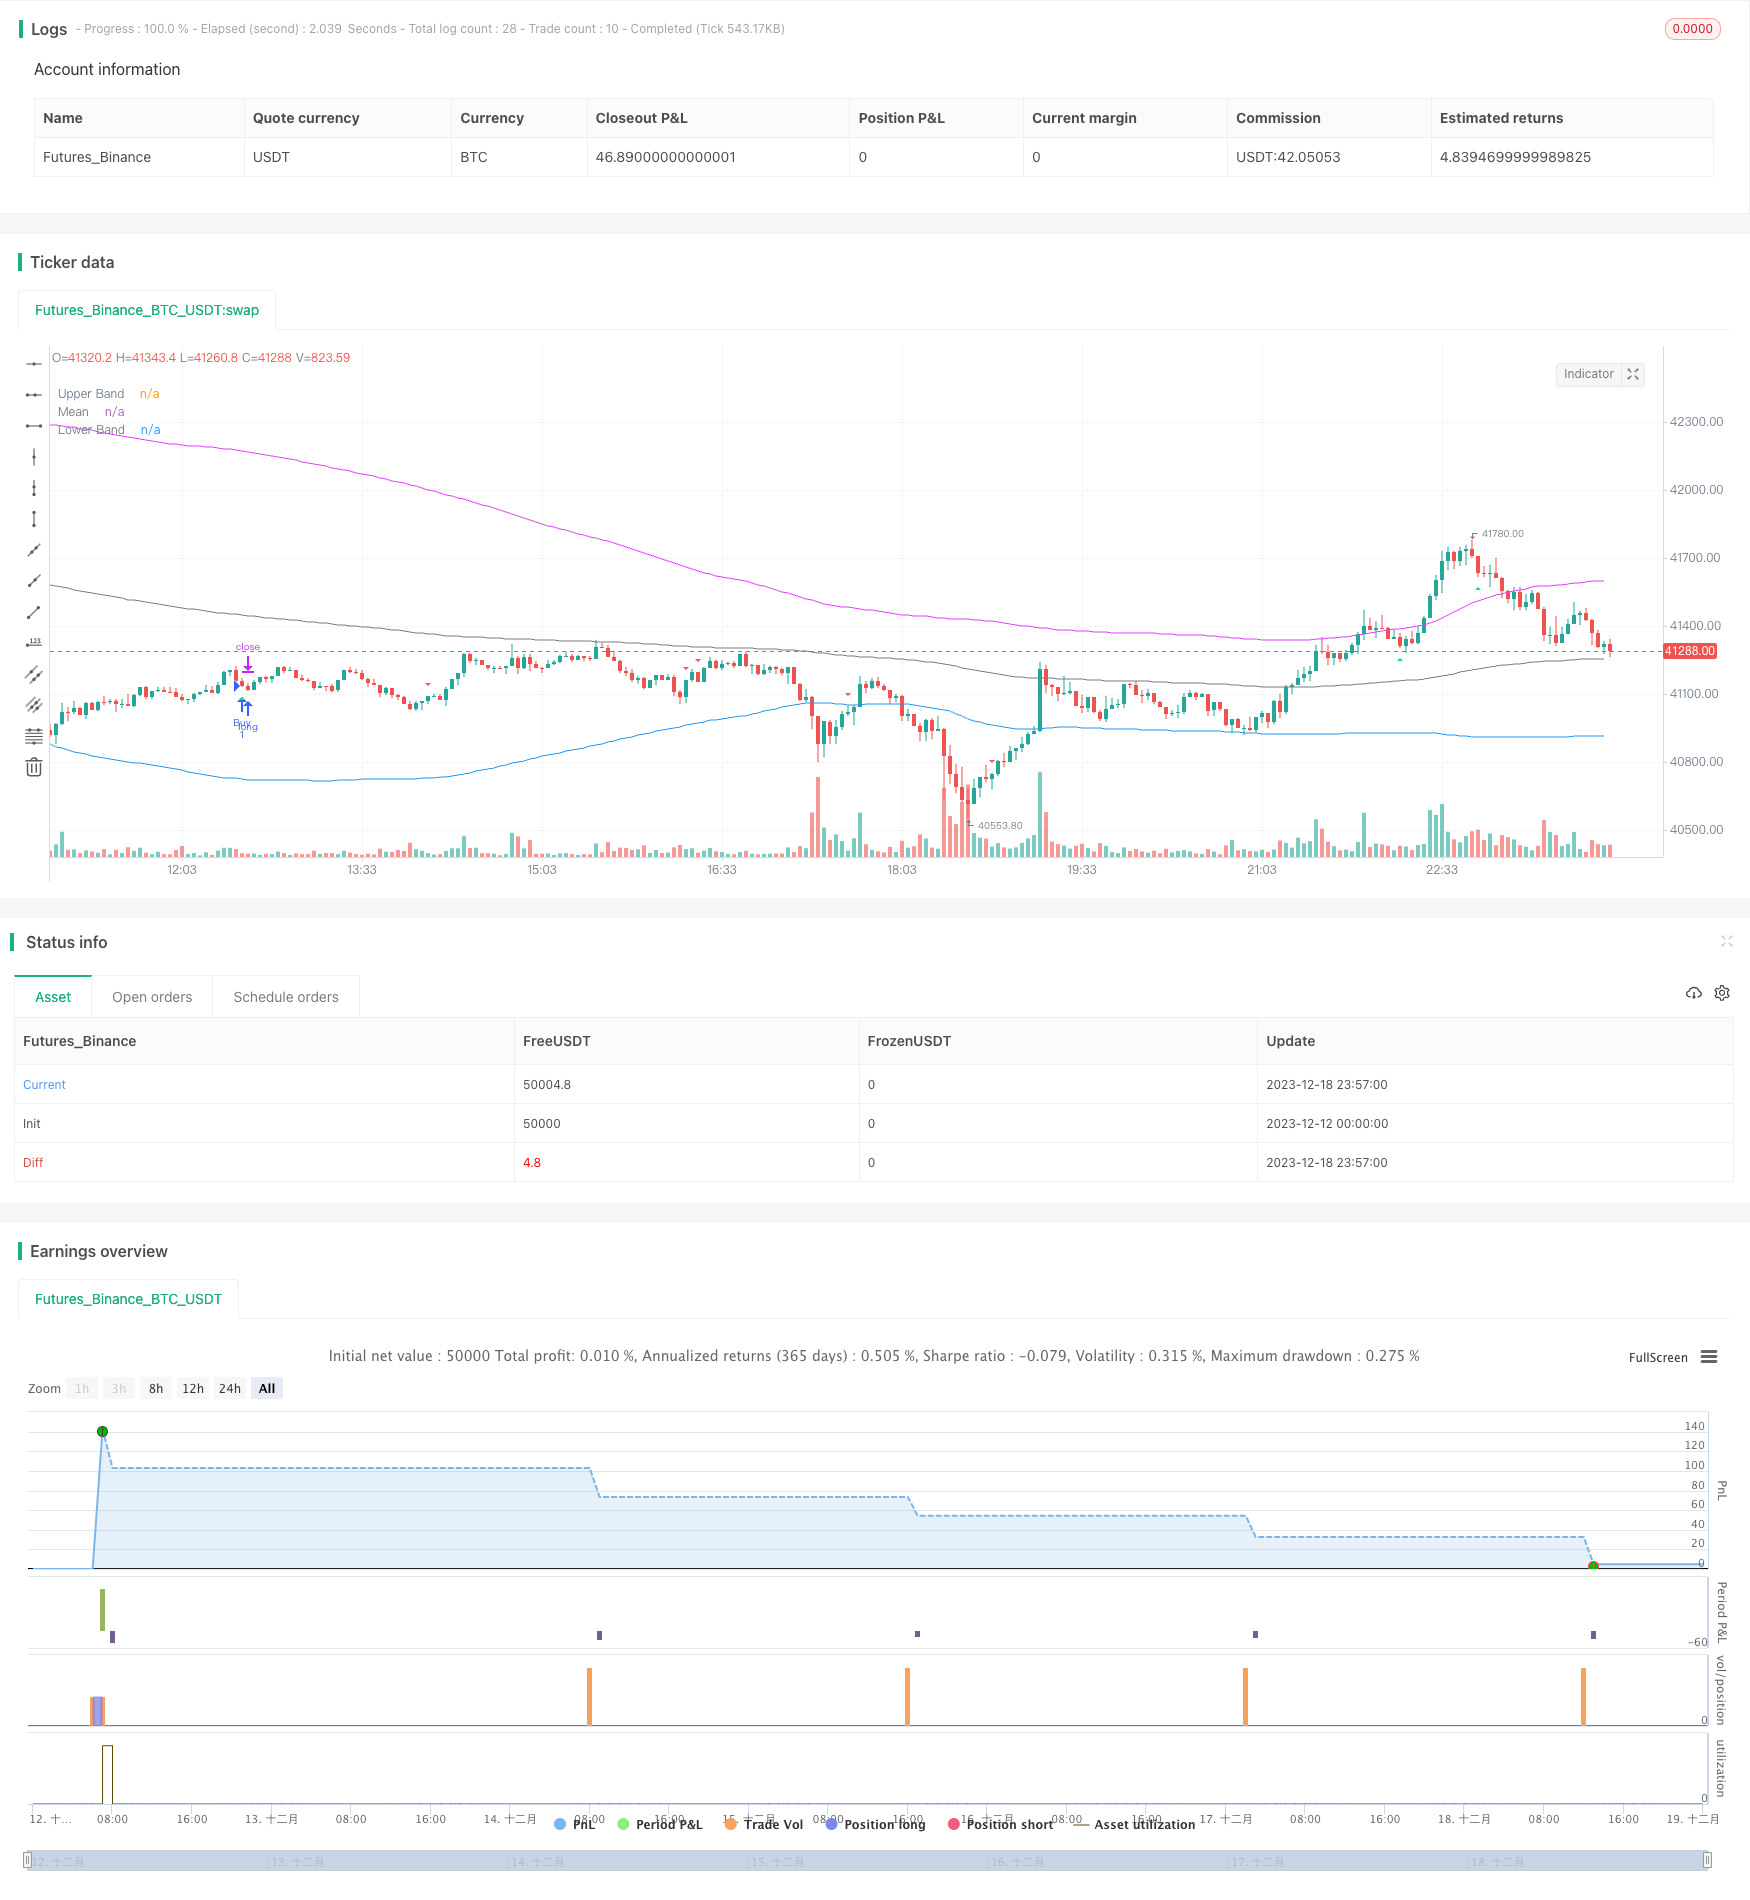
反転平均ブレイクアウト戦略

概要
逆転平均突破策は,複数の要因の組み合わせによるトレンド反転策である.移動平均,ブリン帯,CCI指標,RSI指標など,複数の技術指標を組み合わせて,価格が超買い超売り区域から反転する機会を捉えることを目的としている.この策は,正則散乱分析と組み合わせて,現在の傾向が以前のものと一致しているかどうかを検出し,取引の偽突破を避ける.
戦略原則
この戦略の核心的な論理は,価格が超買超売領域から反転したとき,適切な空白を多めにすることである.具体的には,戦略は,反転の機会を4つの側面から判断する.
CCI指数または動量指数は,金叉死叉信号を発し,超買超売を判断する.
RSI指標は,超買い超売り領域にあるかどうかを判断する. RSIが65以上は超買い領域,35未満は超売り領域である.
ブリン帯を上下軌道に利用して,価格が常時区域から逸脱しているかどうかを判断する.価格が常時区域に戻ると,逆転する可能性がある.
RSIの正散度を検出し,偽突破を追うのを避ける.
上記の条件が満たされると,戦略は逆方向の入場を行う。そして,ストップ・ロスの位置を設定し,リスクをコントロールする。
戦略的優位性
この戦略の最大の利点は,複数の指標を組み合わせて反転の機会を判断し,平均勝利率が高いことである.具体的には,主に以下の点がある.
多因子判断,信頼性が高い。単一の指標にのみ依存しないため,誤判の可能性を減らす。
逆転取引は勝てる可能性が高い.トレンドの逆転はより信頼性の高い取引方法である.
散歩を検知し,偽の突破を追求しないようにし,系統的リスクを軽減する.
止損メカニズムによるリスク管理.単一の損失を最大限に防ぐ.
リスクと解決
この戦略にはいくつかのリスクがあり,以下のような点に重点を置いています.
逆転時刻判断は不正確である。結果として止損が誘発される。適切な止損範囲を拡大することができる。
ブリン帯のパラメータ設定は不適切で,正常価格を異常とみなす.市場の変動率の設定パラメータと連携すべきである.
取引回数が多くなる可能性がある.CCIなどの判断パラメータの範囲を適切に拡大し,取引頻度を減らす.
多空平衡は大きく異なる可能性がある.指標パラメータが合理的かどうかを歴史的データに基づいて判断すべきである.
最適化の方向
この戦略は以下の方向から最適化できます.
機械学習アルゴリズムを使用して指標パラメータを自動最適化.人工経験の誤差を回避.
岩石の指標,幅の指標などで,超買超売の強さを判断する.
取引量指数で逆転の信頼性を判断する.例えば取引量,保有データなど.
市場情勢を判断するブロックチェーンデータと組み合わせる. 戦略の適応性を向上させる.
市場変動の変動に応じてストップポイントを調整する.
要約する
逆転平均値突破戦略は,逆転の機会を判断するために複数の指標を総合的に使用する.リスクがコントロールされている前提で,その勝利の確率は高い.この戦略は,強力な実用性があり,さらに最適化の余地もある.パラメータが適切に設定された場合,比較的理想的な効果が得られるべきである.
/*backtest
start: 2023-12-12 00:00:00
end: 2023-12-19 00:00:00
period: 3m
basePeriod: 1m
exchanges: [{"eid":"Futures_Binance","currency":"BTC_USDT"}]
*/

//@version=5
strategy(title='BroTheJo Strategy', shorttitle='BTJ INV', overlay=true)

// Input settings
stopLossInPips = input.int(10, minval=0, title='Stop Loss (in Pips)')
ccimomCross = input.string('CCI', 'Entry Signal Source', options=['CCI', 'Momentum'])
ccimomLength = input.int(10, minval=1, title='CCI/Momentum Length')
useDivergence = input.bool(false, title='Find Regular Bullish/Bearish Divergence')
rsiOverbought = input.int(65, minval=1, title='RSI Overbought Level')
rsiOversold = input.int(35, minval=1, title='RSI Oversold Level')
rsiLength = input.int(14, minval=1, title='RSI Length')
plotMeanReversion = input.bool(true, 'Plot Mean Reversion Bands on the chart')
emaPeriod = input(200, title='Lookback Period (EMA)')
bandMultiplier = input.float(1.6, title='Outer Bands Multiplier')

// CCI and Momentum calculation
momLength = ccimomCross == 'Momentum' ? ccimomLength : 10
mom = close - close[momLength]
cci = ta.cci(close, ccimomLength)
ccimomCrossUp = ccimomCross == 'Momentum' ? ta.cross(mom, 0) : ta.cross(cci, 0)
ccimomCrossDown = ccimomCross == 'Momentum' ? ta.cross(0, mom) : ta.cross(0, cci)

// RSI calculation
src = close
up = ta.rma(math.max(ta.change(src), 0), rsiLength)
down = ta.rma(-math.min(ta.change(src), 0), rsiLength)
rsi = down == 0 ? 100 : up == 0 ? 0 : 100 - 100 / (1 + up / down)
oversoldAgo = rsi[0] <= rsiOversold or rsi[1] <= rsiOversold or rsi[2] <= rsiOversold or rsi[3] <= rsiOversold
overboughtAgo = rsi[0] >= rsiOverbought or rsi[1] >= rsiOverbought or rsi[2] >= rsiOverbought or rsi[3] >= rsiOverbought

// Regular Divergence Conditions
bullishDivergenceCondition = rsi[0] > rsi[1] and rsi[1] < rsi[2]
bearishDivergenceCondition = rsi[0] < rsi[1] and rsi[1] > rsi[2]

// Mean Reversion Indicator
meanReversion = plotMeanReversion ? ta.ema(close, emaPeriod) : na
stdDev = plotMeanReversion ? ta.stdev(close, emaPeriod) : na
upperBand = plotMeanReversion ? meanReversion + stdDev * bandMultiplier : na
lowerBand = plotMeanReversion ? meanReversion - stdDev * bandMultiplier : na

// Entry Conditions
prevHigh = ta.highest(high, 1)
prevLow = ta.lowest(low, 1)
shortEntryCondition = ccimomCrossUp and oversoldAgo and (not useDivergence or bullishDivergenceCondition) and (prevHigh >= meanReversion) and (prevLow >= meanReversion)
longEntryCondition = ccimomCrossDown and overboughtAgo and (not useDivergence or bearishDivergenceCondition) and (prevHigh <= meanReversion) and (prevLow <= meanReversion)

// Plotting
oldShortEntryCondition = ccimomCrossUp and oversoldAgo and (not useDivergence or bullishDivergenceCondition)
oldLongEntryCondition = ccimomCrossDown and overboughtAgo and (not useDivergence or bearishDivergenceCondition)
plotshape(oldLongEntryCondition, title='BUY', style=shape.triangleup, text='B', location=location.belowbar, color=color.new(color.lime, 0), textcolor=color.new(color.white, 0), size=size.tiny)
plotshape(oldShortEntryCondition, title='SELL', style=shape.triangledown, text='S', location=location.abovebar, color=color.new(color.red, 0), textcolor=color.new(color.white, 0), size=size.tiny)

// Strategy logic
if (longEntryCondition)
    stopLoss = close - stopLossInPips
    strategy.entry("Buy", strategy.long)
    strategy.exit("exit", "Buy", stop=stopLoss)
if (shortEntryCondition)
    stopLoss = close + stopLossInPips
    strategy.entry("Sell", strategy.short)
    strategy.exit("exit", "Sell", stop=stopLoss)

// Close all open positions when outside of bands
closeAll = (high >= upperBand) or (low <= lowerBand)

if (closeAll)
    strategy.close_all("Take Profit/Cut Loss")

// Plotting
plot(upperBand, title='Upper Band', color=color.fuchsia, linewidth=1)
plot(meanReversion, title='Mean', color=color.gray, linewidth=1)
plot(lowerBand, title='Lower Band', color=color.blue, linewidth=1)