ダイナミック・トラッキング・ストップ・ロスの戦略
作者: リン・ハーンチャオチャン開催日:2023年12月29日 10:42:27タグ:

概要
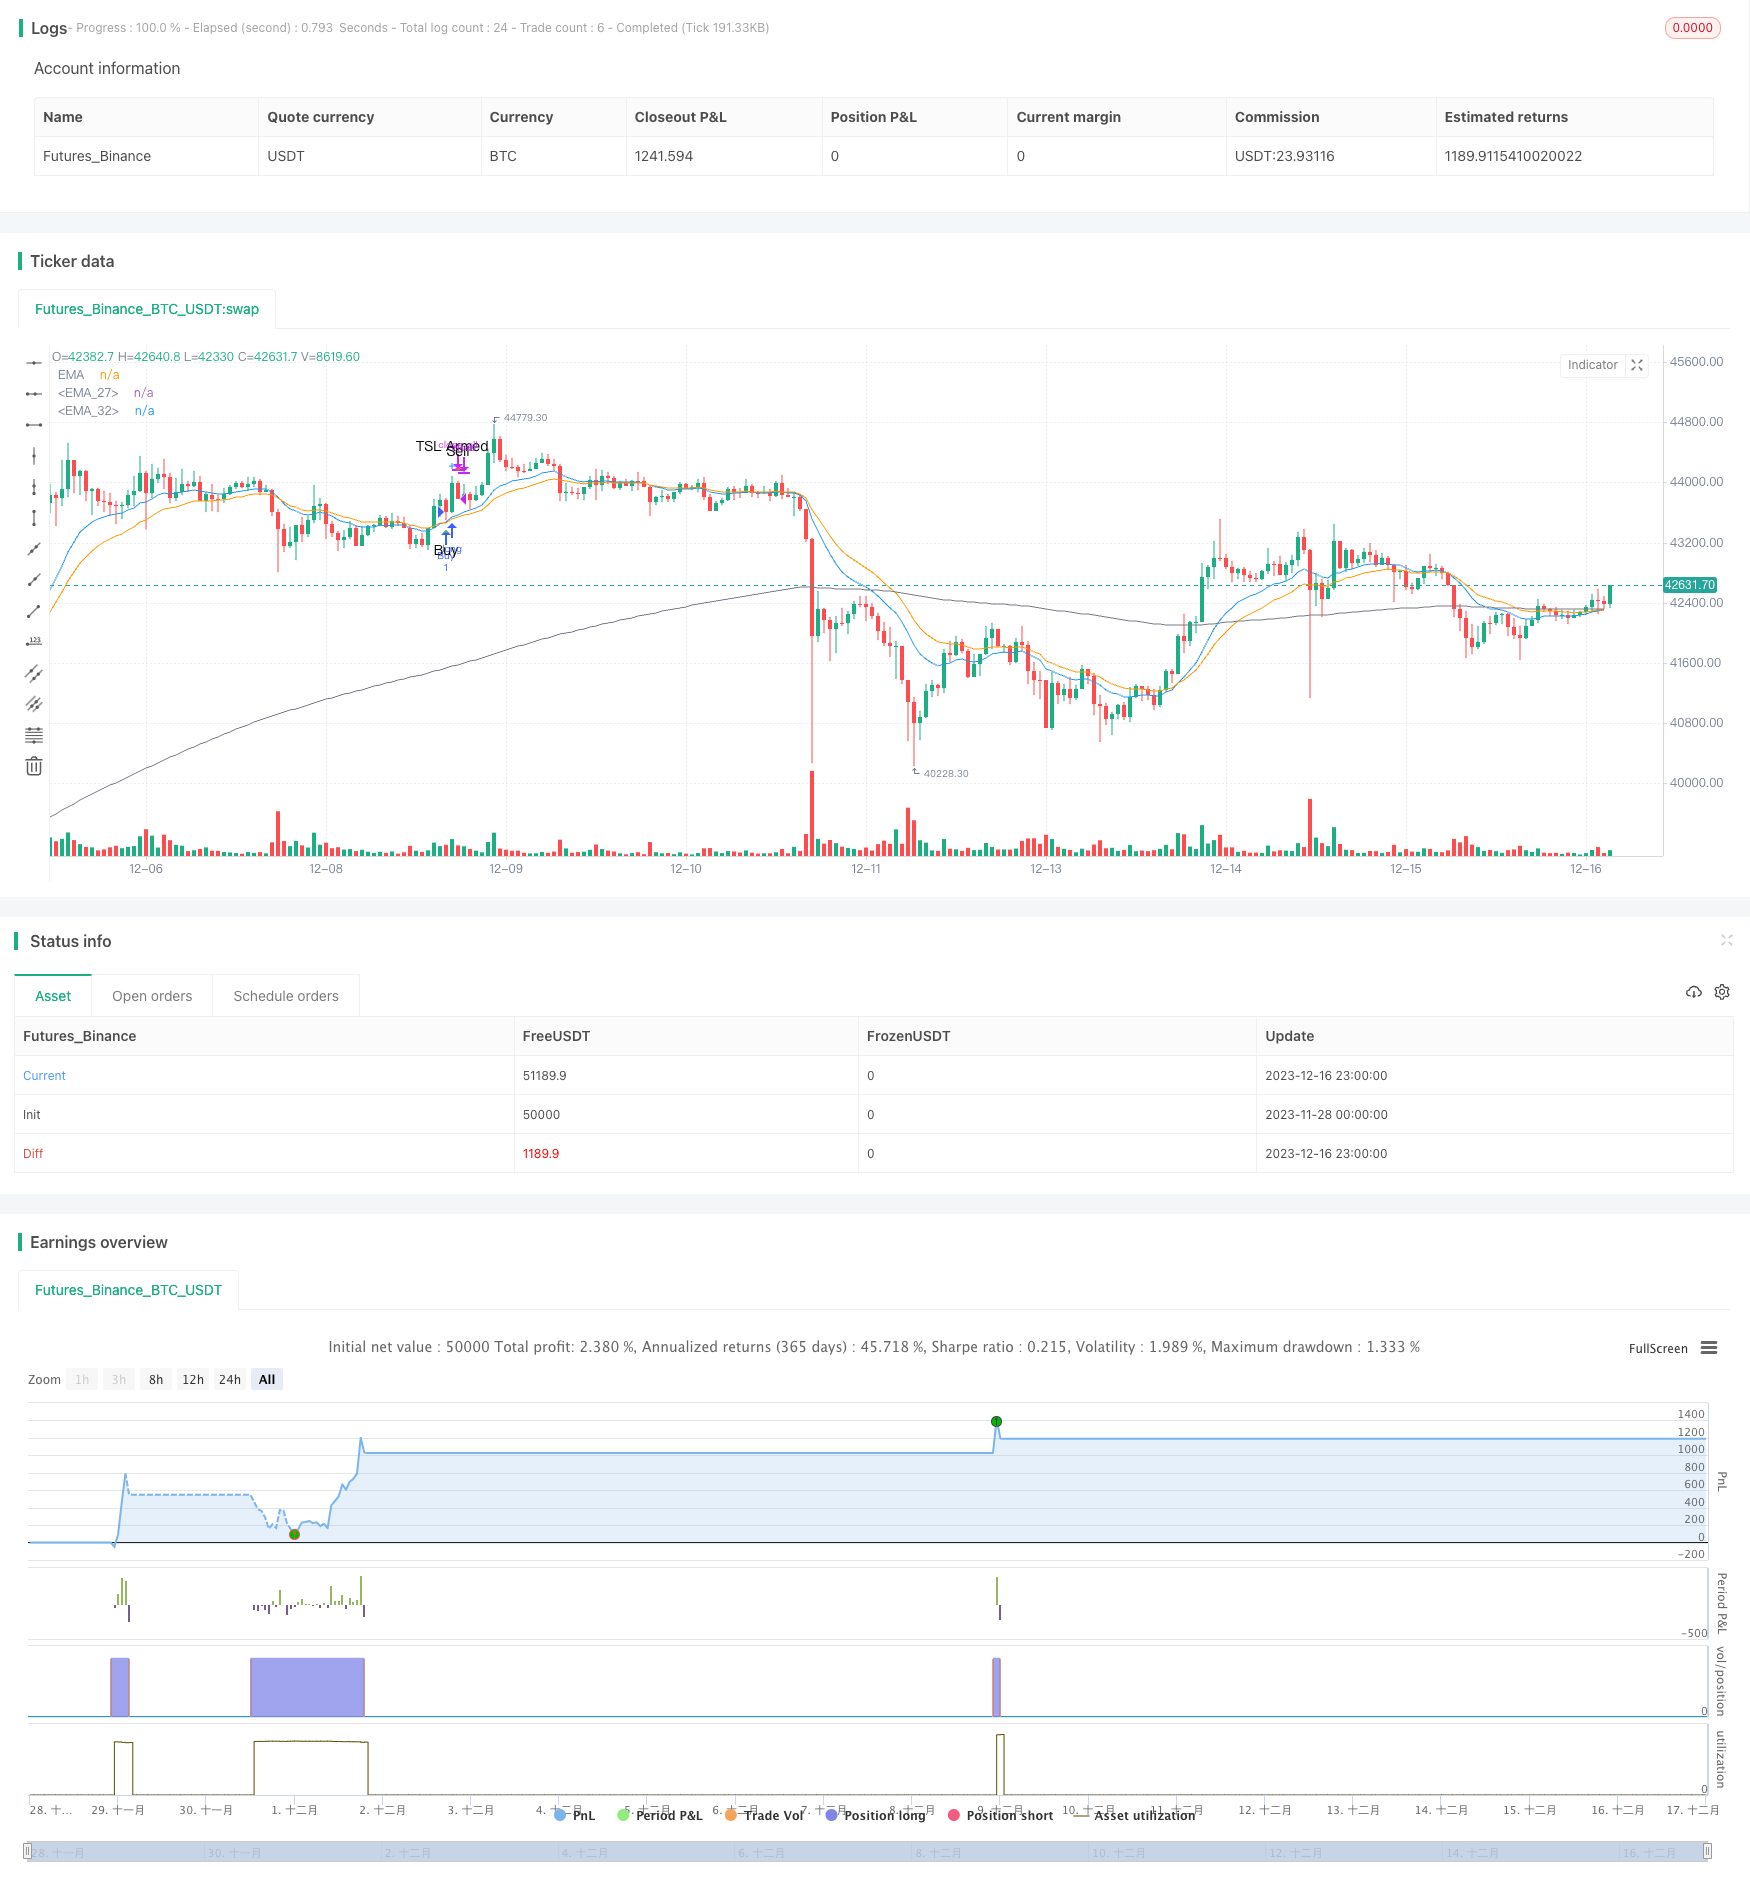
ダイナミック・トレイル・ストップ・ロスの戦略は,トレイル・ストップ・ロスのメカニズムを利用した定量的な取引戦略である.トレンド・トラッキング理論に基づいてトレイル・ストップ・ロスのラインを設定し,ストップ・ロスを確認し,トレイル・ストップ・ロスを調整する.主に単一の取引のストップ・ロスを制御し,利益ロックを最大化し,取引リスクを軽減するために使用される.
戦略の論理
ダイナミック・トレイルストップ・ロスの戦略の核心は,最初のストップ・ロスの距離,トレイルストップ・ロスの距離,トレイルストップ・ロスのトリガー距離という3つのキーパラメータを設定することにある.購入信号がトリガーされた後,初期ストップ・ロスの価格はエントリー価格と設定された初期ストップ・ロスの距離に基づいて計算される.その後,各バーがトレイルストップ・ロスのトリガー条件が満たされているかどうかを判断する.もしそうであれば,新しいトレイルストップ・ロスの価格が設定される.新しいトレイルストップ・ロスの価格は現在の閉値とトレイルストップ・ロスの距離に基づいて計算される.したがって,価格が有利な方向に走る限り,トレイルストップ・ロスの線は利益をロックするために上昇し続ける.価格逆転がトレイルストップ・ロスの線をトリガーすると,セール・シグナルが生成される.
この戦略には,低ストップ損失も含まれています.トレーリングストップ損失がアクティベーションされているかどうかに関わらず,価格が低ストップ損失を下回ると,ストップ損失が直接トリガーされます.低ストップ損失は突然の出来事によって引き起こされる価格ギャップから守るために役立ちます.したがって,ダブルラインストップ損失の形態のダイナミックストップ損失メカニズムを通じて,ストップ損失線は過剰な損失を防ぐと同時に,有利なトレンドを自動的に追跡することができます.
利点
-
ストップ・ロスを引き継いで利益を継続的にロックし,リトラクセーションの余裕を与えないようにします.
-
ストップ・ロスの線を迅速に追跡できるように,双線ストップ・ロスの構造を採用し,過剰な損失を防ぐ.
-
ストップ損失調整のための連続判断メカニズムを使用し,操作が簡単で実行が簡単です.
-
ストップロスの有効性を向上させるために,パラメータは市場とストック特性に合わせて最適化できます.
-
市場動向を予測する必要はありません 動向をフォローするだけです
リスク
-
不適切なパラメータ設定は,あまりにも緩いまたはあまりにも緊密なストップ損失を引き起こす可能性があります.あまりにも緩いストップ損失は無効になり,あまりにも緊密なストップ損失は通常の価格変動によって停止される傾向があります.
-
突然の出来事による価格格差の場合,損失を止めることができない可能性があります.それに応じて他の保護措置をとるべきです.
-
ストップ・ロスの線が起動した後,取引コストとスライドが実際の販売価格に影響を与える可能性があります.
-
適応力は強くない. 範囲制限の動きなど,特定の段階ではうまく機能しない.
対策:
- バックテストと実況の結果に基づいてパラメータを継続的に最適化することが推奨されます.
- 価格格差を防ぐために ストップロスの幅がより低く設定します
- ストップ・ロスの価格を計算する際には,取引コストとスリップを考慮する.
- 傾向指標と変動指標と組み合わせて使用する.
最適化 に 関する 指示
-
ストップ・ロスの線を変化の割合で調整し,異なる価格レベルでの価格動きをより正確に追跡できます.
-
高波動に直面したときにストップロスを停止するために波動性メトリックを追加し,通常の変動がストップロスを引き起こすのを避ける.
-
機械学習によるパラメータの自動最適化.トレーニングサンプルとして最近のパラメータの異なる組み合わせの返事を選択する.
-
トレンド,サポート,レジスタンスなどの指標を考慮してオープンポジション基準を追加します.
結論
ダイナミック・トレイル・ストップ・ロスの戦略は,ストップ・ロスを確認し,価格変化に基づいてトレイル・ストップ・ロスを調整するために,ダブルライン・ストップ・ロスのメカニズムを通じてトレイル・ストップ・ロスのラインを設定する.利益をロックし,引き下げを削減し,損失を制御するためにストップ・ロスの距離を自動的に調整することができます. シンプルな操作と簡単な実装により,この戦略は市場の状況に基づいてさらに最適化され,より良いパフォーマンスを得る他の戦略と一緒に使用できます. しかし,いくつかの制限もあります. ライブ・トレーディングに適用する前に十分に改善してテストすることがお勧めです.
/*backtest
start: 2023-11-28 00:00:00
end: 2023-12-17 00:00:00
period: 1h
basePeriod: 15m
exchanges: [{"eid":"Futures_Binance","currency":"BTC_USDT"}]
*/

// This source code is subject to the terms of the Mozilla Public License 2.0 at https://mozilla.org/MPL/2.0/
// © Thumpyr
//@version=5

/////////////////////////////////////////////////////////////////////////////////////////////
// Comment out Strategy Line and remove // from Indicator line to turn into Indicator  //////
// Do same for alertConidction at bottom                                               //////
/////////////////////////////////////////////////////////////////////////////////////////////
strategy("PCT Trailing Stoploss-Strategy", shorttitle="PCT Trailing Stoploss- Strategy", overlay=true)
//indicator(title="PCT Trailing Stoploss- Indicator", shorttitle="PCT Trailing Stoploss - Indicator", timeframe="", timeframe_gaps=true, overlay=true)//

sellLow=input.float(.035, minval=0, title="Stop Loss Loss: 1% = .01", group="Sell Settings")
trailStopArm=input.float(.0065, minval=0, title="Trailing Stop Arm: 1%=.01", group="Sell Settings")
trailStopPct=input.float(.003, minval=0, title="Trailing Stop Trigger: 1%=.01 ", group="Sell Settings")

/////////////////////////////////////////////////
//               Indicators                    //
/////////////////////////////////////////////////
ema1Len = input.int(14, minval=1, title=" ema 1 Length", group="Trend Line Settings")
ema1Src = input(close, title="ema 1 Source", group="Trend Line Settings")
ema1 = ta.ema(ema1Src, ema1Len)
plot(ema1, title="EMA", color=color.blue)

ema2Len = input.int(22, minval=1, title=" ema 2 Length", group="Trend Line Settings")
ema2Src = input(close, title="ema 2 Source", group="Trend Line Settings")
ema2 = ta.ema(ema2Src, ema2Len)
plot(ema2, title="EMA", color=color.orange)

ema3Len = input.int(200, minval=1, title=" ema 3 Length", group="Trend Line Settings")
ema3Src = input(close, title="ema 2 Source", group="Trend Line Settings")
ema3 = ta.ema(ema3Src, ema3Len)
plot(ema3, title="EMA", color=color.gray)


/////////////////////////////
////   Buy Conditions    ////
/////////////////////////////

alertBuy = ta.crossover(ema1,ema2) and close>ema3

////////////////////////////////////////////////////////////////////
////   Filter redundant Buy Signals if Sell has not happened    ////
////////////////////////////////////////////////////////////////////
var lastsignal = 0
showAlertBuy = 0
if(alertBuy and lastsignal !=1)
    showAlertBuy  := 1
    lastsignal      := 1
buyAlert= showAlertBuy > 0


//////////////////////////////////////////////////////////////////
////          Track Conditions at buy Signal                  ////
//////////////////////////////////////////////////////////////////

alertBuyValue = ta.valuewhen(buyAlert, close,0)
alertSellValueLow = alertBuyValue - (alertBuyValue*sellLow)

////////////////////////////////////////////////////////////
/////            Trailing Stop                         /////
////////////////////////////////////////////////////////////
var TSLActive=0         //Check to see if TSL has been activated
var TSLTriggerValue=0.0 //Initial and climbing value of TSL
var TSLStop = 0.0       //Sell Trigger
var TSLRunning =0       //Continuously check each bar to raise TSL or not

//  Check if a Buy has been triggered and set initial value for TSL //
if buyAlert
    TSLTriggerValue := alertBuyValue+(alertBuyValue*trailStopArm)
    TSLActive := 0
    TSLRunning :=1
    TSLStop := TSLTriggerValue - (TSLTriggerValue*trailStopPct)


//  Check that Buy has triggered and if Close has reached initial TSL//
//  Keeps from setting Sell Signal before TSL has been armed w/TSLActive//
beginTrail=TSLRunning==1 and TSLActive==0 and close>alertBuyValue+(alertBuyValue*trailStopArm) and ta.crossover(close,TSLTriggerValue)
if beginTrail
    TSLTriggerValue :=close
    TSLActive :=1
    TSLStop :=TSLTriggerValue - (TSLTriggerValue*trailStopPct)

//  Continuously check if TSL needs to increase and set new value //
runTrail= TSLActive==1 and (ta.crossover(close,TSLTriggerValue) or close>=TSLTriggerValue)
if runTrail
    TSLTriggerValue :=close
    TSLStop :=TSLTriggerValue - (TSLTriggerValue*trailStopPct)

//  Verify that TSL is active and trigger when close cross below TSL Stop//
TSL=TSLActive==1 and (ta.crossunder(close,TSLStop) or (close[1]>TSLStop and close<TSLStop))

// Plot point of inital arming of TSL//
TSLTrigger=TSLActive==1 and TSLActive[1]==0
plotshape(TSLTrigger, title='TSL Armed', location=location.abovebar, color=color.new(color.blue, 0), size=size.small, style=shape.cross, text='TSL Armed')


////////////////////////////////////////////////////////////
// Plots used for troubleshooting and verification of TSL //
////////////////////////////////////////////////////////////
//plot(TSLActive,"Trailing Stop", color=#f48fb1)
//plot(TSLRunning,"Trailing Stop", color=#f48fb1)
//plot(TSLTriggerValue,"Trailing Stop Trigger", color.new(color=#ec407a, transp = TSLRunning==1 ? 0 : 100))
//plot(TSLStop,"Trailing Stop", color.new(color=#f48fb1, transp = TSLRunning==1 ? 0 : 100))//


////////////////////////////////////////////////////////////
/////             Sell Conditions                    ///////
////////////////////////////////////////////////////////////
Sell1 = TSL
Sell2 = ta.crossunder(close,alertSellValueLow)

alertSell= Sell1 or Sell2
////////////////////////////////////////////////////////////

////////////////////////////////////////////////////////////
////        Remove Redundant Signals                    ////
////////////////////////////////////////////////////////////
showAlertSell = 0
if(alertSell and lastsignal != -1)
    showAlertSell := 1
    lastsignal      := -1
sellAlert= showAlertSell > 0

if sellAlert
    TSLActive :=0
    TSLRunning :=0

/////////////////////////////////////////
//  Plot Buy and Sell Shapes on Chart  //
/////////////////////////////////////////
plotshape(buyAlert, title='Buy', location=location.belowbar, color=color.new(color.green, 0), size=size.small, style=shape.triangleup, text='Buy')
plotshape(sellAlert, title='Sell', location=location.abovebar, color=color.new(color.red, 0), size=size.small, style=shape.triangledown, text='Sell')

/////////////////////////////////////////////////////////////////////////////////////////////
//                        Remove // to setup for Indicator                                 //
/////////////////////////////////////////////////////////////////////////////////////////////
//Alerts
//alertcondition(title='Buy Alert', condition=buyAlert, message='Buy Conditions are Met')
//alertcondition(title='Sell Alert', condition=sellAlert, message='Sell Conditions are Met')
/////////////////////////////////////////////////////////////////////////////////////////////


////////////////////////////////////////////////////////////
////  Comment out this section if setup as Indicator    ////
////////////////////////////////////////////////////////////
longCondition = buyAlert
if (longCondition)
    strategy.entry("Buy", strategy.long)
    alert(message='Buy', freq=alert.freq_once_per_bar_close)

shortCondition = sellAlert
if (shortCondition)
    strategy.close_all(sellAlert,"Sell")
    alert(message='Sell', freq=alert.freq_once_per_bar_close)
/////////////////////////////////////////////////////////////
- イチモク・クラウドベースのダイナミック・トレイル・ストップ最適化戦略
- 複数の指標に基づいた高/低仮想通貨戦略
- VWAP-RSI 超売れたCrossunder BTC ショート戦略
- 線形回帰交差をベースにした量子戦略
- 平均逆転線戦略
- フィボナッチ HMA AI 買って売るシグナル戦略
- 3つの内向的な逆転戦略
- 定量取引の二重移動平均戦略
- パインスクリプトにおけるレバレッジRSI戦略
- 量的な取引の逆転傾向 コンボ T3-CCI戦略
- スロー RSI OB/OS 戦略
- 多指標性適応トレンド取引戦略
- 相対量価格戦略
- 戦略をフォローする緩やかなストカスティックトレンド
- 複数の指標に基づく包括的な量的な取引戦略
- パラボリック・ストップ・アンド・レザーブ・マルチインジケータ・トレーディング・戦略
- プレミアム・ダブル・トレンド・フィルター・MA比率戦略
- 2つの移動平均の収束傾向を追跡する戦略
- トリプル・EMA・クロスオーバー・ブレイクアウト戦略
- ボリンジャー・バンドに基づく定量的な取引戦略