チェンデリア 脱出戦略
作者: リン・ハーンチャオチャン開催日:2024年01月05日 15:57:51タグ:

概要
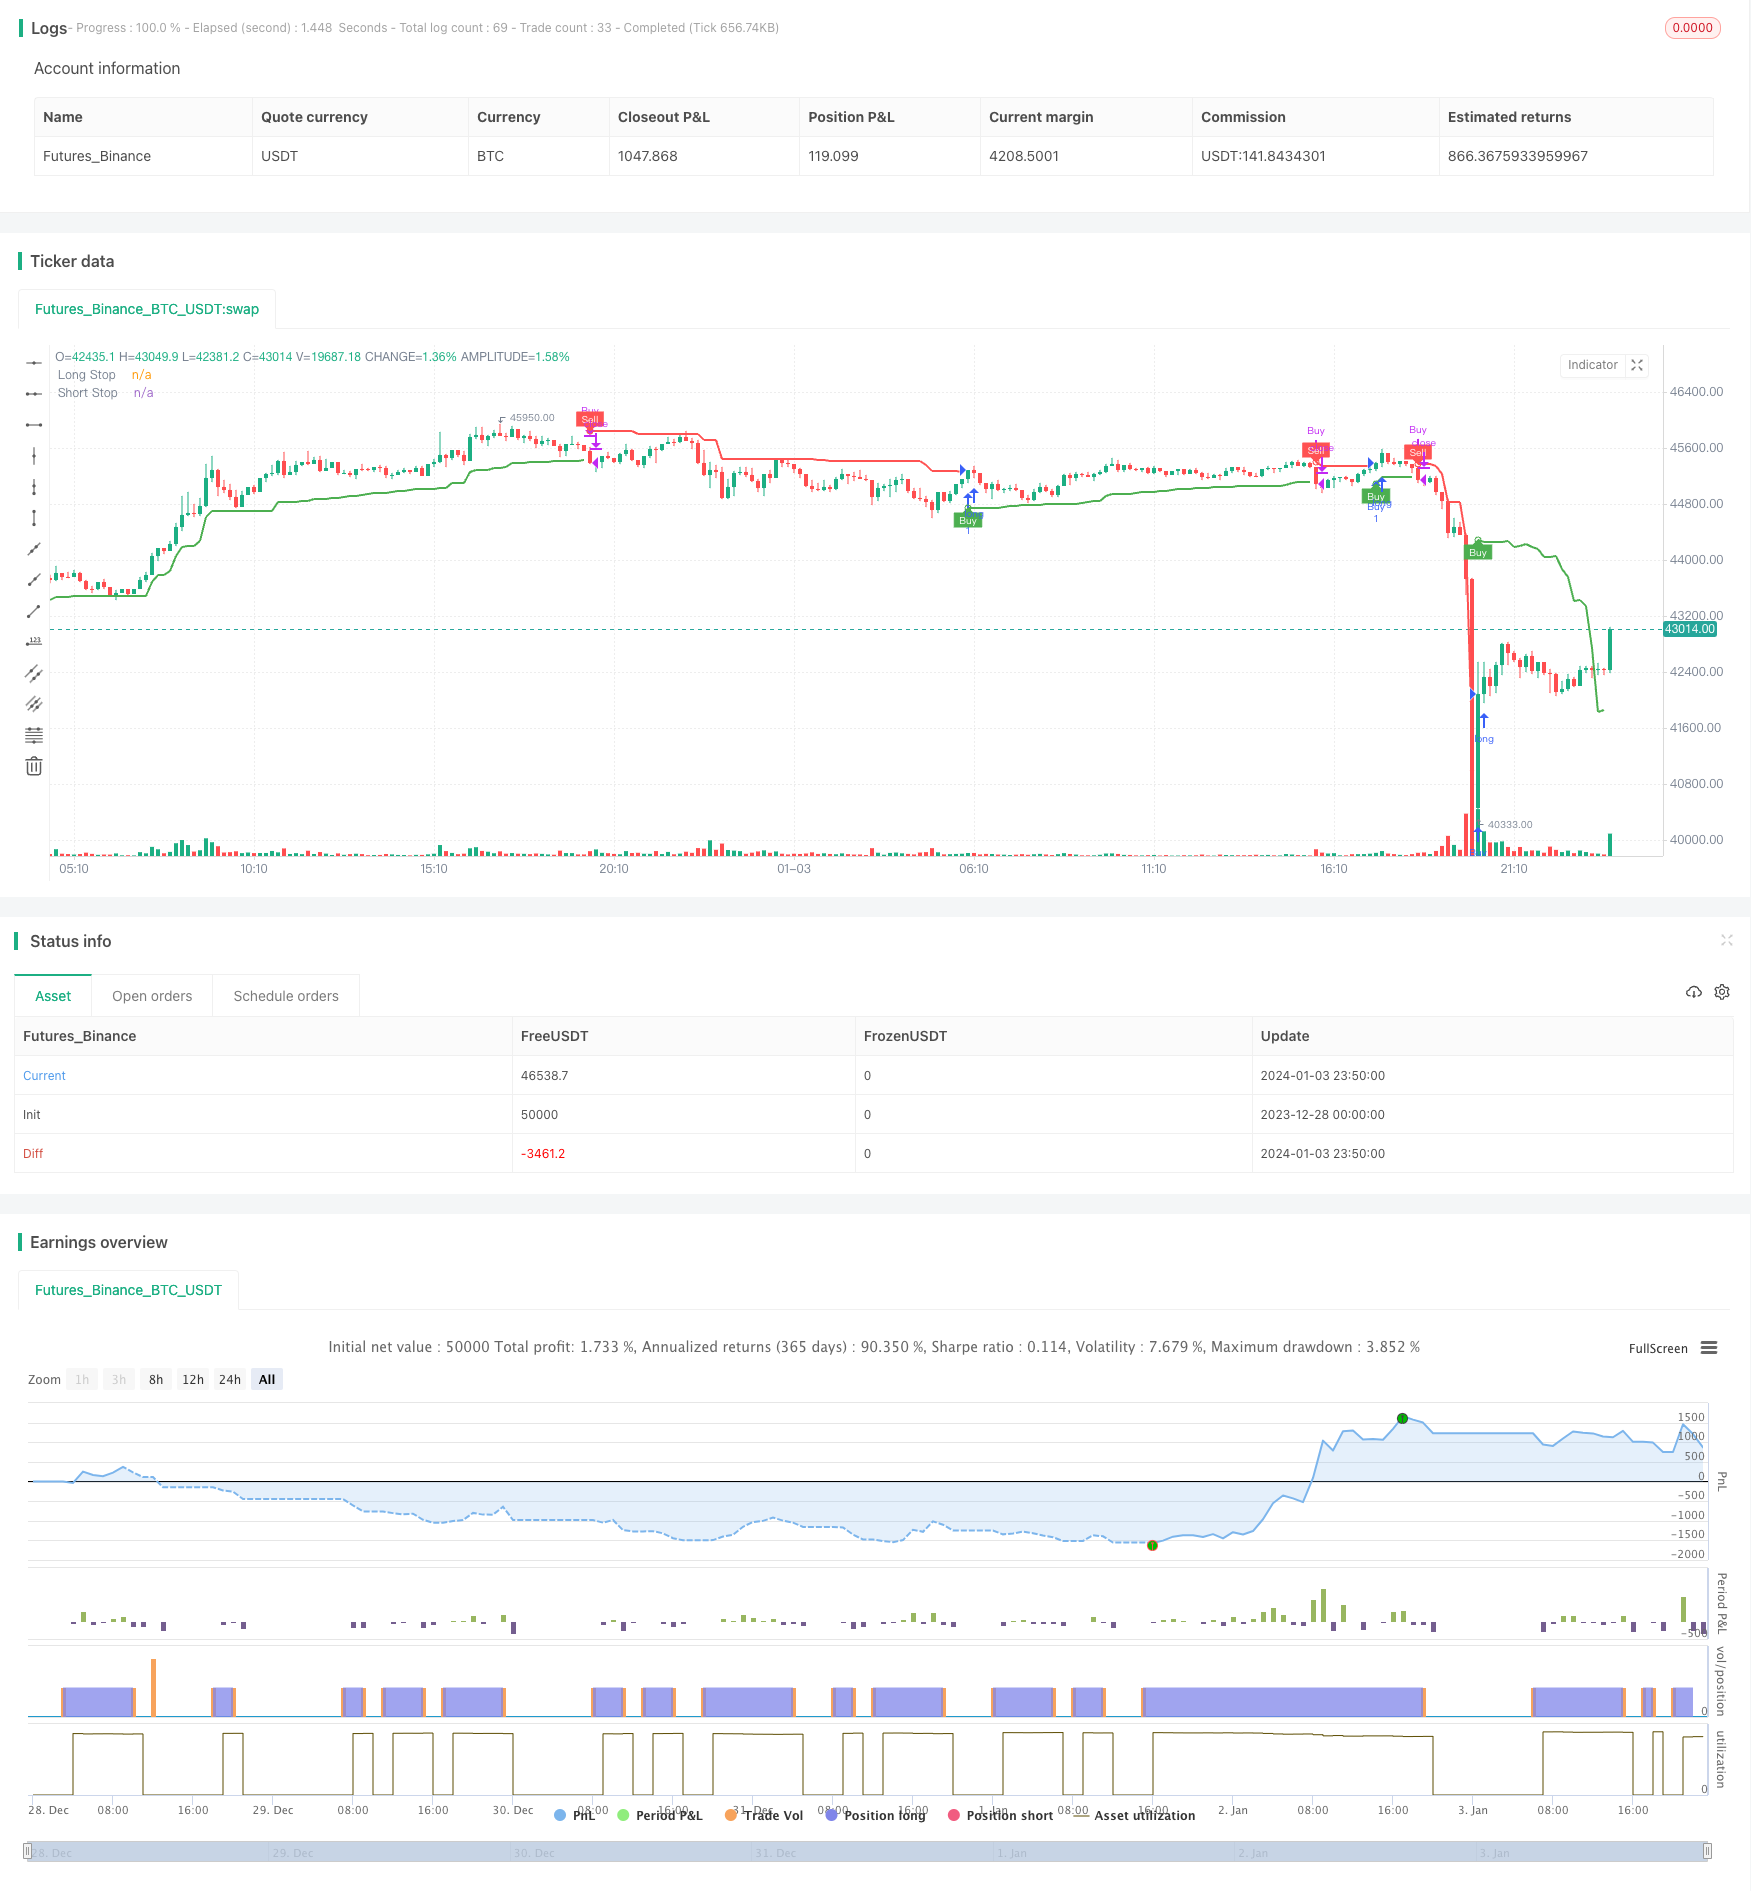
この戦略は,チェンデリア出口指標を使用して,価格ブレイクの方向と勢いを決定し,買い・売るシグナルを生成します.
戦略の論理
この戦略は,最高高値,最低低値,平均真値範囲に基づいてストップ損失ラインを設定するシャンデリア出口指標に基づいています.具体的には,22日間のATRを計算し,係数 (デフォルト3) で倍数して,長距離および短距離ストップラインの値を導き出します.この戦略は,価格がロングストップを下回るときにセール信号,ショートストップを下回るときに購入信号を生成します.
ストラテジーは,購入操作のみを行う.価格が前のロングストップラインを突破するとロングエントリーを誘発し,価格がショートストップラインを下回り,ロングポジションを閉じるときに出口信号を作成する.
利点分析
- リスクを効果的に制御するために,チェンデリア出口から動的なストップ損失ラインを使用します.
- 価格のブレイクを組み合わせてトレンドの動きを捉える
- 買い物のみで上下逆転を回避する戦略を実行する
- 警告条件は,戦略の状態を監視するための通知を誘発します.
リスク分析
- チェンデリア・エグジットは,誤った信号を引き起こす可能性のある変動拡大に敏感です.
- 損失を制限するために購入した後に停止損失がない
- 収益を固定するメカニズムがない
リスク軽減
- 誤った信号を避けるために他の指標とフィルターを追加
- 最大損失を制限するためにストップロスを実装 %
- 販売ラインのダイナミック調整や部分的な出口などの後続利益停止を組み込む.
増進 の 機会
- 入口と出口を最適化するために異なるパラメータセットをテスト
- 信号を確認し,偽信号を避けるためにインジケーターフィルターを追加します
- 買取と売却の両方を許可することを検討する
- ストップ・ロスのメカニズムと 利益のメカニズムを導入する
結論
この戦略は,チェンデリア出口指標からのダイナミックストップラインを使用して逆転機会を特定する. 長ストップラインの上向きブレイクで購入し,価格がショートストップラインを下回ると販売し,上向き/下向きの逆転を避ける単純な一方的な戦略を実装する. リスクを効果的に制御するが,ストップ損失と利益の規定がない. 最適化機会には,フィルターを追加し,戦略をより堅牢にするためにストップ損失/利益のメカニズムを追加することが含まれる.
/*backtest
start: 2023-12-28 00:00:00
end: 2024-01-04 00:00:00
period: 10m
basePeriod: 1m
exchanges: [{"eid":"Futures_Binance","currency":"BTC_USDT"}]
*/

//@version=5
strategy("Chandelier Exit Strategy", overlay=true)

length = input(title='ATR Period', defval=22)
mult = input.float(title='ATR Multiplier', step=0.1, defval=3.0)
showLabels = input(title='Show Buy/Sell Labels ?', defval=true)
useClose = input(title='Use Close Price for Extremums ?', defval=true)
highlightState = input(title='Highlight State ?', defval=true)

atr = mult * ta.atr(length)

longStop = (useClose ? ta.highest(close, length) : ta.highest(length)) - atr
longStopPrev = nz(longStop[1], longStop)
longStop := close[1] > longStopPrev ? math.max(longStop, longStopPrev) : longStop

shortStop = (useClose ? ta.lowest(close, length) : ta.lowest(length)) + atr
shortStopPrev = nz(shortStop[1], shortStop)
shortStop := close[1] < shortStopPrev ? math.min(shortStop, shortStopPrev) : shortStop

var int dir = 1
dir := close > shortStopPrev ? 1 : close < longStopPrev ? -1 : dir

var color longColor = color.green
var color shortColor = color.red

longStopPlot = plot(dir == 1 ? longStop : na, title='Long Stop', style=plot.style_linebr, linewidth=2, color=color.new(longColor, 0))
buySignal = dir == 1 and dir[1] == -1
plotshape(buySignal ? longStop : na, title='Long Stop Start', location=location.absolute, style=shape.circle, size=size.tiny, color=color.new(longColor, 0))
plotshape(buySignal and showLabels ? longStop : na, title='Buy Label', text='Buy', location=location.absolute, style=shape.labelup, size=size.tiny, color=color.new(longColor, 0), textcolor=color.new(color.white, 0))

shortStopPlot = plot(dir == 1 ? na : shortStop, title='Short Stop', style=plot.style_linebr, linewidth=2, color=color.new(shortColor, 0))
sellSignal = dir == -1 and dir[1] == 1
plotshape(sellSignal ? shortStop : na, title='Short Stop Start', location=location.absolute, style=shape.circle, size=size.tiny, color=color.new(shortColor, 0))
plotshape(sellSignal and showLabels ? shortStop : na, title='Sell Label', text='Sell', location=location.absolute, style=shape.labeldown, size=size.tiny, color=color.new(shortColor, 0), textcolor=color.new(color.white, 0))

changeCond = dir != dir[1]
alertcondition(changeCond, title='Alert: CE Direction Change', message='Chandelier Exit has changed direction!')
alertcondition(buySignal, title='Alert: CE Buy', message='Chandelier Exit Buy!')
alertcondition(sellSignal, title='Alert: CE Sell', message='Chandelier Exit Sell!')

// Define initial capital
initial_capital =25

// Trigger buy order and close buy order on sell signal
if buySignal
    strategy.entry("Buy", strategy.long, qty = initial_capital / close)

if sellSignal
    strategy.close("Buy")
もっと
- 戦略をフォローするジグザグトレンド
- スーパートレンド アドバンス 戦略
- ストップ・ロストとテイク・プロフィートのミッドナイト・キャンドルカラー戦略
- ATR トレンド 標準偏差チャネルに基づく戦略
- ATRに基づくトレンド追跡戦略
- RSI,MACDとサポート/レジスタンスを組み合わせた定量取引戦略
- RSI トレンド トラッキング ロング ストラテジー
- ダブルチャネル・ブレークスルー・タートル戦略
- 改善されたRSIMACD移動平均戦略
- 統合された短期および長期EMA決定戦略
- 戦略をフォローするモメンタム主導の三重確認傾向
- フィッシャー・ターナアローンド EMA マルチテイク・プロフィートとマルチストップ戦略
- 移動平均システム取引戦略
- MACDクロスオーバー取引戦略
- 戦略と買取・保有リターンの視覚的な比較
- 二重メカニズムを持つ逆転追跡戦略
- 黄金比率移動平均取引戦略
- ストップロスのダウントレンドにおける価格下落購入戦略
- 逆転勢力の複合戦略
- EMAクロスオーバーに基づく定量取引戦略