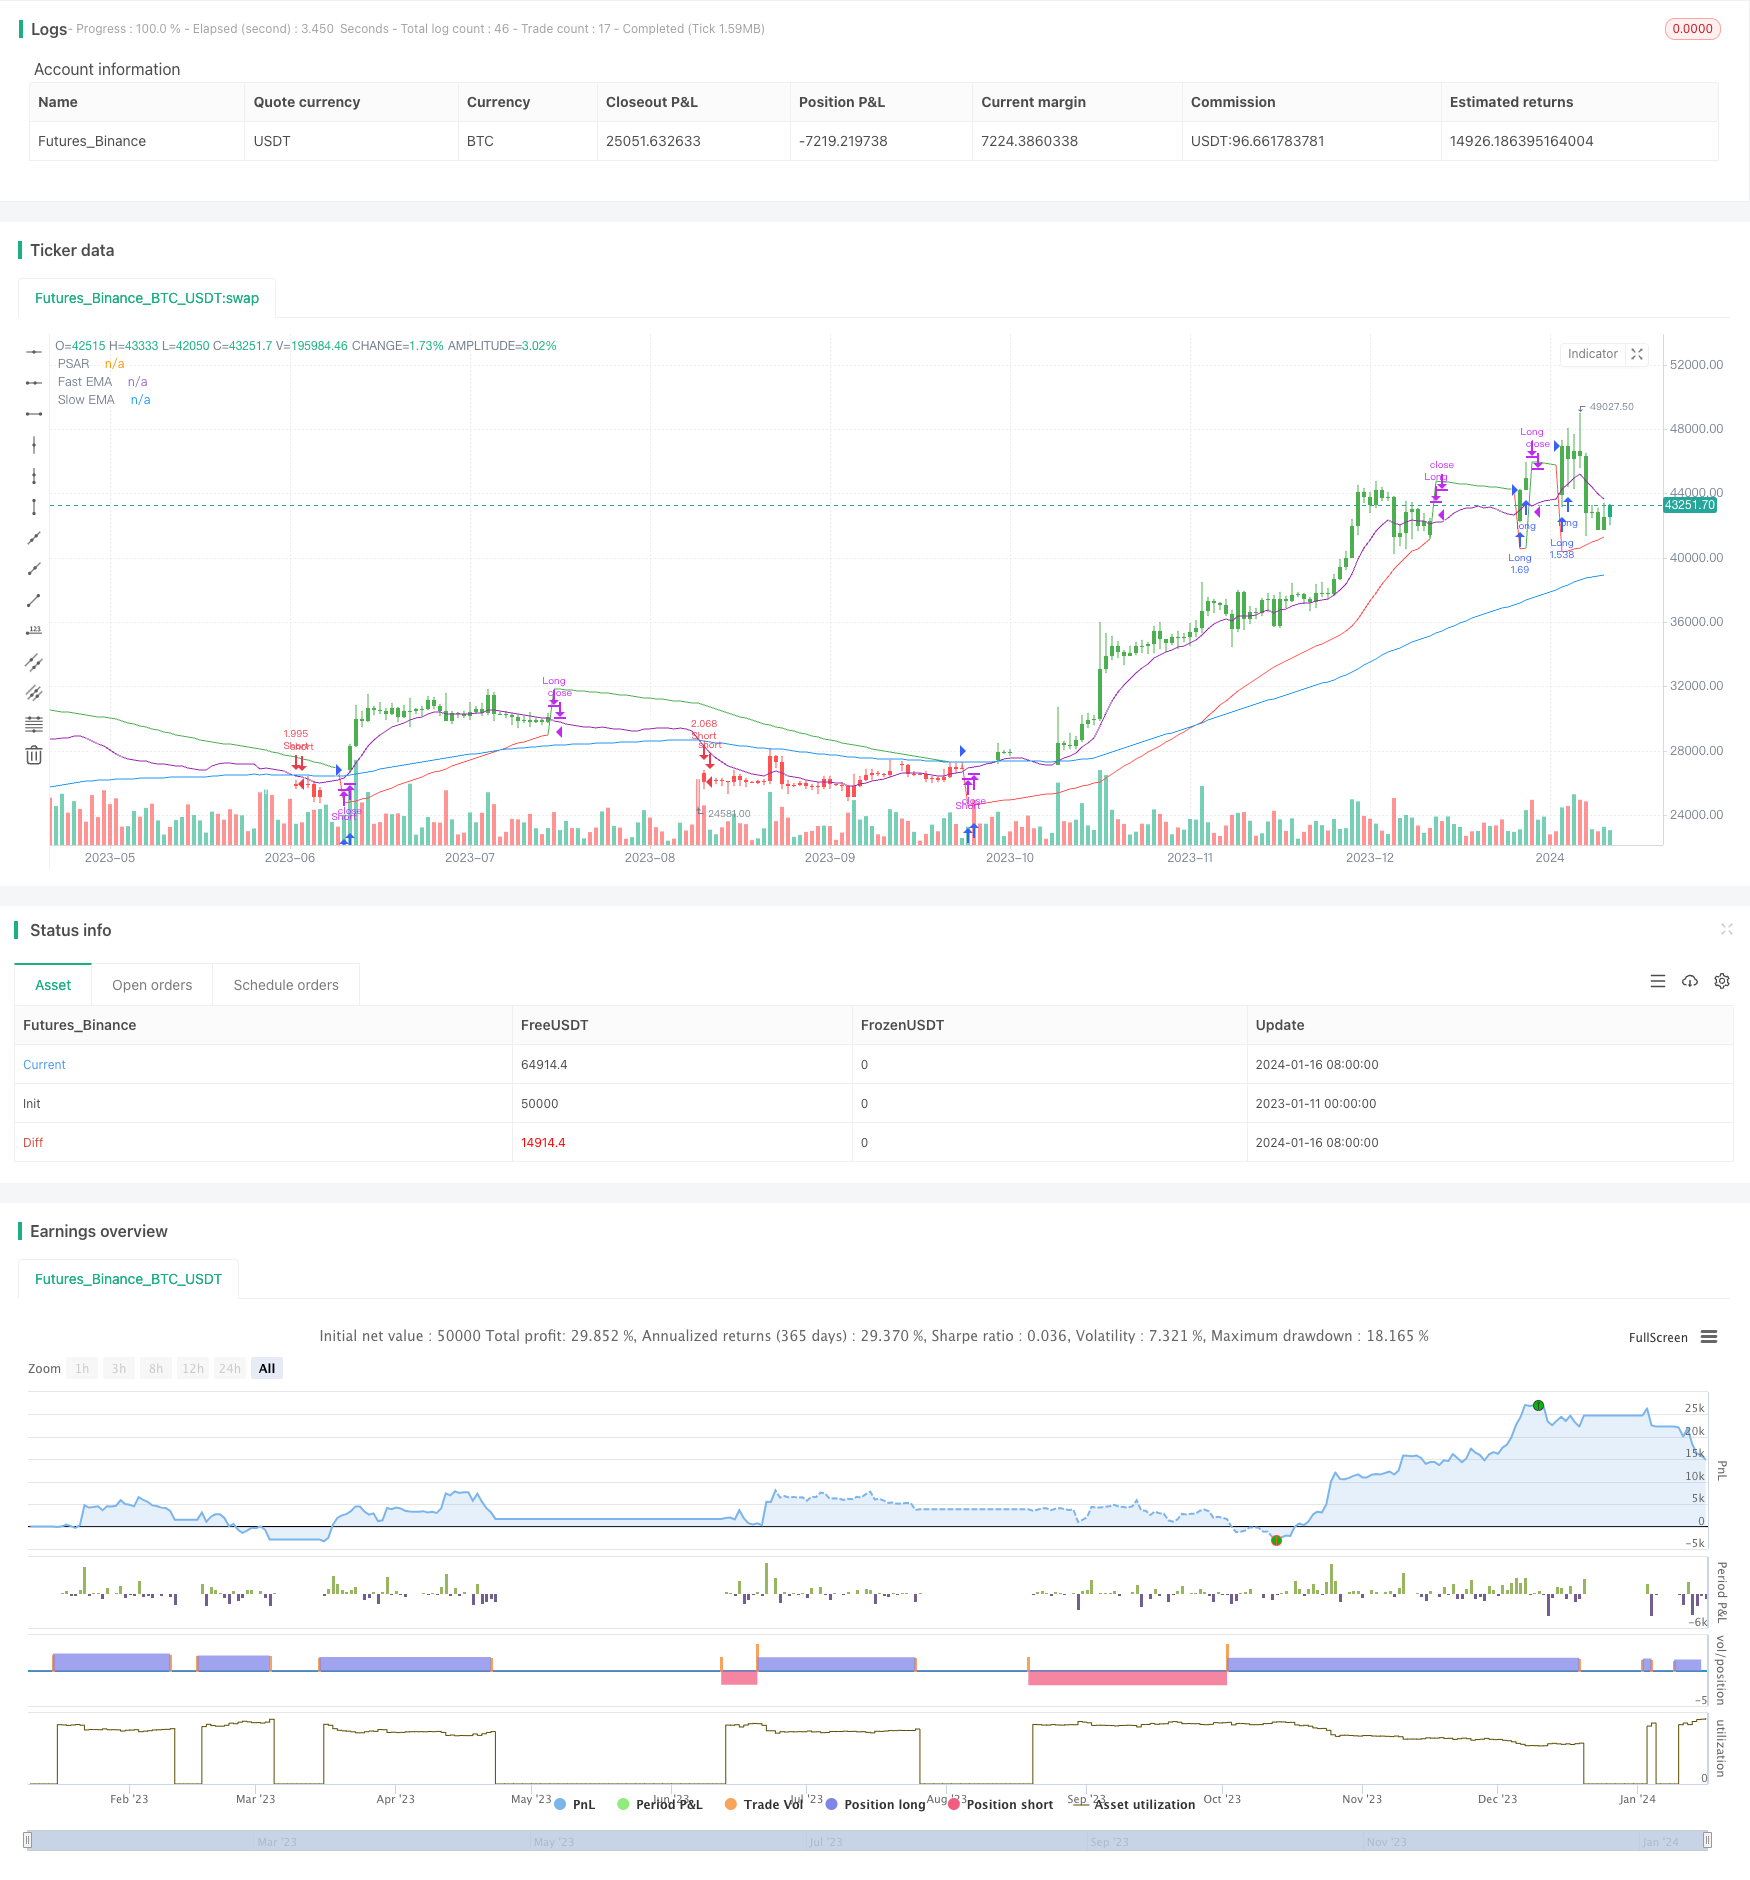
パラボリックSARトレンドフォロー戦略

概要
この策略は,パラパララインSAR ((止損反転) 指数とEMA均線を組み合わせてフィルタリングを行い,取引信号の正確性を向上させる.この策略は,トレンドを追跡するトレーダーに適している.
戦略原則
SARが価格の下にあり,価格が遅いEMA平均線加偏移量より高くなるときに多信号が発生し,SARが価格上にあり,価格が遅いEMA平均線加偏移量より低くなるときに空信号が発生する.同時に,高速EMA平均線と遅いEMA平均線の交差によって追加のフィルタリングが行われる.このことは,SAR指標が単独で使用されたときに発生する可能性のある偽信号を回避する.
具体的には,複数信号のトリガー条件は:1) SARが昨日閉店価格の下にあり,現在の閉店価格の上にあること;2) 現在の閉店価格が遅いEMA平均線加偏移量より高いか,または速いEMA平均線の下を通過する遅いEMA平均線;3) 現在の閉店価格がSAR値と遅いEMA平均線加偏移量より高いこと.
空調シグナルのトリガー条件は:1) SARが昨日の閉盘価格より上であり,現在の閉盘価格より下である.2) 現在の閉盘価格が遅いEMA平均線減偏移量より低いか,または速いEMA平均線上での遅いEMA平均線を横切る.3) 現在の閉盘価格がSAR値と遅いEMA平均線減偏移量より低い.
優位分析
この戦略はSAR指標とEMA均線フィルタを組み合わせて,トレンドの方向をよりよく識別し,偽信号を減らすことができます.
利点としては,
- SAR指標は,価格の変化に迅速に対応し,トレンドの逆転点を識別します.
- EMA均線フィルタは,トレンドの方向をさらに確認し,SAR指標が単独で使用されたときに発生する偽信号を回避します.
- 遅いEMA平均線交差を補助判断条件として組み合わせて,信号の正確性を向上させることができる.
- パラメータを調整することで戦略の収益性を向上させることができます.
リスク分析
この戦略にはいくつかのリスクがあります.
- 整合状況では,SAR指数とEMA平均線が誤信号を発し,戦略的利益に影響を与える可能性がある.パラメータ最適化によってこのリスクを軽減することができる.
- EMA平均線は滞りがあり,トレンドの逆転の最適なエントリーポイントを逃す可能性があります. EMA周期を適切に短縮して滞り性を減らすことができます.
- 大規模な振動の停止損失点は,突破されやすく,戦略に大きな損失をもたらします. 適切な制限範囲を緩めることができます.
最適化の方向
この戦略は以下の点で最適化できます.
- SAR指標のステップ長と最大値のパラメータを最適化して,価格の変化により敏感に反応させる.
- 慢速EMAと高速EMAの周期パラメータを最適化して,最適なパラメータの組み合わせを見つける.
- EMA偏移量パラメータを最適化し,誤信号率を下げる.
- MACD,KDJなどの他の指標をフィルタリングして,信号の正確性を向上させる.
- ストップ・ロスの戦略を最適化し,単発損失を減らす.
要約する
この戦略はSAR指標とEMA均線の優位性を総合的に利用し,より柔軟なトレンド追跡戦略を設計した.全体的に見ると,この戦略はトレンドの方向を成功的に識別する能力が強く,トレンドを追跡する上でよりよい効果を得ることができる.パラメータ最適化とリスク管理により,戦略の安定性と収益性をさらに強化することができる.この戦略は,リスク管理の意識とパラメータ最適化能力が良好な投資家に適しています.
/*backtest
start: 2023-01-11 00:00:00
end: 2024-01-17 00:00:00
period: 1d
basePeriod: 1h
exchanges: [{"eid":"Futures_Binance","currency":"BTC_USDT"}]
*/

//@version=3
strategy("SAR Trend Trader Strategy By: jhanson107", shorttitle="SAR Trend Trader Strategy", overlay=true, default_qty_type=strategy.percent_of_equity, default_qty_value=100)


SlowEMALength = input(100, "Slow EMA Length")
FastEMALength = input(10, "Fast EMA Length")
emaoffset = input(1.00, "EMA Offset %")
start = input(0.01)
increment = input(0.005)
maximum = input(0.08)

////////////////////////////////////////////////////////////////////////////////
// BACKTESTING RANGE

// From Date Inputs
fromDay = input(defval = 1, title = "From Day", minval = 1, maxval = 31)
fromMonth = input(defval = 1, title = "From Month", minval = 1, maxval = 12)
fromYear = input(defval = 2019, title = "From Year", minval = 1970)

// To Date Inputs
toDay = input(defval = 1, title = "To Day", minval = 1, maxval = 31)
toMonth = input(defval = 1, title = "To Month", minval = 1, maxval = 12)
toYear = input(defval = 2020, title = "To Year", minval = 1970)

// Calculate start/end date and time condition
startDate = timestamp(fromYear, fromMonth, fromDay, 00, 00)
finishDate = timestamp(toYear, toMonth, toDay, 00, 00)
time_cond = true

////////////////////////////////////////////////////////////////////////////////

psar = sar(start, increment, maximum)
ema = ema(close, SlowEMALength)
fastema = ema(close, FastEMALength)
offset = (emaoffset / 100) * ema

// Signals
long = high[1] < psar[2] and high >= psar[1] and close > ema + offset or crossunder(ema, fastema) and close > psar and close > ema + offset
short = low[1] > psar[2] and low <= psar[1] and close < ema - offset or crossover(ema, fastema) and close < psar and close < ema - offset

// Plot PSAR
plot(psar, title="PSAR", color = low < psar and not long ? green : red, trackprice=true)

//Barcolor
barcolor(close > psar and close > ema + offset and fastema > ema ? green : na)
barcolor(close > psar and close < ema + offset or close > psar and fastema < ema ? white : na)
barcolor(close < psar and close < ema - offset and fastema < ema and close? red : na)
barcolor(close < psar and close > ema - offset or close < psar and fastema > ema ? white : na)

//Plot EMA
plot(ema, color=blue, linewidth=1, transp=0, title="Slow EMA")
plot(fastema, color=purple, linewidth=1, transp=0, title="Fast EMA")


if(high > psar)
    strategy.close("Short")

if(low < psar)
    strategy.close("Long")

if(long and time_cond)
    strategy.entry("Long", strategy.long, comment="Long")

if(short and time_cond)
    strategy.entry("Short", strategy.short, comment="Short")

if (not time_cond)
    strategy.close_all()