トレンドフォロー戦略を辛抱強く実行する
概要
耐心的なトレンド追跡戦略は,トレンドフォロー型の戦略である.移動平均の指標の組み合わせを使用して,トレンドの方向を判断し,超買い超売り指標CCIと組み合わせて取引信号を発信する.この戦略は,大きなトレンドを追求し,震動の状況で被套を効果的に回避する.
戦略原則
この戦略は21周期と55周期のEMAを組み合わせてトレンドの方向を判断する.短期EMAが長期EMAの上にあるときは上昇トレンドとして定義され,短期EMAが長期EMAの下にあるときは下降トレンドとして定義される.
CCI指数は,超買超売を判断するために使用される.CCI上を貫く-100線は,底を貫く超売信号であり,下を貫く100線は,頂を貫く超買信号である.CCI指数の異なる超買超売線に応じて,戦略は,取引信号の強度レベルを3つに分割する.
上向きの判断では,CCI指標が強い底の超売り信号を発した場合は多頭入場を行う.下向きの判断では,CCI指標が強い頂上の超買い信号を発した場合は空頭入場を行う.
ストップラインはスーパートレンド指標に設定され,目標利益は固定ポイントに設定されます.
優位分析
この戦略の利点は以下の通りです.
- 大流行を把握して,騙されないために
- CCIの指標は,逆転点の判断に有効です.
- 超トレンドのストップラインの設定は合理的
- 固定ストップと固定ストップ,リスクは制御可能
リスク分析
この戦略には以下のリスクがあります.
- 傾向が誤った判断の確率
- CCI指標が偽信号を発する確率
- ストップポイントが浅すぎるとか深すぎると,不必要なストップが起こる確率
- 固定ストップがトレンドを継続的に追跡できない確率
これらのリスクに対して,EMA周期パラメータ,CCIパラメータ,およびストップ・ストップ・ポイントの位を調整することで最適化することができます.また,戦略信号の検証のためにより多くの指標を導入することも必要です.
最適化の方向
この戦略の最適化方向は以下の通りです.
より多くの指標の組み合わせをテストし,より優れたトレンド判断と信号検証の指標を探します.
ATRの動的ストップ・ストップを利用して,トレンドをよく追跡し,リスクをコントロールする.
傾向の確率を判断するために,歴史データ訓練に基づく機械学習モデルを導入する.
異なる品種のパラメータに合わせて調整・最適化
要約する
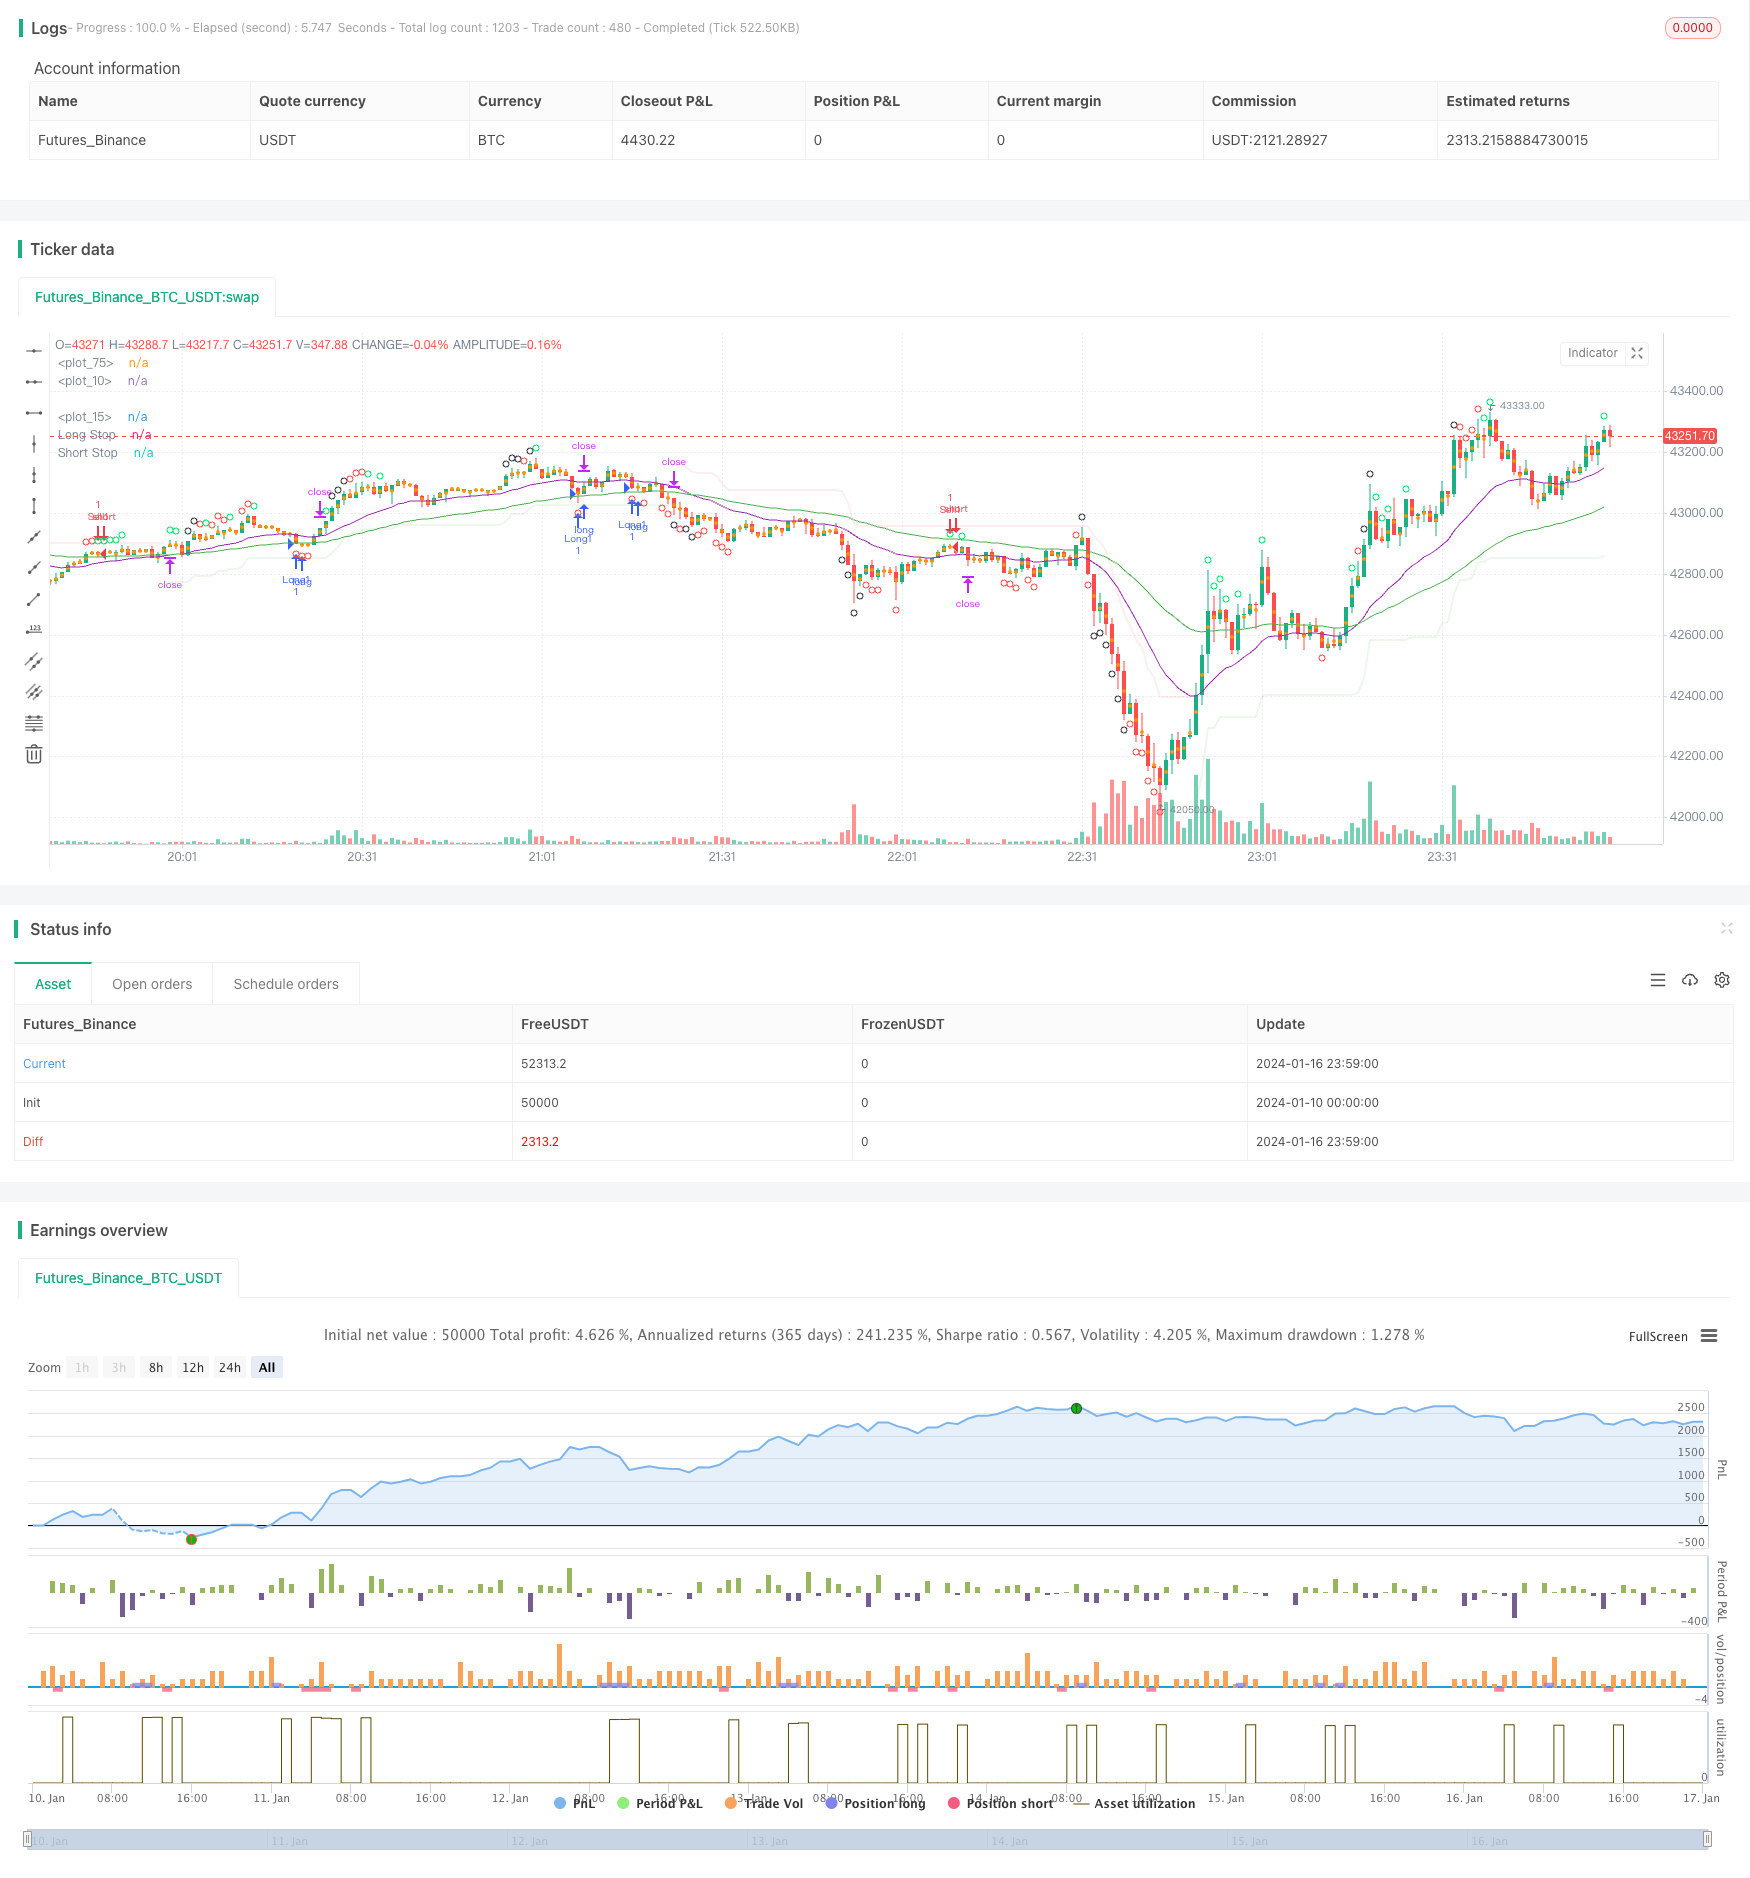
耐心的なトレンド追跡戦略は,全体として非常に実用的なトレンドフォロー戦略である.移動平均を使用して大トレンドの方向を判断し,CCI指標は反転点のシグナルを発見し,スーパートレンドのストップラインを合理的に設定する.パラメータ調整と多指標の組み合わせを検証することによって,この戦略はさらに最適化され,長期のリールストラッキングの検証に値する.
/*backtest
start: 2024-01-10 00:00:00
end: 2024-01-17 00:00:00
period: 1m
basePeriod: 1m
exchanges: [{"eid":"Futures_Binance","currency":"BTC_USDT"}]
*/

// This source code is subject to the terms of the Mozilla Public License 2.0 at https://mozilla.org/MPL/2.0/
// © greenmask9

//@version=4
strategy("Patient Trendfollower (7) Strategy", overlay=true)

// 21 EMA
emalength = input(21, title="Short EMA")
emashort = ema(close, emalength)
plot(emashort, color = color.purple, linewidth=1)

// 55 EMA
emalength2 = input(55, title="Long EMA")
ema = ema(close, emalength2)
plot(ema, color = color.green, linewidth=1)

//CCI calculation and inputs
lengthcci = input(20, minval=1, title="Overbought/sold detector period")
src = input(close, title="Overbought/sold detector source")
ma = sma(src, lengthcci)
ccivalue = (src - ma) / (0.015 * dev(src, lengthcci))


//CCI plotting
ccioverbought = input(defval=100, title="Overbought level 1")
ccioverbought2 = input(defval=140, title="Overbought level 2")
ccioverbought3 = input(defval=180, title="Overbought level 3")

ccioversold = input(defval=-100, title="Oversold level 1")
ccioversold2 = input(defval=-140, title="Oversold level 2")
ccioversold3 = input(defval=-180, title="Oversold level 3")

cciOB = (ccivalue >= ccioverbought and ccivalue < ccioverbought2)
plotshape(cciOB,  title= "Overbought", location=location.abovebar, color=color.lime, transp=0, style=shape.circle)
cciOS = (ccivalue <= ccioversold and ccivalue > ccioversold2)
plotshape(cciOS, title= "Oversold", location=location.belowbar, color=color.lime, transp=0, style=shape.circle)

cciOB2 = (ccivalue >= ccioverbought2 and ccivalue < ccioverbought3)
plotshape(cciOB2,  title= "Overbought", location=location.abovebar, color=color.red, transp=0, style=shape.circle)
cciOS2 = (ccivalue <= ccioversold and ccivalue > ccioversold3)
plotshape(cciOS2, title= "Oversold", location=location.belowbar, color=color.red, transp=0, style=shape.circle)

cciOB3 = (ccivalue >= ccioverbought3)
plotshape(cciOB3,  title= "Overbought", location=location.abovebar, color=color.black, transp=0, style=shape.circle)
cciOS3 = (ccivalue <= ccioversold3)
plotshape(cciOS3, title= "Oversold", location=location.belowbar, color=color.black, transp=0, style=shape.circle)

//Supertrend

length = input(title="ATR Period", type=input.integer, defval=55)
mult = input(title="ATR Multiplier", type=input.float, step=0.1, defval=5.0)
wicks = input(title="Take Wicks into Account ?", type=input.bool, defval=true)
illuminate = input(title="Illuminate Trend", type=input.bool, defval=true)

atr = mult * atr(length)

longStop = hl2 - atr
longStopPrev = nz(longStop[1], longStop)
longStop := (wicks ? low[1] : close[1]) > longStopPrev ? max(longStop, longStopPrev) : longStop

shortStop = hl2 + atr
shortStopPrev = nz(shortStop[1], shortStop)
shortStop := (wicks ? high[1] : close[1]) < shortStopPrev ? min(shortStop, shortStopPrev) : shortStop

dir = 1
dir := nz(dir[1], dir)
dir := dir == -1 and (wicks ? high : close) > shortStopPrev ? 1 : dir == 1 and (wicks ? low : close) < longStopPrev ? -1 : dir

longColor = color.new(color.green, 90)
shortColor = color.new(color.red, 90)
noneColor = color.new(color.white, 100)

longStopPlot = plot(dir == 1 ? longStop : na, title="Long Stop", style=plot.style_linebr, linewidth=2, color=longColor)
shortStopPlot = plot(dir == 1 ? na : shortStop, title="Short Stop", style=plot.style_linebr, linewidth=2, color=shortColor)
midPricePlot = plot(ohlc4, title="", style=plot.style_circles, linewidth=0)

longFillColor = illuminate ? (dir == 1 ? longColor : noneColor) : noneColor
shortFillColor = illuminate ? (dir == -1 ? shortColor : noneColor) : noneColor
fill(midPricePlot, longStopPlot, title="Long State Filling", color=longFillColor)
fill(midPricePlot, shortStopPlot, title="Short State Filling", color=shortFillColor)

//entries
uptrend = emashort>ema and dir == 1
upsignal = ccivalue<=ccioversold and ccivalue>ccioversold2
upsignal2 = ccivalue<=ccioversold2 and ccivalue>ccioversold3
upsignal3 = ccivalue<=ccioversold3
downtrend = emashort<ema and dir == -1
downsignal = ccivalue>=ccioverbought and ccivalue<ccioverbought2
downsignal2 = ccivalue>=ccioverbought2 and ccivalue<ccioverbought3
downsignal3 = ccivalue>=ccioverbought3

//adapts to the current bar, I need to save the bars number when the condition for buy was true, static number is spread
spread = input (0.00020, title="Spread")
upstoploss = longStop - spread
downstoploss = shortStop + spread
strategy.initial_capital = 50000
ordersize=floor(strategy.initial_capital/close)
testlong = input(title="Test longs", type=input.bool, defval=true)
testshort = input(title="Test shorts", type=input.bool, defval=true)
//new
degree = input(title="Test level 1 overbought/sold levels", type=input.bool, defval=true)
degree2 = input(title="Test level 2 overbought/sold levels", type=input.bool, defval=false)
degree3 = input(title="Test level 3 overbought/sold levels", type=input.bool, defval=false)

statictarget = input(title="Use static target", type=input.bool, defval=true)
statictargetvalue = input(title="Static target in pips", type=input.integer, defval=400)

//timetrade = input(title="Open trades only withing specified time", type=input.bool, defval=true)
//timtrade = input()

//přidat možnost TP podle ATR a sl podle ATR
buy1 = uptrend and upsignal and strategy.opentrades==0 and testlong and degree
x1 = barssince (buy1)
if (buy1)
//bodlo by zakázat atrtarget v tomto případě
    if (statictarget)
        strategy.entry("Long1", strategy.long, ordersize)
        strategy.exit( "Exitlong", from_entry="Long1" , profit=statictargetvalue,stop=upstoploss[x1])

buy2 = uptrend and upsignal2 and strategy.opentrades==0 and testlong and degree2
x2 = barssince (buy2)
if (buy2)
//bodlo by zakázat atrtarget v tomto případě
    if (statictarget)
        strategy.entry("Long2", strategy.long, ordersize)
        strategy.exit( "Exitlong", from_entry="Long2" , profit=statictargetvalue,stop=upstoploss[x2])

buy3 = uptrend and upsignal3 and strategy.opentrades==0 and testlong and degree3
x3 = barssince (buy3)
if (buy3)
//bodlo by zakázat atrtarget v tomto případě
    if (statictarget)
        strategy.entry("Long3", strategy.long, ordersize)
        strategy.exit( "Exitlong", from_entry="Long3" , profit=statictargetvalue,stop=upstoploss[x3])

sell1 = downtrend and downsignal and strategy.opentrades==0 and testshort and degree
y1 = barssince (sell1)
if (sell1)
    if (statictarget)
        strategy.entry("Sell1", strategy.short, ordersize)
        strategy.exit( "Exitshort", from_entry="Sell1" , profit=statictargetvalue,stop=downstoploss[y1])

sell2 = downtrend and downsignal2 and strategy.opentrades==0 and testshort and degree2
y2 = barssince (sell2)
if (sell2)
    if (statictarget)
        strategy.entry("Sell2", strategy.short, ordersize)
        strategy.exit( "Exitshort", from_entry="Sell2" , profit=statictargetvalue,stop=downstoploss[y2])

sell3 = downtrend and downsignal3 and strategy.opentrades==0 and testshort and degree3
y3 = barssince (sell3)
if (sell3)
    if (statictarget)
        strategy.entry("Sell3", strategy.short, ordersize)
        strategy.exit( "Exitshort", from_entry="Sell3" , profit=statictargetvalue,stop=downstoploss[y3])