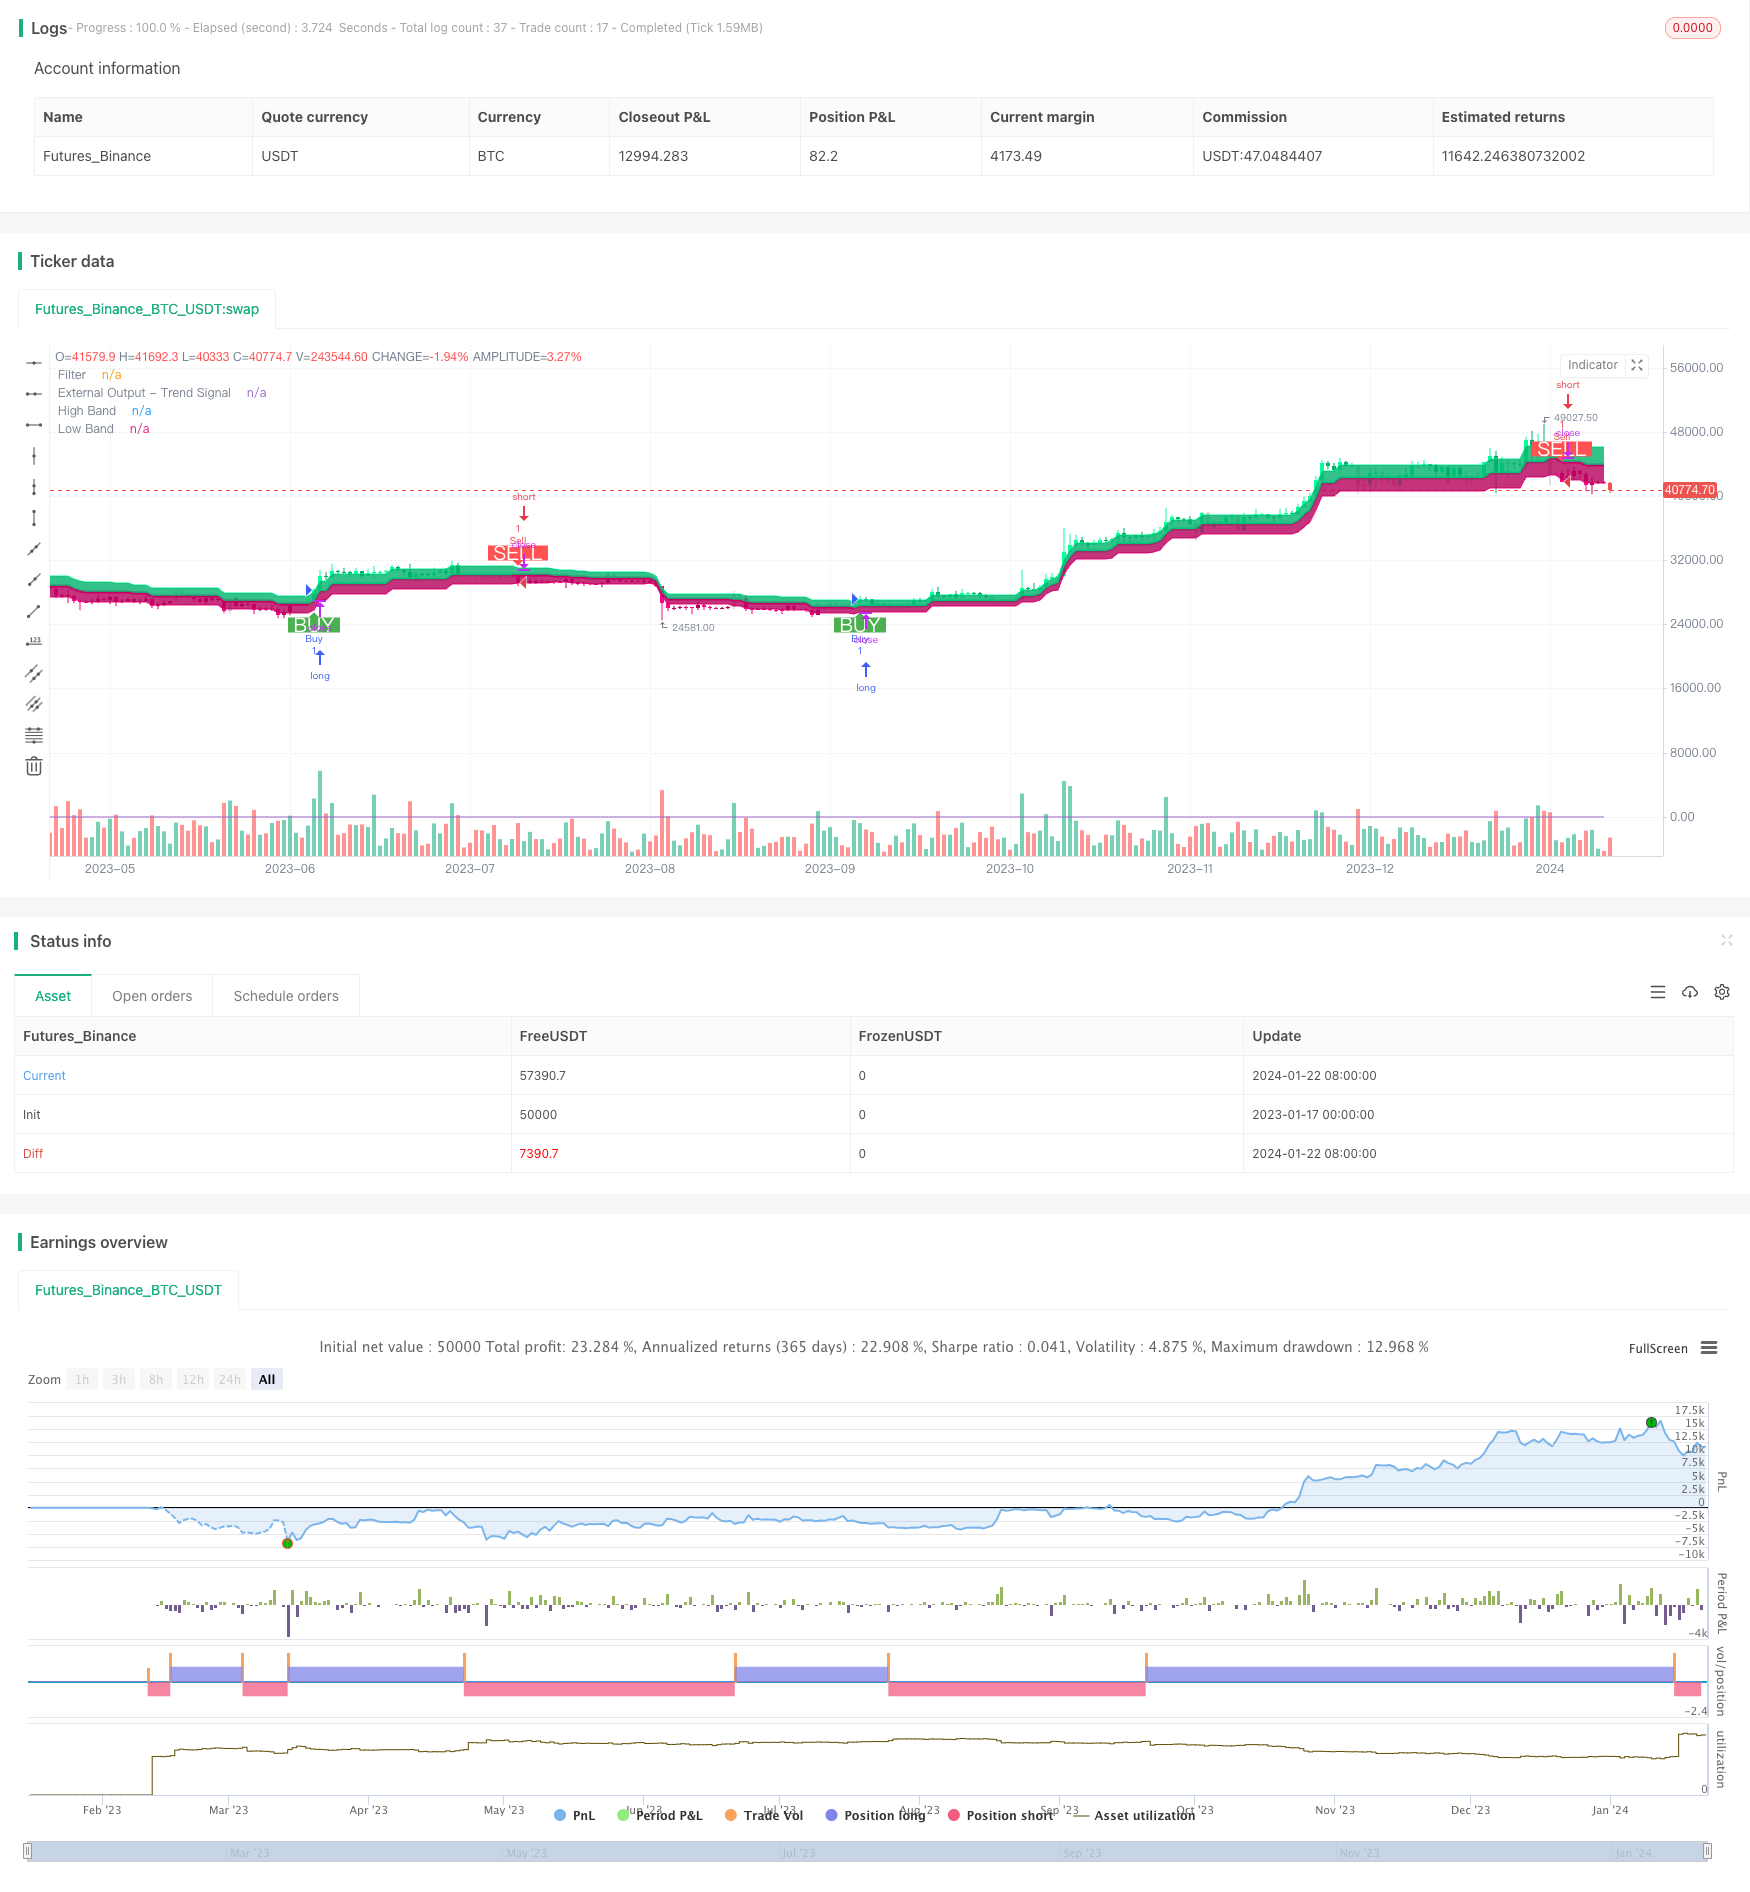
この戦略は両方向の適応範囲フィルタリングモメント追跡戦略です
作者: リン・ハーンチャオチャン,日付: 2024-01-24 11時31分51秒タグ:

概要
この戦略は,両方向の適応範囲フィルタリングモメントトラッキング戦略である. 価格変動を追跡するために適応範囲フィルタを使用し,値の方向性を決定するためにボリューム指標を組み合わせ,低購入と高販売を実装する.
戦略の原則
-
価格変動を追跡するために適応範囲フィルターを使用します.フィルターのサイズは,ユーザーによって定義された範囲期間,量,スケールに応じて適応的に調整されます.
-
フィルターは2種類あります.タイプ1とタイプ2.タイプ1は標準レンジ追跡タイプ,2型は段階的な丸めタイプです.
-
フィルターと閉店価格の関係に基づいて価格変動の方向を決定します.上方レールは上昇し,下部レールは下落します.
-
閉店価格の上昇と減少と組み合わせて,前日と比較して,価値の方向性を決定します. 値上昇は上昇し,値低下は下落です.
-
価格が上位線を突破して価値が上昇すると購入信号を発行します.価格が下位線を突破して価値が下がると販売信号を発行します.
利点分析
-
アダプティブレンジフィルターは 市場の変動を正確に把握できます
-
2種類のフィルターは 異なる取引の好みを満たすことができます
-
ボリュームインジケーターを組み合わせることで,価値の方向性を効果的に特定できます.
-
戦略は柔軟で,市場状況に応じてパラメータを調整できます.
-
調整可能な取引条件の論理
リスク分析
-
パラメータの設定が正しくない場合,取引が過度に多すぎたり,失敗したりする可能性があります.
-
突破信号には 遅延がある
-
音量指標は 停滞する危険性があります
-
射程障害者は 罠にかかったりします
リスク予防
-
適切なパラメータの組み合わせを選択し,それを適時に調整する.
-
傾向を特定するために他の指標を組み合わせます.
-
キーレベルやトレンド逆転の周りに慎重に取引する
オプティマイゼーションの方向性
-
最適な組み合わせを見つけるために,範囲のサイズとスムーズ化サイクルを異なる組み合わせでテストする.
-
フィルタの種類を試して 好きなタイプを選んでください
-
他の音量指標または補助技術指標で実験する.
-
取引条件の論理を最適化し調整し,不合理な取引を減らす.
-
市場定理を組み込み,適応型ポジションサイズを設定する.
/*backtest
start: 2023-01-17 00:00:00
end: 2024-01-23 00:00:00
period: 1d
basePeriod: 1h
exchanges: [{"eid":"Futures_Binance","currency":"BTC_USDT"}]
*/

//@version=4
strategy("Range Filter [DW] & Labels", shorttitle="RF [DW] & Labels", overlay=true)


//Conditional Sampling EMA Function
Cond_EMA(x, cond, n)=>
    var val     = array.new_float(0)
    var ema_val = array.new_float(1)
    if cond
        array.push(val, x)
        if array.size(val) > 1
            array.remove(val, 0)
        if na(array.get(ema_val, 0))
            array.fill(ema_val, array.get(val, 0))
        array.set(ema_val, 0, (array.get(val, 0) - array.get(ema_val, 0))*(2/(n + 1)) + array.get(ema_val, 0))
    EMA = array.get(ema_val, 0)
    EMA

//Conditional Sampling SMA Function
Cond_SMA(x, cond, n)=>
    var vals = array.new_float(0)
    if cond
        array.push(vals, x)
        if array.size(vals) > n
            array.remove(vals, 0)
    SMA = array.avg(vals)
    SMA

//Standard Deviation Function
Stdev(x, n)=>
    sqrt(Cond_SMA(pow(x, 2), 1, n) - pow(Cond_SMA(x, 1, n), 2))

//Range Size Function
rng_size(x, scale, qty, n)=>
    ATR      = Cond_EMA(tr(true), 1, n)
    AC       = Cond_EMA(abs(x - x[1]), 1, n)
    SD       = Stdev(x, n)
    rng_size = scale=="Pips" ? qty*0.0001 : scale=="Points" ? qty*syminfo.pointvalue : scale=="% of Price" ? close*qty/100 : scale=="ATR" ? qty*ATR :
               scale=="Average Change" ? qty*AC : scale=="Standard Deviation" ? qty*SD : scale=="Ticks" ? qty*syminfo.mintick : qty

//Two Type Range Filter Function
rng_filt(h, l, rng_, n, type, smooth, sn, av_rf, av_n)=>
    rng_smooth = Cond_EMA(rng_, 1, sn)
    r          = smooth ? rng_smooth : rng_
    var rfilt  = array.new_float(2, (h + l)/2)
    array.set(rfilt, 1, array.get(rfilt, 0))
    if type=="Type 1"
        if h - r > array.get(rfilt, 1)
            array.set(rfilt, 0, h - r)
        if l + r < array.get(rfilt, 1)
            array.set(rfilt, 0, l + r)
    if type=="Type 2"
        if h >= array.get(rfilt, 1) + r
            array.set(rfilt, 0, array.get(rfilt, 1) + floor(abs(h - array.get(rfilt, 1))/r)*r)
        if l <= array.get(rfilt, 1) - r
            array.set(rfilt, 0, array.get(rfilt, 1) - floor(abs(l - array.get(rfilt, 1))/r)*r)
    rng_filt1 = array.get(rfilt, 0)
    hi_band1  = rng_filt1 + r
    lo_band1  = rng_filt1 - r
    rng_filt2 = Cond_EMA(rng_filt1, rng_filt1 != rng_filt1[1], av_n)
    hi_band2  = Cond_EMA(hi_band1, rng_filt1 != rng_filt1[1], av_n)
    lo_band2  = Cond_EMA(lo_band1, rng_filt1 != rng_filt1[1], av_n)
    rng_filt  = av_rf ? rng_filt2 : rng_filt1
    hi_band   = av_rf ? hi_band2 : hi_band1
    lo_band   = av_rf ? lo_band2 : lo_band1
    [hi_band, lo_band, rng_filt]

//-----------------------------------------------------------------------------------------------------------------------------------------------------------------
//Inputs
//-----------------------------------------------------------------------------------------------------------------------------------------------------------------

//Filter Type
f_type = input(defval="Type 1", options=["Type 1", "Type 2"], title="Filter Type")

//Movement Source
mov_src = input(defval="Close", options=["Wicks", "Close"], title="Movement Source")

//Range Size Inputs
rng_qty   = input(defval=2.618, minval=0.0000001, title="Range Size")
rng_scale = input(defval="Average Change", options=["Points", "Pips", "Ticks", "% of Price", "ATR", "Average Change", "Standard Deviation", "Absolute"], title="Range Scale")

//Range Period
rng_per = input(defval=14, minval=1, title="Range Period (for ATR, Average Change, and Standard Deviation)")

//Range Smoothing Inputs
smooth_range = input(defval=true, title="Smooth Range")
smooth_per   = input(defval=27, minval=1, title="Smoothing Period")

//Filter Value Averaging Inputs
av_vals    = input(defval=true, title="Average Filter Changes")
av_samples = input(defval=2, minval=1, title="Number Of Changes To Average")

//-----------------------------------------------------------------------------------------------------------------------------------------------------------------
//Definitions
//-----------------------------------------------------------------------------------------------------------------------------------------------------------------

//High And Low Values
h_val = mov_src=="Wicks" ? high : close
l_val = mov_src=="Wicks" ? low : close

//Range Filter Values
[h_band, l_band, filt] = rng_filt(h_val, l_val, rng_size((h_val + l_val)/2, rng_scale, rng_qty, rng_per), rng_per, f_type, smooth_range, smooth_per, av_vals, av_samples)

//Direction Conditions
var fdir = 0.0
fdir    := filt > filt[1] ? 1 : filt < filt[1] ? -1 : fdir
upward   = fdir==1 ? 1 : 0
downward = fdir==-1 ? 1 : 0

//Colors
filt_color = upward ? #05ff9b : downward ? #ff0583 : #cccccc
bar_color  = upward and (close > filt) ? (close > close[1] ? #05ff9b : #00b36b) :
             downward and (close < filt) ? (close < close[1] ? #ff0583 : #b8005d) : #cccccc

//-----------------------------------------------------------------------------------------------------------------------------------------------------------------
//Outputs
//-----------------------------------------------------------------------------------------------------------------------------------------------------------------

//Filter Plot
filt_plot = plot(filt, color=filt_color, transp=0, linewidth=3,  title="Filter")

//Band Plots
h_band_plot = plot(h_band, color=#05ff9b, transp=100, title="High Band")
l_band_plot = plot(l_band, color=#ff0583, transp=100, title="Low Band")

//Band Fills
fill(h_band_plot, filt_plot, color=#00b36b, transp=85, title="High Band Fill")
fill(l_band_plot, filt_plot, color=#b8005d, transp=85, title="Low Band Fill")

//Bar Color
barcolor(bar_color)

//External Trend Output
plot(fdir, transp=100, editable=false, display=display.none, title="External Output - Trend Signal")

// Trading Conditions Logic
longCond = close > filt and close > close[1] and upward > 0 or close > filt and close < close[1] and upward > 0
shortCond = close < filt and close < close[1] and downward > 0 or close < filt and close > close[1] and downward > 0

CondIni = 0
CondIni := longCond ? 1 : shortCond ? -1 : CondIni[1]
longCondition = longCond and CondIni[1] == -1
shortCondition = shortCond and CondIni[1] == 1

// Strategy Entry and Exit
strategy.entry("Buy", strategy.long, when = longCondition)
strategy.entry("Sell", strategy.short, when = shortCondition)

strategy.close("Buy", when = shortCondition)
strategy.close("Sell", when = longCondition)

// Plot Buy and Sell Labels
plotshape(longCondition, title = "Buy Signal", text ="BUY", textcolor = color.white, style=shape.labelup, size = size.normal, location=location.belowbar, color = color.green, transp = 0)
plotshape(shortCondition, title = "Sell Signal", text ="SELL", textcolor = color.white, style=shape.labeldown, size = size.normal, location=location.abovebar, color = color.red, transp = 0)

// Alerts
alertcondition(longCondition, title="Buy Alert", message = "BUY")
alertcondition(shortCondition, title="Sell Alert", message = "SELL")
- RSIと移動平均のブレイクアウト戦略
- EMAの追跡戦略
- 動向平均に基づく戦略をフォローする傾向
- SMAクロスオーバー イチモク 市場深度 量に基づく量的な取引戦略
- トレンドトラッキング ストップ損失 利益 戦略
- 二方向切断ゼロ軸 Qstick インディケーター バックテスト 戦略
- 移動平均のクロスオーバー取引戦略
- 移動平均差の戦略
- 影線に基づく反転高周波取引戦略
- 線形回帰RSIに基づく定量的な取引戦略
- 動向平均の二重トレンド追跡戦略
- 突破戦略
- RSI CCI ウィリアムズ%R 定量的な取引戦略
- ダイナミック・リスク調整モメント・トレード・戦略
- モメント・ムービング・平均クロスオーバー・トレード戦略
- ボリンジャー・バンド・リミット・マーケットメーカーの戦略
- 長期移動平均のクロスオーバーのRENKO戦略
- オンラインの新取引監視
- 双方向のトレンドトラッキング レンコの取引戦略
- 移動平均と無限のインパルス応答線戦略を組み合わせた