ダイナミック・均線交差戦略
作者: リン・ハーンチャオチャン,日付: 2024-02-01 10:42:53タグ:

概要
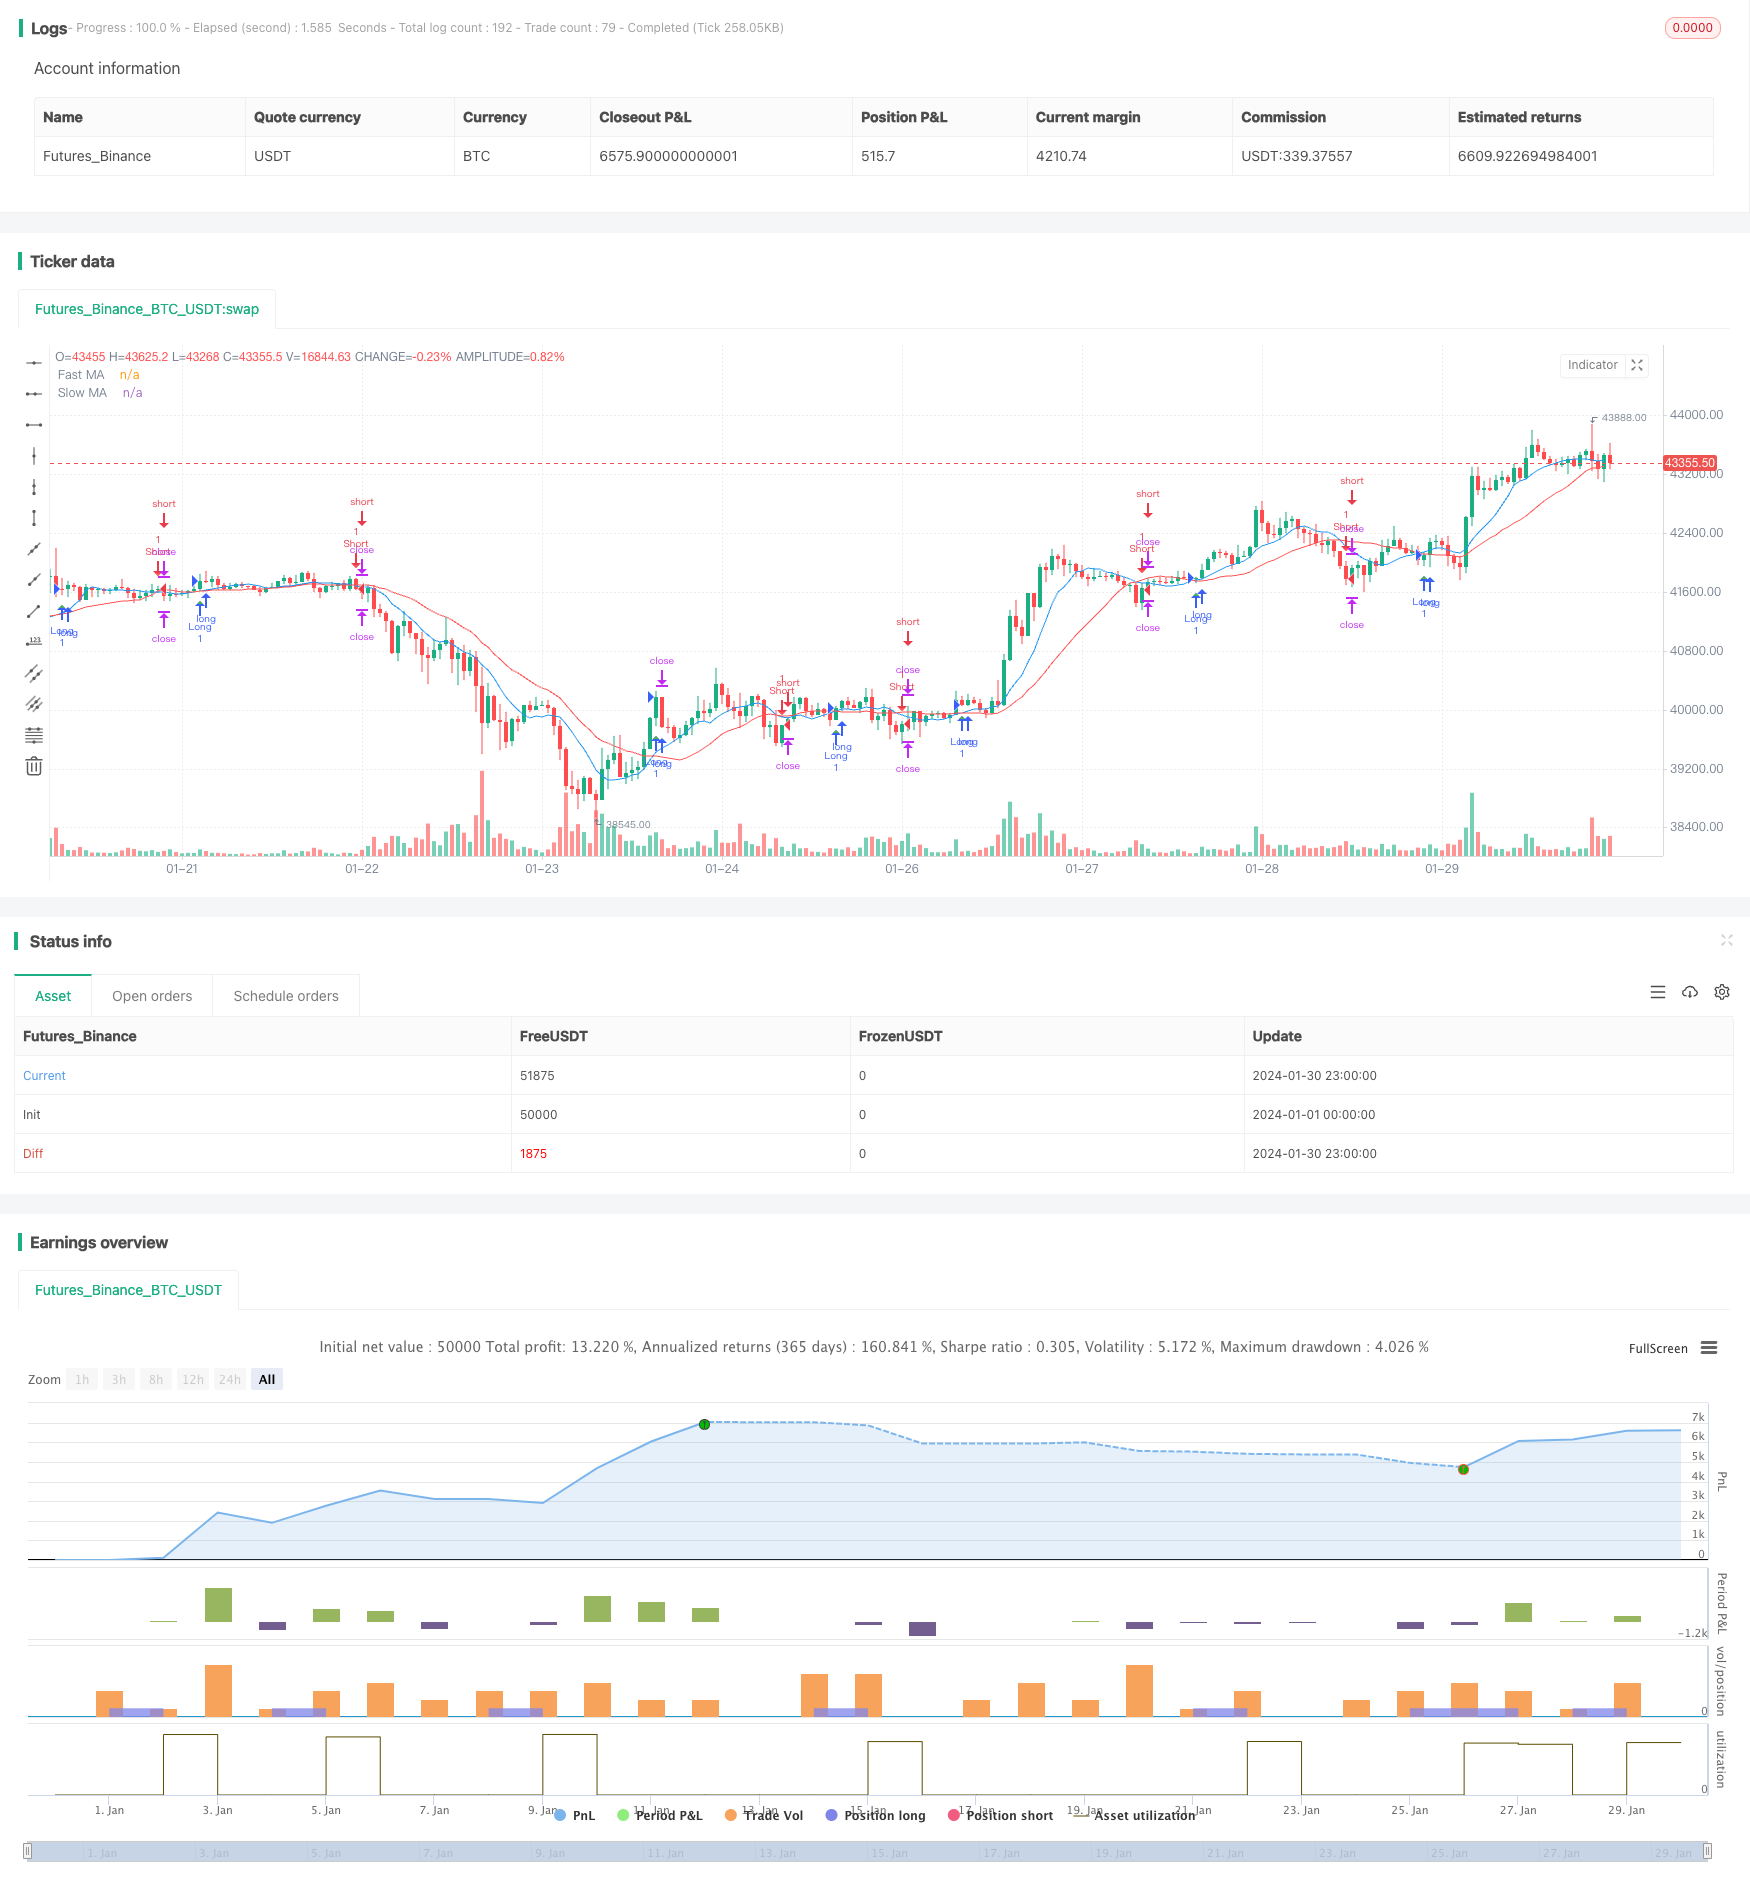
ダイナミック・ムービング・アベア・クロスオーバー戦略 (Dynamic Moving Average Crossover Strategy) は,急速な移動平均 (Fast MA) と遅い移動平均 (Slow MA) を計算し,それらを交差するときに買取と売却の信号を生成して市場傾向の転換点を捕捉する典型的な傾向追跡戦略である.
戦略の原理
この戦略の核心論理は,快速移動平均線が下からスロー移動平均線を横切ると買い信号が発生し,快速移動平均線が上からスロー移動平均線を横切ると売り信号が発生する.
移動平均線は,市場の騒音を効果的にフィルタリングし,価格の傾向を捉える. 速い移動平均線は,傾向の変化を迅速に捉えるのにより敏感である. 遅い移動平均線は,短期波動の影響を効果的に消すのにより安定である. 速い移動平均線が金
この戦略は,平均線が交差するとすぐに取引信号を発し,市場傾向を追跡し,大きな利益を得るためにトレンド追跡戦略を採用する.同時に,戦略は,ストップ損失レベルとストップ強度レベルを設定し,リスクを厳しく管理する.
優位性分析
- 戦略的リトークは,より大きな市場を把握する傾向を追跡して,良好なパフォーマンスをしています.
- 均線交差は明確な信号を生み出し,実行が簡単です
- ストップダメージを抑制し,リスクを厳しく管理する
リスク分析
- 損失を招く可能性のある信号の誤った取引
- 取引頻度,保有時間短さ
- パラメータを合理的に設定する必要があります
パラメータの最適化,均線周期長さの調整,またはフィルタリング条件の追加などの方法によって改善できます.
優化方向
- 均線パラメータを調整し,最適なパラメータ組み合わせを探します
- 量エネルギー指標などのフィルタリング条件を追加し,誤った信号を減らす
- ストップダスト停止設定を最適化する
- 他の指標と組み合わせて 傾向の方向を判断する
概要
動的均線交差戦略は全体的に良い効果を持ち,パラメータの調整による最適化によって戦略のパフォーマンスをさらに改善することができる.この戦略は,実行しやすいし,初心者の実戦練習に適している.しかし,誤った信号の発生リスクに注意を払う必要があり,他の指標の判断に助けられる必要があります.
/*backtest
start: 2024-01-01 00:00:00
end: 2024-01-31 00:00:00
period: 1h
basePeriod: 15m
exchanges: [{"eid":"Futures_Binance","currency":"BTC_USDT"}]
*/

//@version=5
strategy("Simple Moving Average Crossover", shorttitle="SMAC", overlay=true)

// Define input parameters
fast_length = input.int(9, title="Fast MA Length")
slow_length = input.int(21, title="Slow MA Length")
stop_loss = input.float(1, title="Stop Loss (%)", minval=0, maxval=100)
take_profit = input.float(2, title="Take Profit (%)", minval=0, maxval=100)

// Calculate moving averages
fast_ma = ta.sma(close, fast_length)
slow_ma = ta.sma(close, slow_length)

// Define conditions for long and short signals
long_condition = ta.crossover(fast_ma, slow_ma)
short_condition = ta.crossunder(fast_ma, slow_ma)

// Plot moving averages on the chart
plot(fast_ma, title="Fast MA", color=color.blue)
plot(slow_ma, title="Slow MA", color=color.red)

// Execute long and short trades
if (long_condition)
    strategy.entry("Long", strategy.long)
if (short_condition)
    strategy.entry("Short", strategy.short)

// Set stop loss and take profit levels
stop_loss_price = close * (1 - stop_loss / 100)
take_profit_price = close * (1 + take_profit / 100)
strategy.exit("Take Profit/Stop Loss", stop=stop_loss_price, limit=take_profit_price)

// Plot signals on the chart
plotshape(series=long_condition, title="Buy Signal", location=location.belowbar, color=color.green, style=shape.triangleup, size=size.small)
plotshape(series=short_condition, title="Sell Signal", location=location.abovebar, color=color.red, style=shape.triangledown, size=size.small)
もっと見る
- ブリン帯%B指数に基づく長線取引戦略
- 耐心的にK線を分析し,貴重な情報を含む三重平均線波段戦略
- 陰陽吊り線戦略
- ダイナミックストップ損失追跡戦略
- 三重移動平均線 トレンド追跡戦略
- ストップ損失移動平均取引戦略を追跡する
- 2つの指標の逆転傾向を追跡する戦略
- ダイナミックな価格チャネルストップ損失追跡戦略
- ダイナミックストップ・ダメージ ブリンベルト戦略
- 双因子反射波段突破組合せ戦略
- EMAのトレンド追跡戦略
- RSIとSMAに基づく短期取引戦略
- 短線取引戦略を突破する動力
- KDJ陽線が買収戦略を突破する
- 潜水艦が突破する
- タイムフレームの動きを追跡する戦略
- 均線トレンド追跡戦略
- 多時間枠枢軸超トレンド戦略
- 取引の形状と傾向を追跡する戦略を量化する
- Supertrendは,RSIを組み合わせた量的な取引戦略です