双方向移動指数戦略に基づく
作成日:
2024-02-18 10:00:22
最終変更日:
2024-02-18 10:00:22
コピー:
0
クリック数:
638
1
フォロー
1628
フォロワー
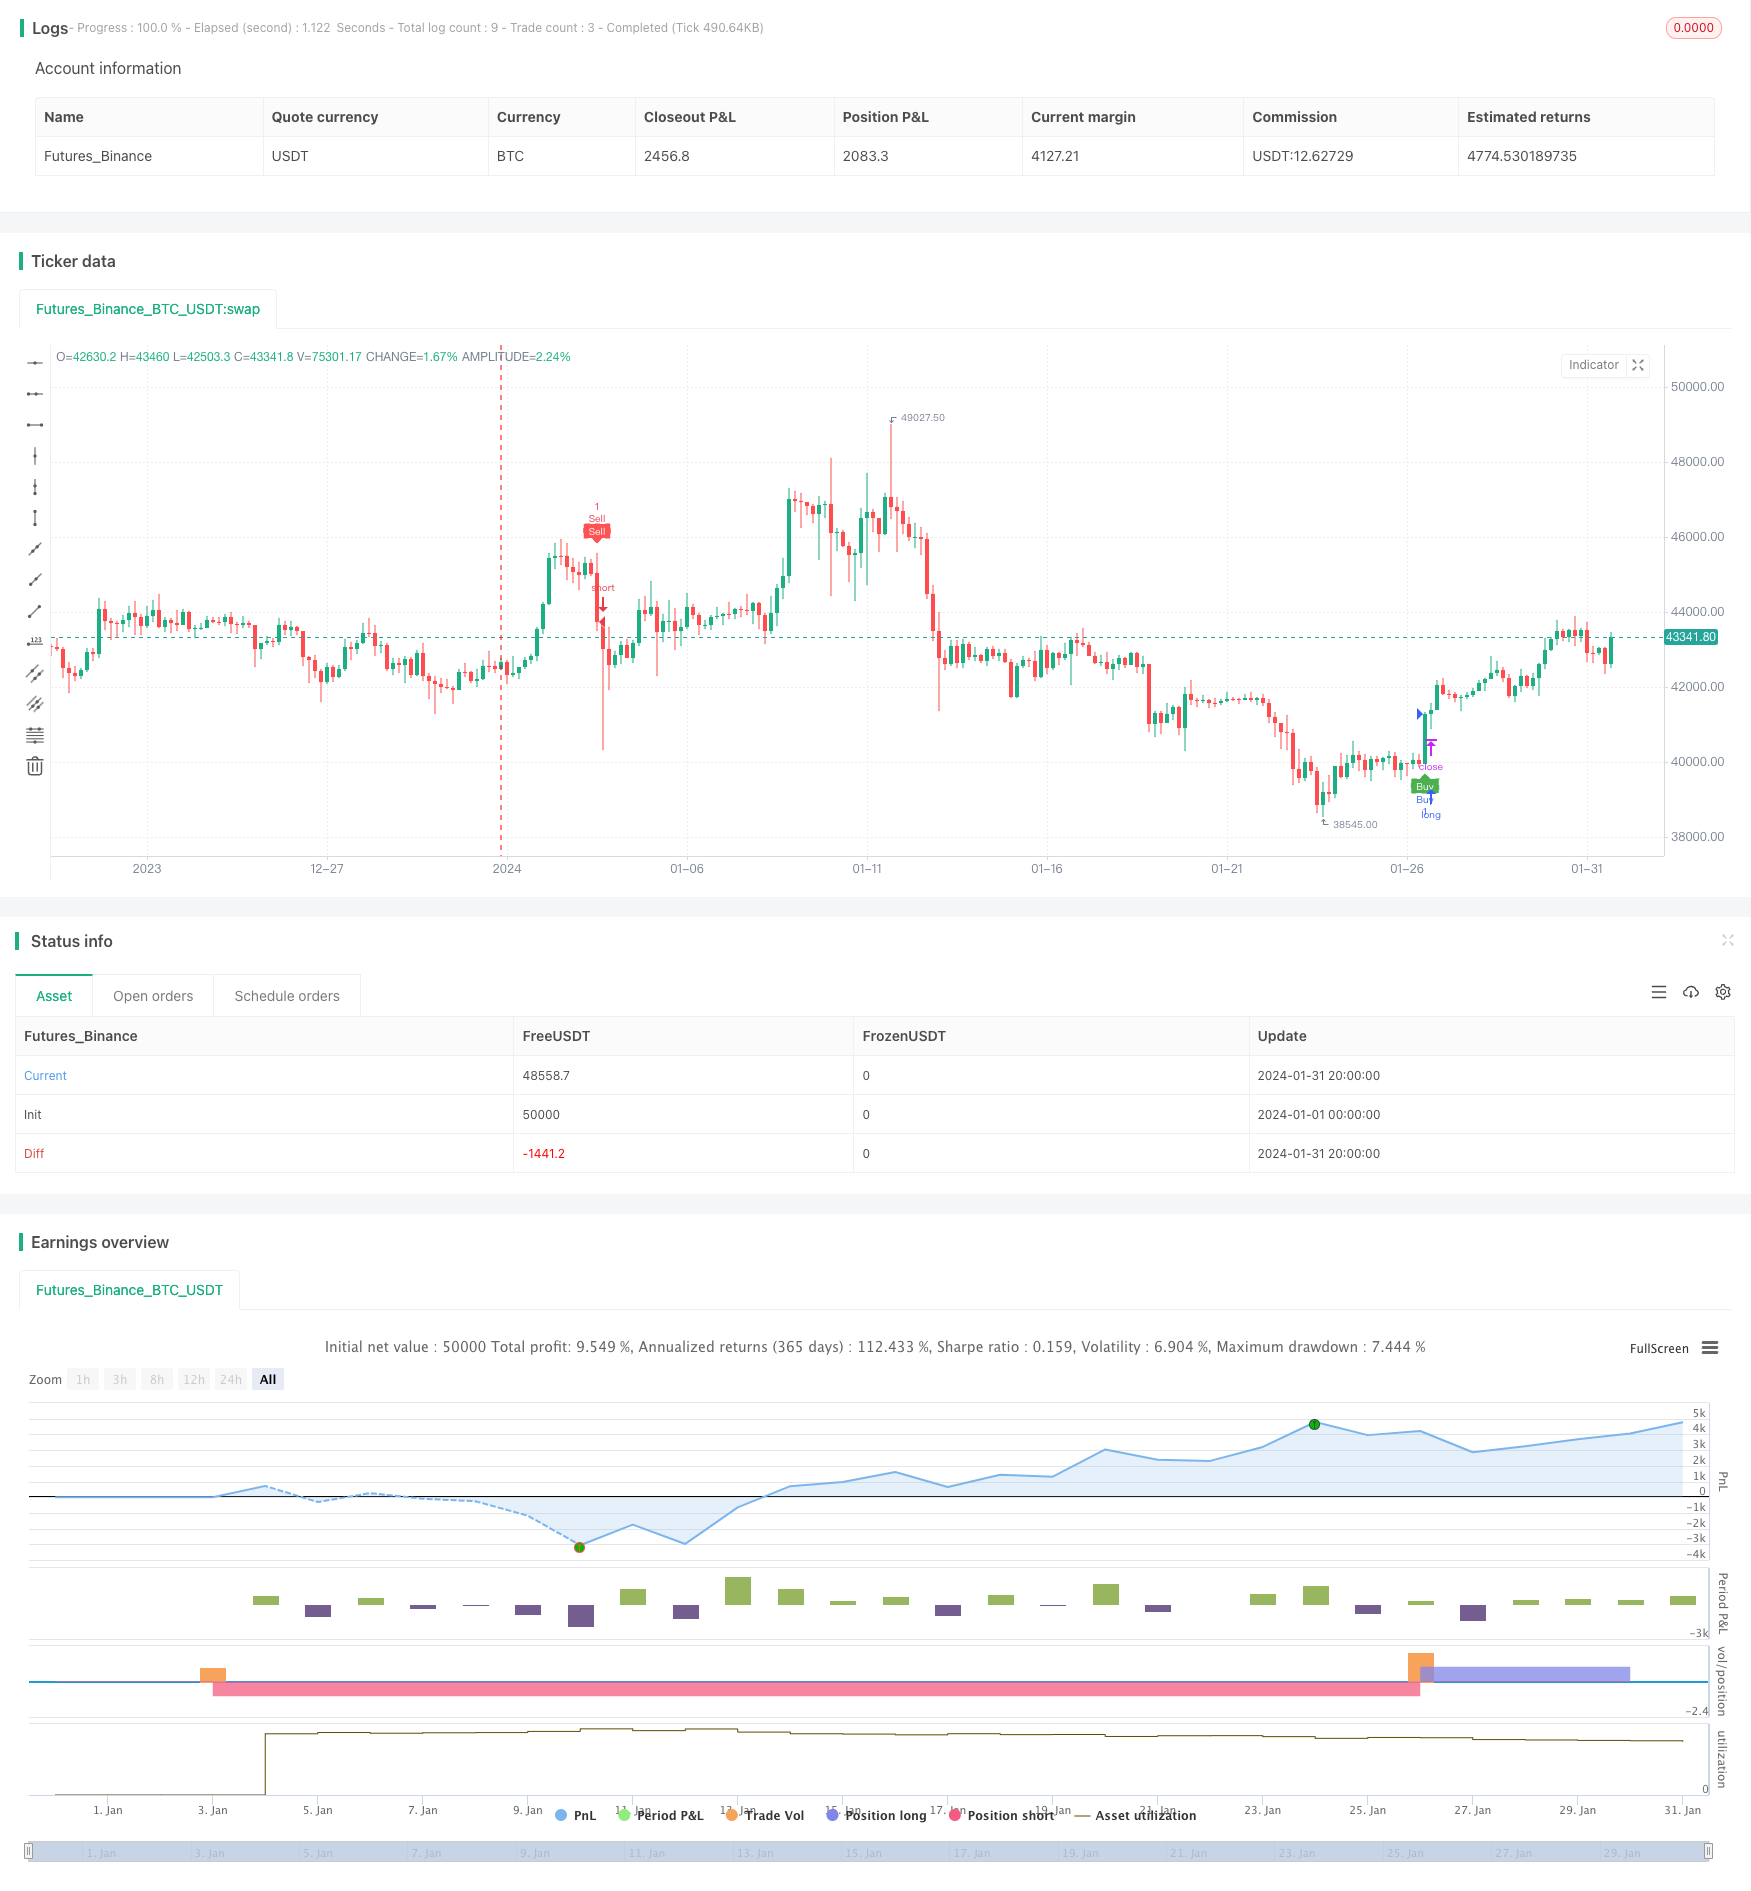
概要
この戦略は,二方向運動量指数DI+とDI−と平均方向指数ADXを計算して,指数移動平均EMAと組み合わせて取引信号を生成する.DI+をDI−とADXが20以上で穿越すると買取信号を生成する.DI−をDI−とADXが25以上で穿越すると売出信号を生成する.取引停止信号はDI−をDI+とADXが30以上で穿越するとだ.
戦略原則
計算するDI+DI-ADX
- 呼び出しta.dmi () 関数はDI+,DI-,ADXを計算する
- DI+/DI - 価格の方向性を反映する
- ADXは価格の変化の平均幅を表しています.
移動平均 EMA を計算する
- my_ema () 関数を呼び出し,EMAを計算する
- EMAは価格データを平らにする
取引シグナル生成
- 買入シグナル:DI+にDI-をつけ,ADX>20と閉店価格>EMA
- 価格が上昇し,変動幅が大きいことを説明する
- 販売シグナル:DI-以下でDI+を貫通し,ADX>25で閉盘価格
- 価格が下がり,変動幅が大きいことを示す
- 買入シグナル:DI+にDI-をつけ,ADX>20と閉店価格>EMA
取引停止
- 買取停止:DI+をDI-に装着してADX>30
- 価格の逆転を説明する
- 販売停止:DI+下穿越DI−とADX>30
- 価格の逆転を説明する
- 買取停止:DI+をDI-に装着してADX>30
全体として,この戦略は,運動量指標とトレンド指標を統合し,価格が傾向性があるときに取引シグナルを生成する.同時に,損失を制限する停止条件を設定する.
優位分析
- 偽信号を避けるために二重DIを使用
- 単一のDIは誤信号を発生しやすく,DI+とDI-の組み合わせはトレンド性を確保する
- ADX条件は,価格変動の幅が大きいことを保証する
- 価格変動が激化する時にだけ取引して,波動を避ける
- EMA条件はDIに対応する
- EMAは価格の中間長線トレンドを効果的に識別します.
- 厳格な停止条件
- タイムリーで止めて 巨額の損失を回避する
リスク分析
- 頻繁に止まる
- ストップダメージが頻発し,急激な振動が起こる
- パラメータ依存
- DIとADXのパラメータは最適の組み合わせを最適化する必要があります.
- 取引頻度が低い
- 厳しい取引条件により取引頻度が低下する
ストップ・ロスの幅を拡大し,パラメータの組み合わせを調整し,または追加のフィルタ条件を追加して取引頻度を向上させることで最適化できます.
最適化の方向
- パラメータ最適化
- DIとADXのパラメータを最適化して,最適なパラメータの組み合わせを見つける
- フィルターを追加
- 交代量,偏離などの条件をフィルタリングする信号
- ストップ・ローズを拡大
- 適切な緩解の停止条件, 頻繁に停止を減らす
要約する
この戦略は,運動量指標とトレンド分析指標を統合し,価格が強い傾向があるときに取引信号を生成する. 厳格なストップ条件を設定し,リスクを制御する.パラメータの最適化,信号フィルターの追加,およびストップの幅を適切に拡大することによって,戦略の効果をさらに向上させることができる.
ストラテジーソースコード
/*backtest
start: 2024-01-01 00:00:00
end: 2024-01-31 23:59:59
period: 4h
basePeriod: 15m
exchanges: [{"eid":"Futures_Binance","currency":"BTC_USDT"}]
*/

// This Pine Script™ code is subject to the terms of the Mozilla Public License 2.0 at https://mozilla.org/MPL/2.0/
// © Tamil_FNO_Trader

//@version=5
strategy("Overlay Signals by TFOT", overlay=true)

// Calculate DMI
len = input.int(14, minval=1, title="DI Length")
lensig = input.int(14, title="ADX Smoothing", minval=1, maxval=50)
[diplus, diminus, adx] = ta.dmi(len, lensig)

// Get EMA
emalen = input.int(26, minval=1, title = "EMA Length")
emasrc = input.source(close, title = "EMA Source")

my_ema(src, length) =>
    alpha = 2 / (length + 1)
    sum = 0.0
    sum := na(sum[1]) ? src : alpha * src + (1 - alpha) * nz(sum[1])
EMA2 = my_ema(emasrc, emalen)

// Variables
var bool buycondition1 = false
var bool sellcondition1 = false

var int firstbuybar = na
var int firstsellbar = na

var int buyexitbar = na
var int sellexitbar = na

var bool buyexit1 = false
var bool sellexit1 = false

// Buy & Sell Conditions
buycondition1 := (ta.crossover(diplus, diminus)) and (adx > 20) and (close > EMA2) and na(firstbuybar)
sellcondition1 := (ta.crossover(diminus, diplus)) and (adx > 25) and (close < EMA2) and na(firstsellbar)

buyexit1 := ta.crossover(diminus, diplus) and (adx > 30) and na(buyexitbar)
sellexit1 := ta.crossover(diplus, diminus) and (adx > 30) and na(sellexitbar)

if buycondition1
    if(na(firstbuybar))
        firstbuybar := bar_index
        buyexitbar := na
        firstsellbar := na
        strategy.entry("Buy", strategy.long)

if sellcondition1
    if(na(firstsellbar))
        firstsellbar := bar_index
        sellexitbar := na
        firstbuybar := na
        strategy.entry("Sell", strategy.short)

if buyexit1 and not na(firstbuybar)
    if(na(buyexitbar))
        buyexitbar := bar_index
        firstbuybar := na
        firstsellbar := na
        strategy.close("Buy")

if sellexit1 and not na(firstsellbar)
    if(na(sellexitbar))
        sellexitbar := bar_index
        firstsellbar := na
        firstbuybar := na
        strategy.close("Sell")

// Plot signals on chart
hl = input.bool(defval = true, title = "Signal Labels")

plotshape(hl and buycondition1 and bar_index == firstbuybar ? true : na, "Buy", style = shape.labelup, location = location.belowbar, color = color.green, text = "Buy", textcolor = color.white, size = size.tiny)
plotshape(hl and sellcondition1 and bar_index == firstsellbar ? true : na, "Sell", style = shape.labeldown, location = location.abovebar, color = color.red, text = "Sell", textcolor = color.white, size = size.tiny)

plotshape(hl and buyexit1 and bar_index == buyexitbar ? true : na, "Buy Exit", style = shape.labelup, location = location.belowbar, color = color.red, text = "Buy X", textcolor = color.white, size = size.tiny)
plotshape(hl and sellexit1 and bar_index == sellexitbar ? true : na, "Sell Exit", style = shape.labeldown, location = location.abovebar, color = color.red, text = "Sell X", textcolor = color.white, size = size.tiny)