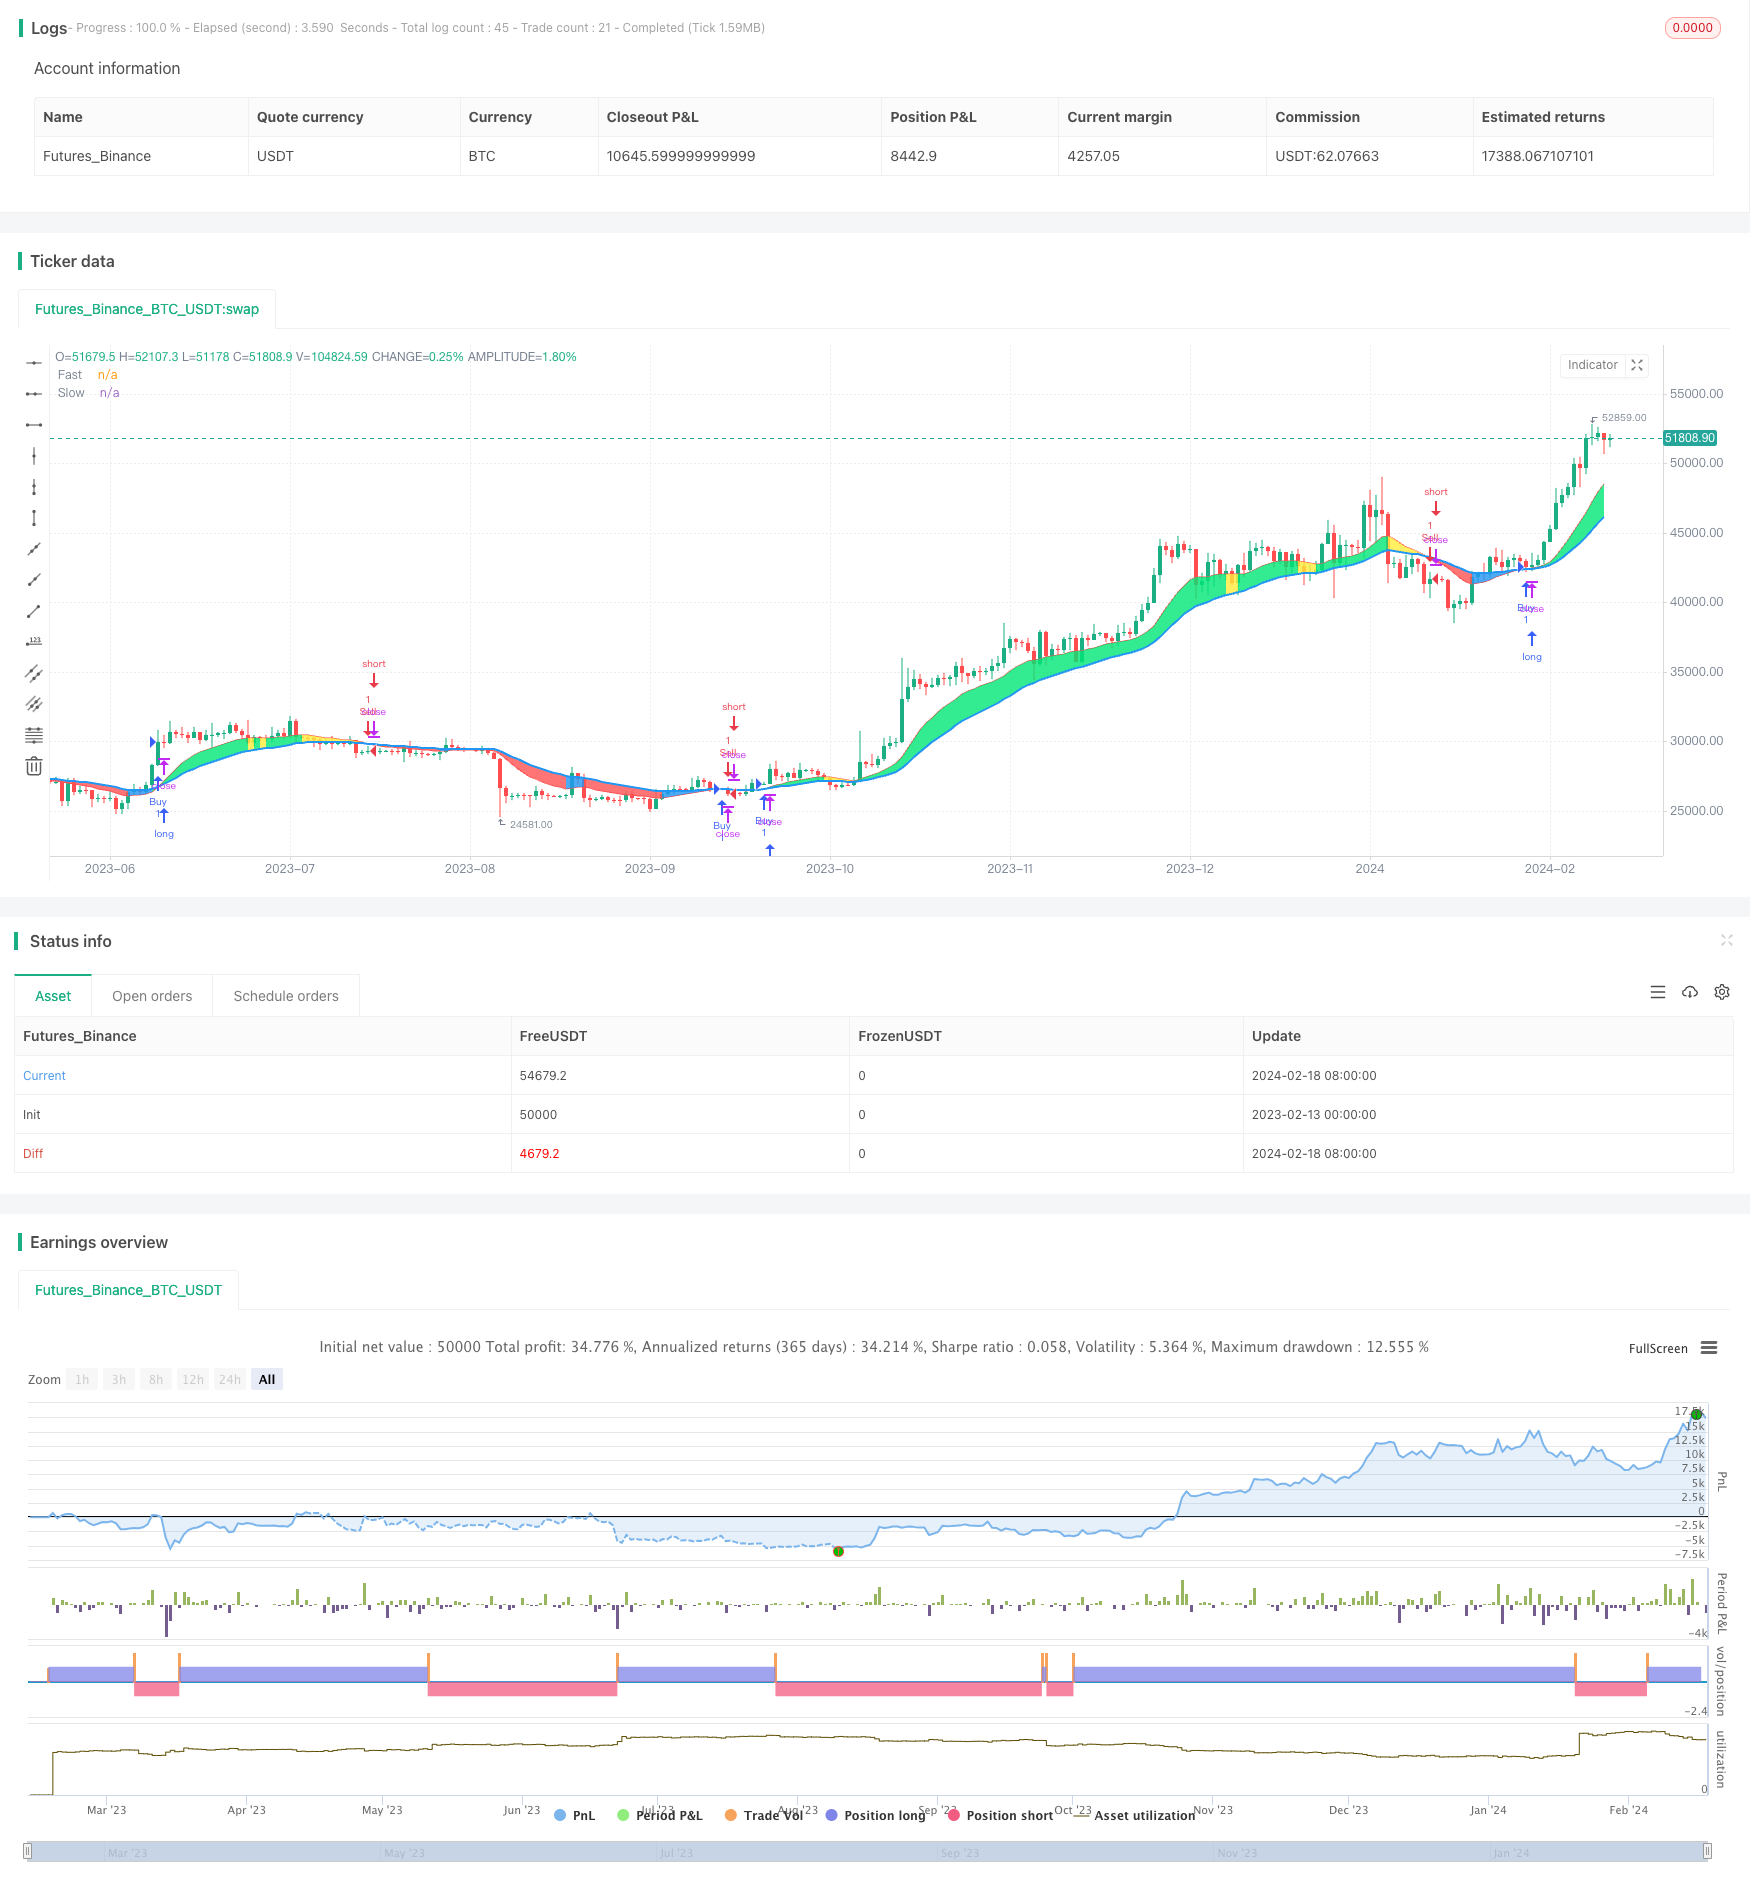
CDC 行動領域戦略

概要
CDCの活動地域[TSトレーダー]戦略は,CDCの移動領域指標改定に基づく定量取引戦略である.この戦略は,急速な移動平均と遅い移動平均の交差を買入と売却のシグナルとして使用する.急速な移動平均の上にゆっくりとした移動平均を横断すると買入のシグナルとして,急速な移動平均を下にゆっくりとした移動平均を横断すると売却のシグナルとして使用する.
戦略原則
この戦略の核心指標は,高速移動平均と遅い移動平均である.戦略は,まず価格の算術平均を計算し,その後,ユーザが設定した周期の長さに応じて,高速移動平均と遅い移動平均を計算する.高速移動平均の上に遅い移動平均を横断すると,牛市信号とみなされ,高速移動平均の下にある遅い移動平均を横断すると,熊市信号とみなされる.
市場動向を特定した後,戦略は,現在の閉店価格と移動平均の関係をさらに判断する.牛市であり,閉店価格が急速移動平均より高い場合は,強気買い信号;熊市であり,閉店価格が急速移動平均より低い場合は,強気売り信号.
これらの買入と売却のシグナルに基づいて,戦略は自動取引を行うことができる.買入シグナルが誘発されたときに,長所を入れ,空所を入れ,長所を入れ,または空所を入れ,販売シグナルが誘発されたときに.
優位分析
この戦略の利点は以下の通りです.
- 移動平均を基本指標として使用し,理論的な基礎は堅牢で,理解しやすい.
- 2つの移動平均を組み合わせると,市場騒音を効果的にフィルターし,市場動向を識別できます.
- 閉盤価格と移動平均の関係によって,強烈な買い売りタイミングが決定される.
- 戦略の論理はシンプルで明快で,取引を自動化することは容易です.
- 移動平均の周期は,市場によって調整され,異なる状況に適応することができます.
リスク分析
この戦略にはいくつかのリスクがあります.
- 移動平均は遅滞しており,ショートラインの機会を逃している可能性があります.
- 市場が上昇すると,さらに大きな損失を招く可能性もある.
- 観測データとリッシュディスクの差異があり,リッシュディスクの効果が低下する可能性がある.
これらのリスクに対して,他の指標を組み合わせて入場タイミングを決定するか,移動平均周期を適切に短縮して遅滞を減らすなどの方法を使用して最適化することができます.
最適化の方向
この戦略は以下の点で最適化できます.
- 移動平均のサイクルを最適化し,市場の変化に適応する.
- 偽の突破をフィルタリングし,取引量を増やす.
- 他の指標と組み合わせると 傾向が逆転する.
- ストップ・ロース戦略を追加して 損失をコントロールする.
要約する
CDCの活動地域は[TSトレーダー]戦略は,二重移動平均の交差を利用して,比較的シンプルで実用的な量化取引戦略を実現する.この戦略は,理解しやすく,実施しやすいという利点があるが,同時に,いくつかの最適化可能な空間もある.継続的なテストと最適化によって,この戦略は,長期間保持する価値のある安定した戦略になることができる.
/*backtest
start: 2023-02-13 00:00:00
end: 2024-02-19 00:00:00
period: 1d
basePeriod: 1h
exchanges: [{"eid":"Futures_Binance","currency":"BTC_USDT"}]
*/

//@version=4
strategy("CDC Action Zone [TS Trader]", overlay=true)

// CDC ActionZone V2 29 Sep 2016
// CDC ActionZone is based on a simple 2MA and is most suitable for use with medium volatility market
// 11 Nov 2016 : Ported to Trading View with minor UI enhancement

src = input(title="Data Array", type=input.source, defval=ohlc4)
prd1 = input(title="Short MA period", type=input.integer, defval=12)
prd2 = input(title="Long MA period", type=input.integer, defval=26)

AP = ema(src, 2)
Fast = ema(AP, prd1)
Slow = ema(AP, prd2)

// === INPUT BACKTEST RANGE ===
FromYear = input(defval = 2019, title = "From Year", minval = 2009)
FromMonth = input(defval = 1, title = "From Month", minval = 1, maxval = 12)
FromDay = input(defval = 1, title = "From Day", minval = 1, maxval = 31)
ToYear = input(defval = 9999, title = "To Year", minval = 2009)
ToMonth = input(defval = 12, title = "To Month", minval = 1, maxval = 12)
ToDay = input(defval = 31, title = "To Day", minval = 1, maxval = 31)

// === FUNCTION EXAMPLE ===
start = timestamp(FromYear, FromMonth, FromDay, 00, 00)  // backtest start window
finish = timestamp(ToYear, ToMonth, ToDay, 23, 59)        // backtest finish window
window() => true
Bullish = Fast > Slow
Bearish = Fast < Slow

Green = Bullish and AP > Fast
Red = Bearish and AP < Fast
Yellow = Bullish and AP < Fast
Blue = Bearish and AP > Fast

//Long Signal
Buy = Green and Green[1] == 0
Sell = Red and Red[1] == 0

//Short Signal
Short = Red and Red[1] == 0
Cover = Red[1] and Red == 0

//Plot
l1 = plot(Fast, "Fast", linewidth=1, color=color.red)
l2 = plot(Slow, "Slow", linewidth=2, color=color.blue)
bcolor = Green ? color.lime : Red ? color.red : Yellow ? color.yellow : Blue ? color.blue : color.white
barcolor(color=bcolor)
fill(l1, l2, bcolor)

strategy.entry("Buy", strategy.long, when=window() and Buy)
strategy.entry("Sell", strategy.short, when=window() and Sell)
strategy.close("Buy", when=window() and Sell)
strategy.close("Sell", when=window() and Buy)