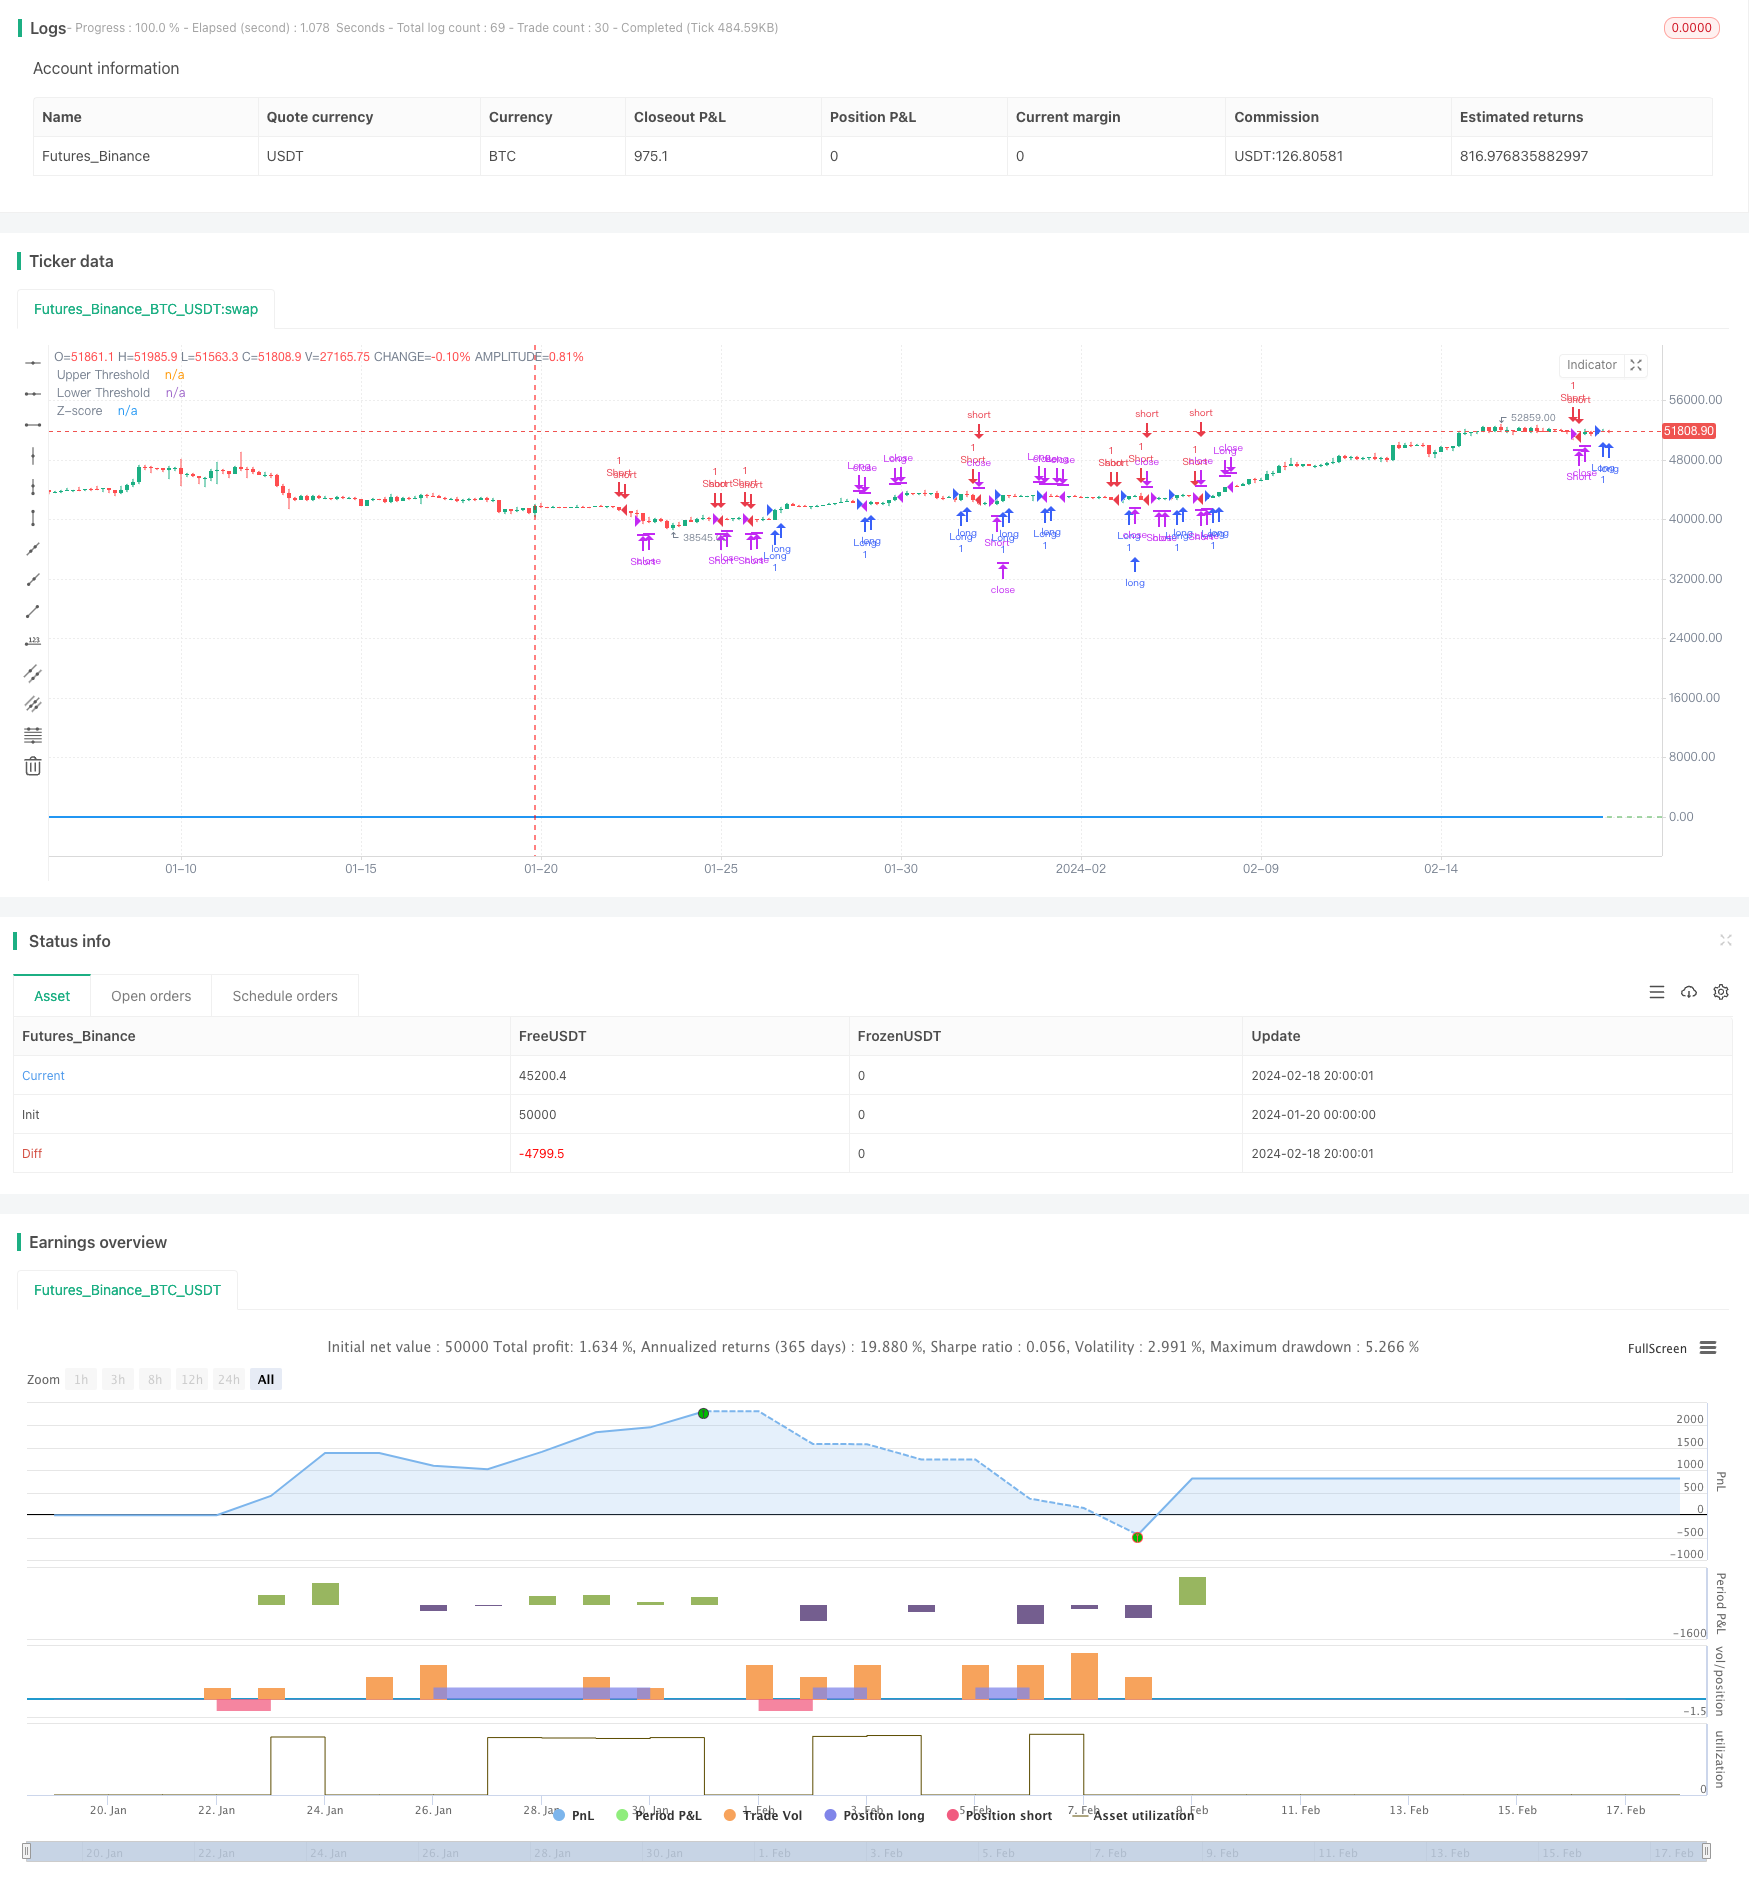
金のストップ・ロスのモメンタム・トレーディング戦略について
作者: リン・ハーンチャオチャン,日付: 2024-02-20 16:27:18タグ:

概要
この戦略は,市場における過買い・過売状況を決定するために,21日指数移動平均値から黄金の価格の偏差を計算する.偏差が標準偏差の特定の
戦略の論理
- ベースラインとして21日間の EMAを計算する
- EMAからの価格偏差を計算する
- Zスコアに偏差を標準化
- Zスコアが0.5を超えるとロング; Zスコアが0.5を下回るとショート
- Zスコアが0.5/-0.5の値に戻ったとき,ポジションを閉じる
- Zスコアが3以上または -3以下になるとストップ損失を設定します.
利点分析
この戦略の利点は次のとおりです.
- EMAは動的サポート/レジスタンスとして傾向を把握する
- Stddev と Z-Score は,誤った信号を減らすために,過剰購入/過剰販売レベルを効果的に測定します.
- 指数関数 EMA は,最近の価格により重みを付け,より敏感になります.
- Z-Scoreは統一判断規則の偏差を標準化します
- ストップ・ロスのメカニズムはリスクを制御し,損失を制限する.
リスク分析
考慮すべきいくつかのリスク:
- EMA は 価格 ギャップ や 突破 時に 間違った 信号 を 発信 する こと が でき ます
- Stddev/Z-Score の限界値は,最高のパフォーマンスのために適切に調整する必要があります
- ストップ・ロスの設定が正しくない場合,不必要な損失を引き起こす可能性があります.
- ブラック・スワン・イベントはストップ・ロスを引き起こす可能性があり,トレンド・オッチャンに失敗する可能性があります.
解決策:
- 主要なトレンドを特定するために EMA パラメータを最適化
- Stddev/Z-Score の最適な限界値を見つけるためのバックテスト
- トレイリングストップのテストストップ損失の合理性
- 市場の再評価 戦略を調整する
オプティマイゼーションの方向性
戦略を改善する方法:
- リスク意欲を測定するために,単純なStddevの代わりにATRのような変動指標を使用します.
- より良いベースラインのために異なる種類の移動平均をテストする
- 最良期間のEMAパラメータを最適化
- 性能向上のためにZスコアの限界値を最適化する
- よりスマートなリスク管理のために波動性に基づくストップを追加する
結論
一般的には,これは堅調なトレンドフォロー戦略である.トレンド方向と標準化偏差を定義するためにEMAを使用し,トレードシグナルのための過剰購入/過剰販売レベルを明確に識別する.利益が実行される間に合理的なストップ損失制御リスク.さらなるパラメータ調節と条件を追加することで,この戦略は実用的な適用のためにより堅牢になる.
/*backtest
start: 2024-01-20 00:00:00
end: 2024-02-19 00:00:00
period: 4h
basePeriod: 15m
exchanges: [{"eid":"Futures_Binance","currency":"BTC_USDT"}]
*/

//@version=5
strategy("GC Momentum Strategy with Stoploss and Limits", overlay=true)

// Input for the length of the EMA
ema_length = input.int(21, title="EMA Length", minval=1)

// Exponential function parameters
steepness = 2

// Calculate the EMA
ema = ta.ema(close, ema_length)

// Calculate the deviation of the close price from the EMA
deviation = close - ema

// Calculate the standard deviation of the deviation
std_dev = ta.stdev(deviation, ema_length)

// Calculate the Z-score
z_score = deviation / std_dev

// Long entry condition if Z-score crosses +0.5 and is below 3 standard deviations
long_condition = ta.crossover(z_score, 0.5)

// Short entry condition if Z-score crosses -0.5 and is above -3 standard deviations
short_condition = ta.crossunder(z_score, -0.5)

// Exit long position if Z-score converges below 0.5 from top
exit_long_condition = ta.crossunder(z_score, 0.5)

// Exit short position if Z-score converges above -0.5 from below
exit_short_condition = ta.crossover(z_score, -0.5)

// Stop loss condition if Z-score crosses above 3 or below -3
stop_loss_long = ta.crossover(z_score, 3)
stop_loss_short = ta.crossunder(z_score, -3)

// Enter and exit positions based on conditions
if (long_condition)
    strategy.entry("Long", strategy.long)
if (short_condition)
    strategy.entry("Short", strategy.short)
if (exit_long_condition)
    strategy.close("Long")
if (exit_short_condition)
    strategy.close("Short")
if (stop_loss_long)
    strategy.close("Long")
if (stop_loss_short)
    strategy.close("Short")

// Plot the Z-score on the chart
plot(z_score, title="Z-score", color=color.blue, linewidth=2)

// Optional: Plot zero lines for reference
hline(0.5, "Upper Threshold", color=color.red)
hline(-0.5, "Lower Threshold", color=color.green)
もっと
- EMA の 突破 罠 戦略
- ゴールデンクロス・デッドクロス・トレーディング戦略
- 超トレンドベースのマルチタイムフレームトレンド追跡戦略
- マニュアル 購入・販売 警告 戦略
- 定量的な突破アップトレンド基準戦略
- 定量的な取引プラットフォームに基づく適応型グリッド取引戦略
- イチモク・クラウドと移動平均値に基づく定量的な取引戦略
- 双動平均逆転追跡戦略
- Bollinger Bands 逆転戦略
- イチモク・キンコ・ヒョウ・クラウド+QQE 定量戦略
- パラボラオシレーター 高値と低値戦略を探し
- ボリンジャー・バンドのブレイクアウト戦略
- 画期的な公平価値格差戦略
- モメント・ブレイク付きの適応型移動平均クロスオーバーシステム
- トレーディング戦略はピーク・トゥ・ピーク・パターンをベースに
- マルチプル EMA 購入戦略
- OBV EMAのクロスオーバートレンド 戦略をフォローする
- RSIとMAのクロスオーバートレンド追跡戦略
- 双重確認の逆転モメンタム戦略
- EMAのクロスオーバーは,長距離量策について