マルチタイムフレームEMAブレイクアウトとローソク足パターンの組み合わせ戦略
作成日:
2024-02-21 15:00:06
最終変更日:
2024-02-21 15:00:06
コピー:
0
クリック数:
349
1
フォロー
1237
フォロワー
概要
この戦略は,多時間枠EMA指標とK線形状判断を融合させ,より敏感な長線信号捕捉と止損退出を実現する.
戦略原則
この戦略は,以下の指標を基に判断しています.
EMA平均線:13サイクル,21サイクル2グループEMAを用いて,価格突破を判断し取引信号を形成する.
K線形:K線実体方向を判断し,EMA指標と併用して,偽突破をフィルターする.
サポート抵抗:近年の10サイクル最高点の構築を採用し,この領域を通過した突破を判断し,信号信頼性を強化する.
上昇分時:120周期close閉盘価格がopen開盤価格の上に上昇分として判断されたとき,補助判断として.
取引シグナル生成のルールは次のとおりです.
多頭シグナル:高速EMAを上向きに突破し,陽線K線,閉空倉庫開多.
空頭シグナル:高速EMAは,ゆっくりとしたEMAを下回り,陰線K線として,多ポジションを平らにする.
止損退出:反手信号が出た時に止損退出.
戦略的優位性
- 複数のタイムフレームのEMA指標により,トレンドを判断し,偽突破を避けるのがより確実である.
- K線実体方向と組み合わせたフィルタリングにより,トレンドをより正確に識別できます.
- 時差判断を追加し,抵抗判断をサポートし,信号品質を保証する.
- 負債のリスクを低減するために,負債の返済を止めてください.
戦略リスク
- 不効突破は損失のリスクを伴う.複数の時間枠EMAとK線実体判断を導入しても,不効突破の戦略への影響を完全に回避することはできません.
- パラメータ選択リスク。EMA周期,K線判断周期などのパラメータを正しく設定しないことにより,信号品質が低下する。
- サポート抵抗の失敗のリスク. 支持抵抗の失敗は一般的な状況であり,信号が生成される時に十分な動力が欠如することにもつながる.
- 時差不効のリスク.時差は変動するので,時差判断に完全には頼れない.
上記のリスクは,過度な最適化を避け,パラメータを慎重に選択し,ポジションの規模を厳格に管理することによって軽減することができます.
戦略最適化の方向性
- 機械学習モデルの補助判断を導入する.分類モデルのK線実体方向判断を訓練し,判断精度を向上させる.
- トレーリングストップや波動率に基づくストップなどの自己適応的なストップメカニズムを追加する.
- 感情面分析と組み合わせて. メディアの世論判断の仕組みを導入し,重大ネガティブなニュースが戦略に影響を及ぼさないようにする.
- ポジション管理モジュールを追加する.固定ポジション比率の導入や,資金管理に基づくポジション調整モジュールを導入する.
要約する
この戦略は,多時間枠EMA指数とK線実体判断を統合し,より信頼性の高い傾向判断を実現する.同時に,サポート抵抗と分時状況と組み合わせて補助し,信号品質を保証する.反手信号機構のストップにより,単一のストップを効果的に制御することができる.将来,機械学習モデル,自主ストップ,感情面分析,ポジション管理モジュールなどの導入によって最適化され,戦略をより健全にすることができる.
ストラテジーソースコード
/*backtest
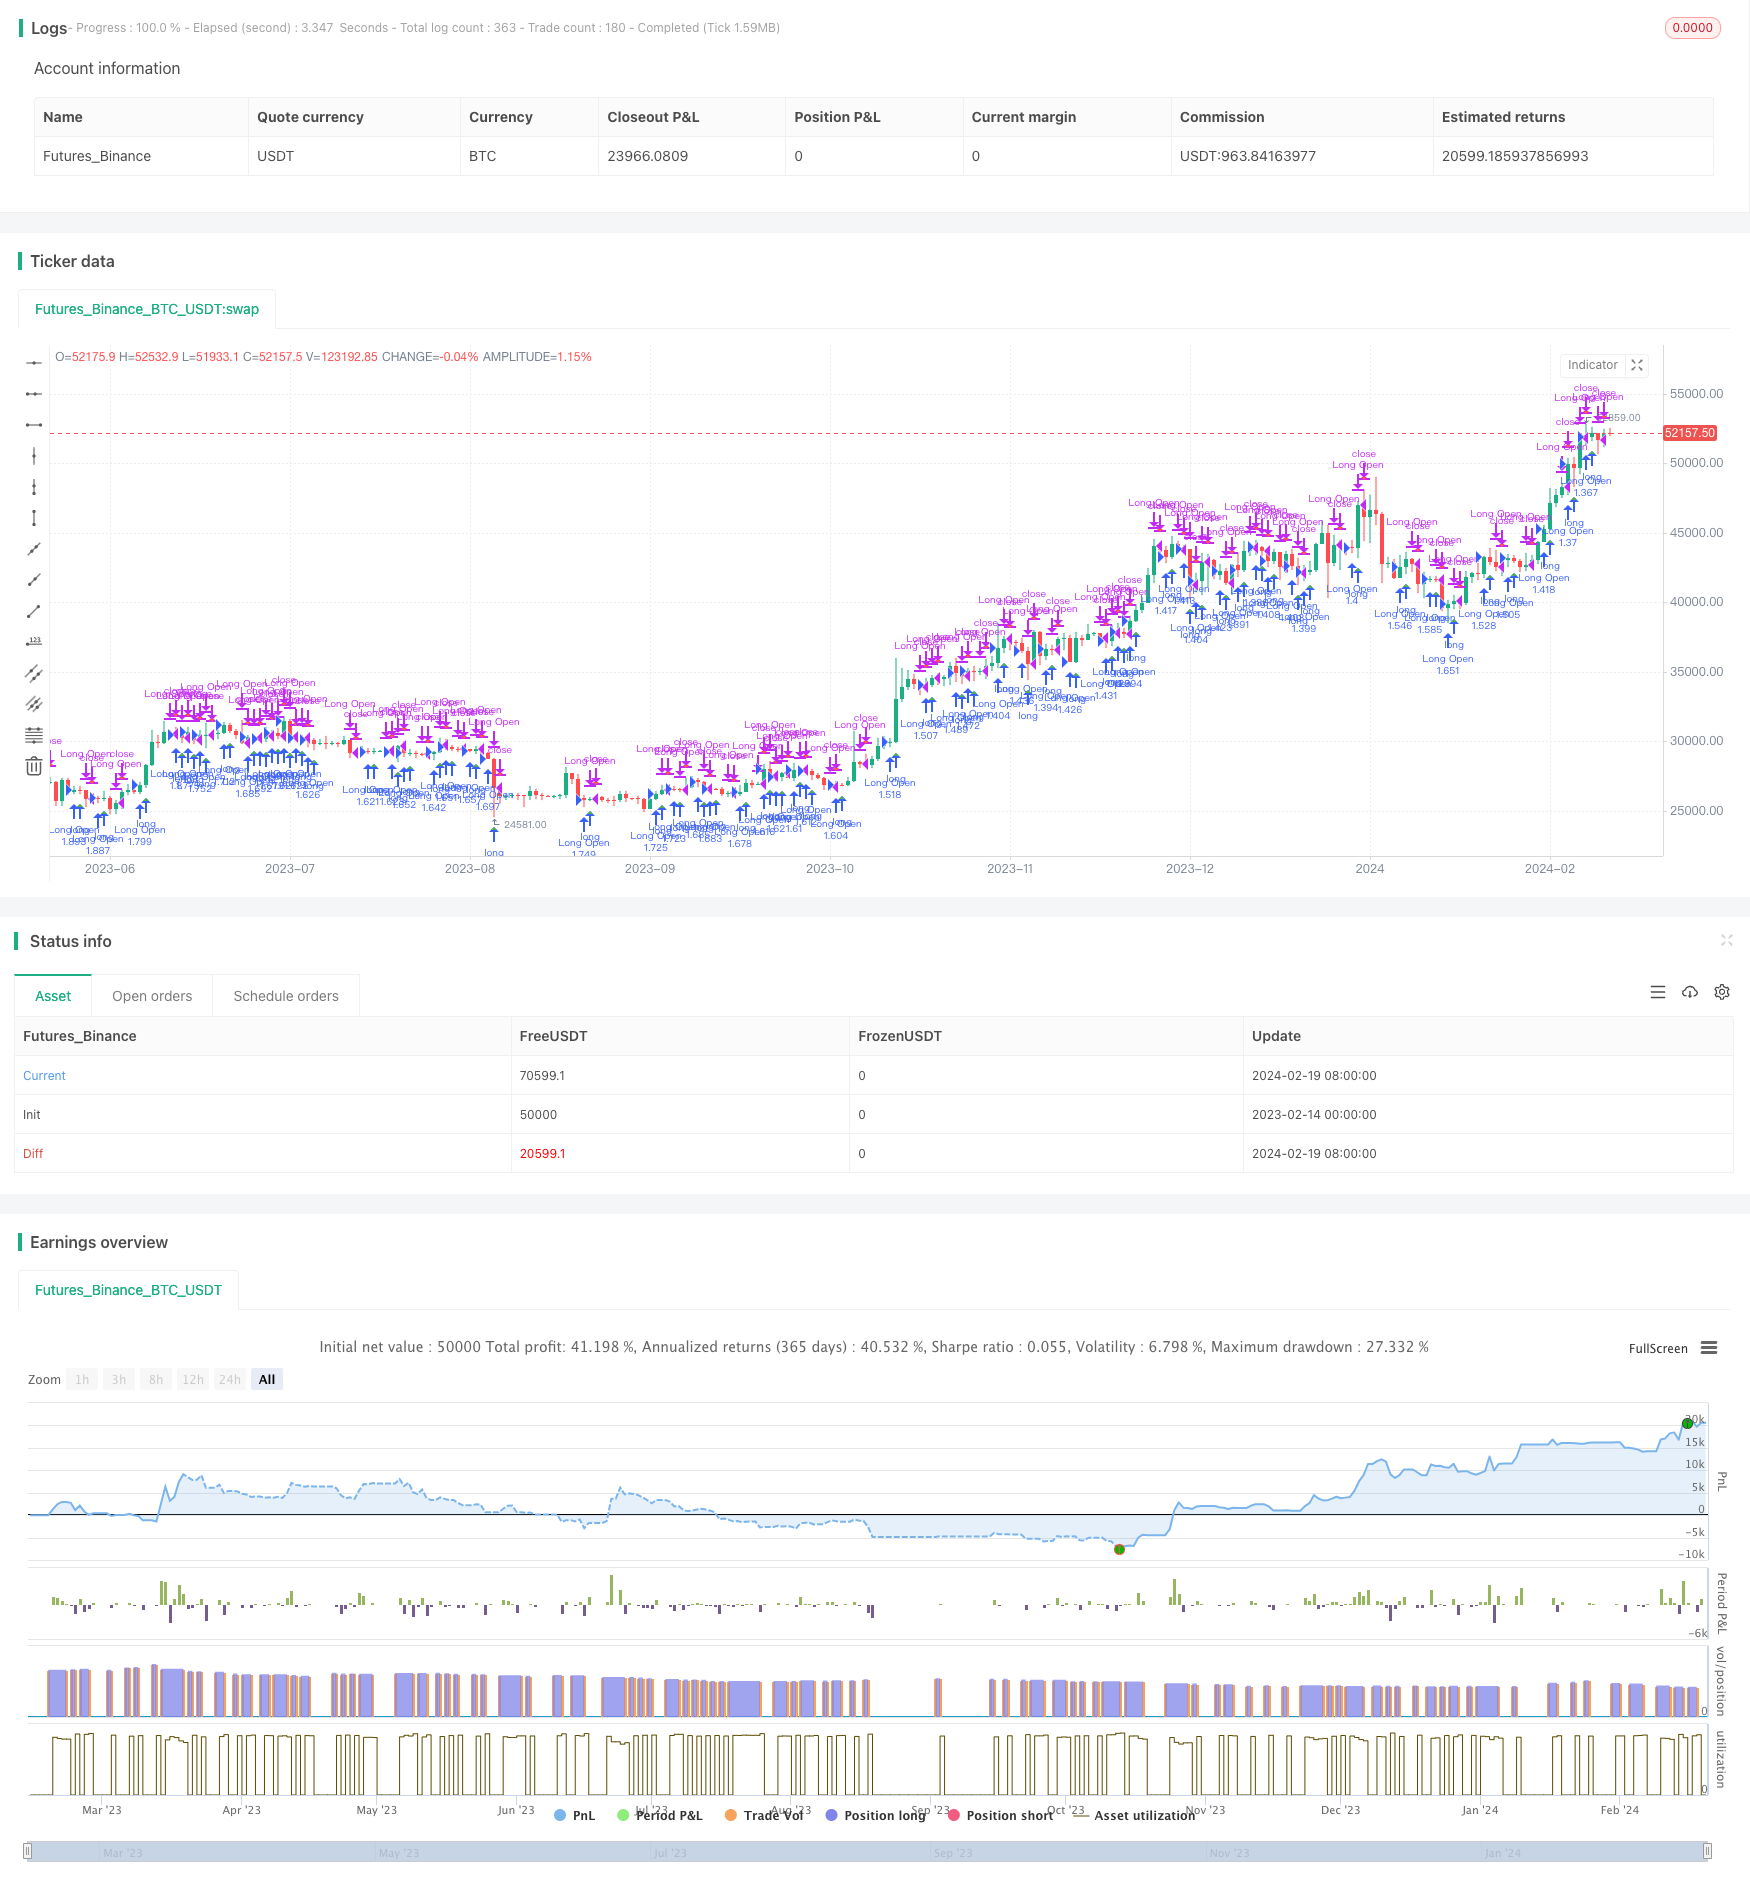
start: 2023-02-14 00:00:00
end: 2024-02-20 00:00:00
period: 1d
basePeriod: 1h
exchanges: [{"eid":"Futures_Binance","currency":"BTC_USDT"}]
*/
//@version=2
strategy(title='ck - CryptoSniper Longs Only (Strategy)', shorttitle='ck - CryptoSniper Longs (S) v1', overlay=true, precision=2, commission_value=0.25, default_qty_type=strategy.percent_of_equity, pyramiding=0, default_qty_value=100, initial_capital=100)
open_long = 0
close_position = 0
last_long=close
last_short=close
//Candle body resistance Channel-----------------------------//
len = 34
src = input(close, title="Candle body resistance Channel")
out = sma(src, len)
last8h = highest(close, 13)
lastl8 = lowest(close, 13)
bearish = cross(close,out) == 1 and falling(close, 1)
bullish = cross(close,out) == 1 and rising(close, 1)
channel2=false
//-----------------Support and Resistance
RST = input(title='Support / Resistance length:', defval=10)
RSTT = valuewhen(high >= highest(high, RST), high, 0)
RSTB = valuewhen(low <= lowest(low, RST), low, 0)
//--------------------Trend colour ema------------------------------------------------//
src0 = close, len0 = input(13, minval=1, title="EMA 1")
ema0 = ema(src0, len0)
direction = rising(ema0, 2) ? +1 : falling(ema0, 2) ? -1 : 0
//-------------------- ema 2------------------------------------------------//
src02 = close, len02 = input(21, minval=1, title="EMA 2")
ema02 = ema(src02, len02)
direction2 = rising(ema02, 2) ? +1 : falling(ema02, 2) ? -1 : 0
//=============Hull MA//
show_hma = false
hma_src = input(close, title="HullMA Source:")
hma_base_length = input(8, minval=1, title="HullMA Base Length:")
hma_length_scalar = input(5, minval=0, title="HullMA Length Scalar:")
hullma(src, length)=>wma(2*wma(src, length/2)-wma(src, length), round(sqrt(length)))
//============ signal Generator ==================================//
Period=input(title='Period', defval='120')
ch1 = request.security(syminfo.tickerid, Period, open)
ch2 = request.security(syminfo.tickerid, Period, close)
// Signals//
long = crossover(request.security(syminfo.tickerid, Period, close),request.security(syminfo.tickerid, Period, open))
short = crossunder(request.security(syminfo.tickerid, Period, close),request.security(syminfo.tickerid, Period, open))
last_long := long ? time : nz(last_long[1])
last_short := short ? time : nz(last_short[1])
long_signal = crossover(last_long, last_short) ? 1 : -1
short_signal = crossover(last_short, last_long) ? -1 : 1
if (long_signal == 1)
strategy.entry("Long Open", strategy.long)
if (short_signal == -1)
strategy.close("Long Open")
if (long_signal[1] == 1 and short_signal[1] == 1)
open_long := 1
close_position := 0
if (short_signal[1] == -1 and long_signal[1] == -1)
open_long := 0
close_position := 1
plotshape(open_long == 1, title="Open Long", location=location.belowbar, style=shape.triangleup, size=size.small, color=green, transp=10)
plotshape(close_position == 1, title="Close Long", location=location.abovebar, style=shape.triangledown, size=size.small, color=red, transp=10)
//plot(0, title="Trigger", color=white)
///////////////////////////////////////////////////////////////////////////////////////////