SPY RSI ストキャスティクス クロスオーバー 反転トレンド戦略
概要
SPY RSI ストキャスティックス クロス・バリュー・リバース・トレンド・ストラテジックは,RSI指標の快速線の交差を用い,価格の反転を判断する量化取引戦略である.この戦略は,慢速線,快速線およびMA線を組み合わせて,一定の条件下で,価格の大きな反転の機会を捕捉するために,買入と売却のシグナルを生成する.
戦略原則
この戦略のコアロジックは,RSI指標の快線交差に基づいています. RSIは通常,超買い超売り領域で反転します.したがって,高速RSIラインと遅いRSIラインの金叉と死叉を判断することによって,価格が反転する可能性のあるタイミングを事前に判断できます.具体的には,戦略は主に以下のいくつかの指標と条件に依存しています.
- スローRSI線: 64根周期に設定されたRSI線
- 急速RSI線 (Fast RSI):パラメータが9根周期に設定されているRSI線
- RSI MA線:快速RSI線に対する3根周期のシンプル移動平均
- RSI 超買区の値:パラメータは83に設定されています
- RSI 超売り区間の値:パラメータは 25 に設定
- RSI 中性帯: 39から61の間
- 取引時間は,その日の 9:00から翌日の 9:00まで設定されます.
速いRSI線が遅いRSI線 ((金叉) を穿過し,速い線がMA線を穿過すると,買入シグナルが生じます. 速いRSI線が遅いRSI線 ((死叉) を穿過し,速い線がMA線を穿過すると,売出シグナルが生じます.
また,ノイズ取引をフィルターするために,以下のような論理が設定されています.
- RSI 中立区間の取引信号は生成されません.
- 取引は,平日の9時~翌日の9時のみ
退場条件は以下の2つです.
- 急速なRSI線が反転区域 (超買区または超売り区) に入ると平仓
- RSIクロスシグナルが逆転したときに平仓
戦略的優位分析
SPY RSI ストキャスティックス 交差値反転トレンド戦略の最大の利点は,価格がより顕著な反転の前提でトレンドを捕捉できるということです. RSI 線を高速に交差することで,一定の時間前に取引信号を発信し,入場のためのチャンスを生み出すことができます. さらに,この戦略には以下の利点があります.
- 戦略信号生成のルールは明確で,理解し,追跡しやすい.
- ダブルフィルター設計により,部分的なノイズ信号を減少させる
- 市場環境により異なる超買超売区間の柔軟な設定
- トレンドトラッキングと反転キャプチャ機能
全体として,この戦略は,トレンド追跡と価値逆転判断を組み合わせて,価格逆転のタイミングを一定程度把握できるので,強力な実用性を持っています.
戦略的リスク分析
SPY RSI ストキャスティックス・クロス・トレンド・リバースの戦略には利点がありますが,以下の主要なリスクがあります.
- 2つのフィルターで設計されているにもかかわらず,騒音取引のリスクを完全に回避することはできません.
- RSIの交差は,価格の実際の反転点を正確に予測できないため,一定の難しさがあります.
- 適切なパラメータ設定を選択する必要があります. そうしないと,取引が頻繁すぎるとか稀な可能性があります.
- 突発的な出来事による偽の突破は完全に回避できない
この戦略は,以下の方法で最適化・改善できます.
- 機械学習のアルゴリズムを使って,最適なパラメータを訓練し,信号のノイズを低減する.
- 交差信号の信頼性を向上させるための技術指標の判断
- 単一取引のリスクの口を制御する
- 戦略の適応性を向上させるための最適化パラメータの自動更新
戦略最適化の方向性
SPY RSI ストキャスティクス 交差値反転のトレンド戦略は,以下のいくつかの点で最適化できます.
- パラメータ最適化遺伝的アルゴリズムや格子検索などのより体系的な方法により,最適のパラメータの組み合わせを見つけ出す.
- 特徴的な設計価格に影響を与える特性を追加し,取引量や変動率などの決定を助ける.
- 機械学習: 機械学習アルゴリズムを使って,交差判定を訓練し,正確性を向上させる
- ストップ・ロスト・最適化:浮動ストップ,時間ストップなどのメカニズムを導入し,リスクを制御する
- 更新に適応する: リアルタイムで市場状況に合わせて,重要なパラメータを自律的に調整する
これらの最適化は,戦略のパラメータをより賢くし,信号をより信頼性のあるものにするだけでなく,市場の変化に応じて戦略のルールを調整することができ,その結果,戦略の安定した収益性を大幅に向上させる.
要約する
SPY RSI ストキャスティックス 交差値反転トレンド戦略は,RSIの急減線の交差を判断することによって,比較的シンプルで明確な量化取引戦略を設計した. それは,トレンド追跡と反転取引の特性を組み合わせて,価格の反転のタイミングを一定程度把握することができる. しかし,この戦略には,パラメータ,特征およびモデルの最適化によってリスク制御,信号の質の向上を必要とする固有の欠陥があります.
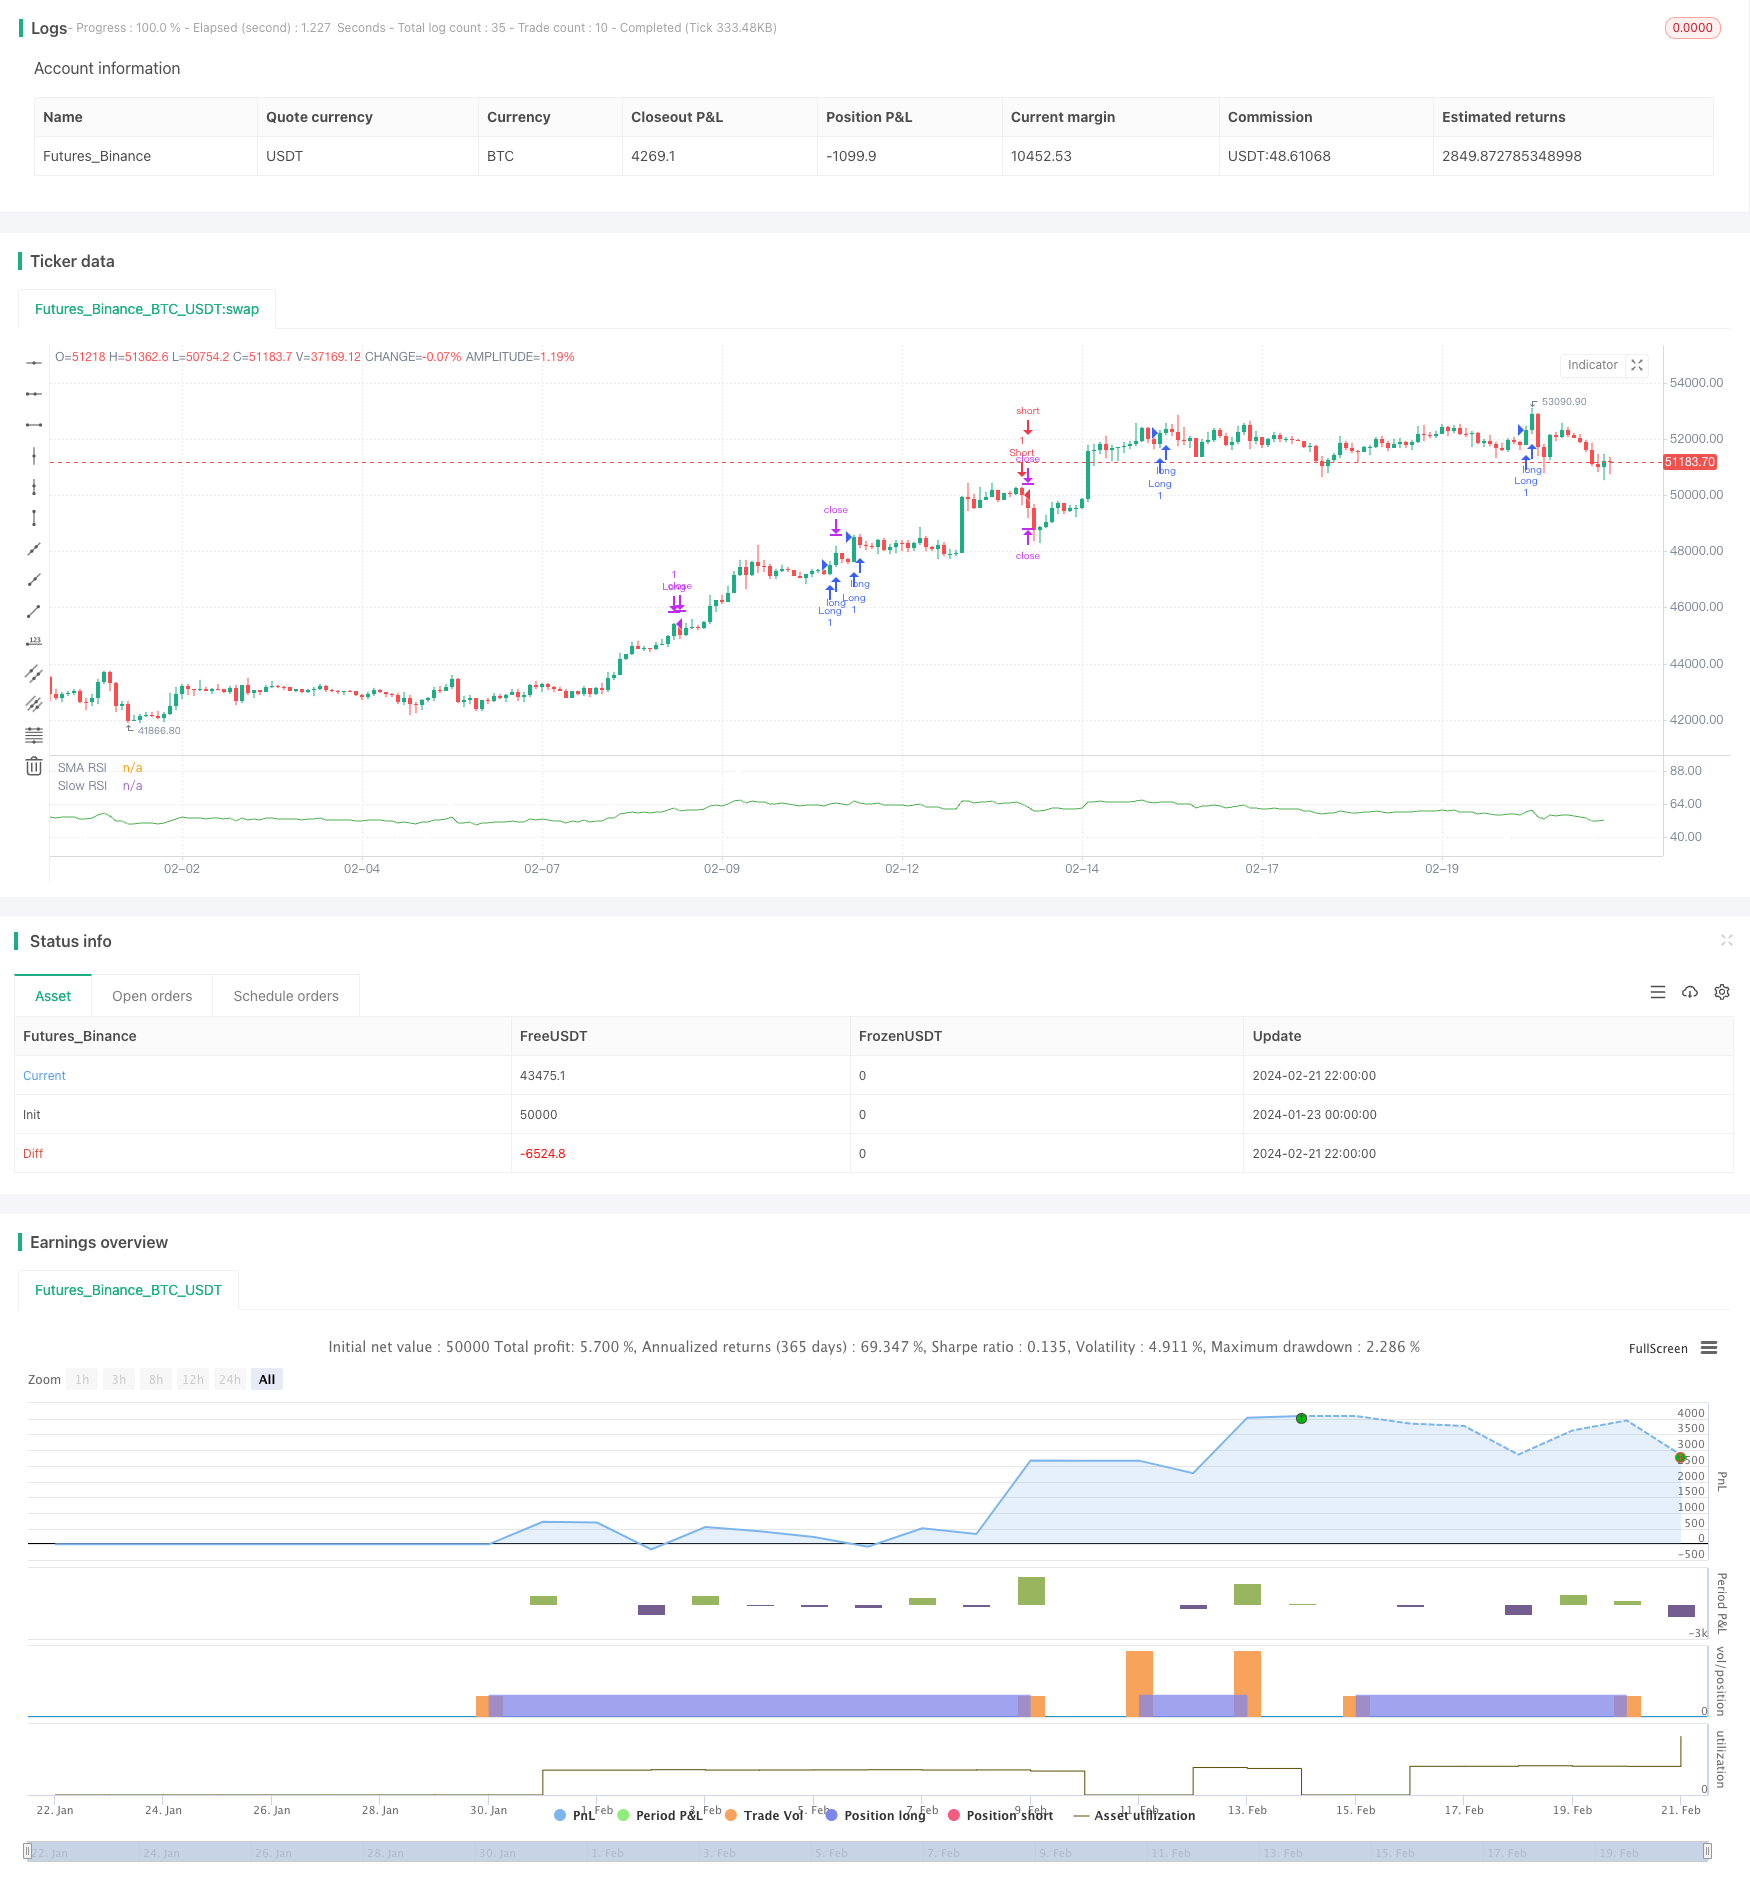
/*backtest
start: 2024-01-23 00:00:00
end: 2024-02-22 00:00:00
period: 2h
basePeriod: 15m
exchanges: [{"eid":"Futures_Binance","currency":"BTC_USDT"}]
*/

//@version=5
strategy("SPY Auto RSI Stochastics", pyramiding = 3)


// Input parameters
slowRSILength = input(64, title="SLOW RSI Length")
fastRSILength = input(9, title="FAST RSI Length")
smaRSILength = input(3, title="RSI SMA Length")
RSIUpperThreshold = input(83, title="RSI Upper")
RSILowerThreshold = input(25, title="RSI Lower")
RSIUpperDeadzone = input(61, title='RSI Upper Deadzone')
RSILowerDeadzone = input(39, title='RSI Lower Deadzone')
blockedDays = (dayofweek(time) == 1 or dayofweek(time) == 7)
sessionMarket = input("0900-0900", title="Session Start")
allowedTimes() => time(timeframe = timeframe.period, session = sessionMarket, timezone = "GMT+1")
isvalidTradeTime =true

// RSI and ATR
slowRSI = ta.rsi(close, slowRSILength)
fastRSI = ta.rsi(close, fastRSILength)
smaRSI = ta.sma(fastRSI, smaRSILength)
rsi = fastRSI

// Entry condition
RSIUptrend() =>  ta.crossover(fastRSI, slowRSI) and ta.crossover(fastRSI, smaRSI)
RSIDowntrend() =>  ta.crossunder(fastRSI, slowRSI) and ta.crossunder(fastRSI, smaRSI)


isRSIDeadzone() =>
    rsi < RSIUpperDeadzone and rsi > RSILowerDeadzone

isBullishEngulfing() =>
    close > high[1]

isBearishEngulfing() =>
    close < low[1]

// Declare variables
var float initialSLLong = na
var float initialTPLong = na
var float initialSLShort = na
var float initialTPShort = na
//var bool inATrade = false

entryConditionLong = RSIUptrend() and not isRSIDeadzone() and isvalidTradeTime
entryConditionShort = RSIDowntrend() and not isRSIDeadzone() and isvalidTradeTime

exitConditionLong = entryConditionShort or fastRSI > RSIUpperThreshold
exitConditionShort = entryConditionLong or fastRSI < RSILowerThreshold


if (entryConditionLong)
    strategy.entry(id = "Long", direction = strategy.long, alert_message = 'LONG! beep boop, all aboard the long train')

if (entryConditionShort)
    strategy.entry(id = "Short", direction = strategy.short, alert_message = 'Short! beep boop, all aboard the short train')

if (exitConditionLong)
    strategy.exit("Long", from_entry="Long", limit=close, alert_message = 'Stop Long, halt halt, take the profits and runnn')

if (exitConditionShort)
    strategy.exit("Short", from_entry="Short", limit=close, alert_message = 'Stop Short, halt halt, take the profits and runnn')


//plot(smaRSI, "RSI MA", color=color.red)
plot(slowRSI, "Slow RSI", color=color.green)
//plot(fastRSI, "Fast RSI", color=color.white)
plot(smaRSI, "SMA RSI", color=color.white)