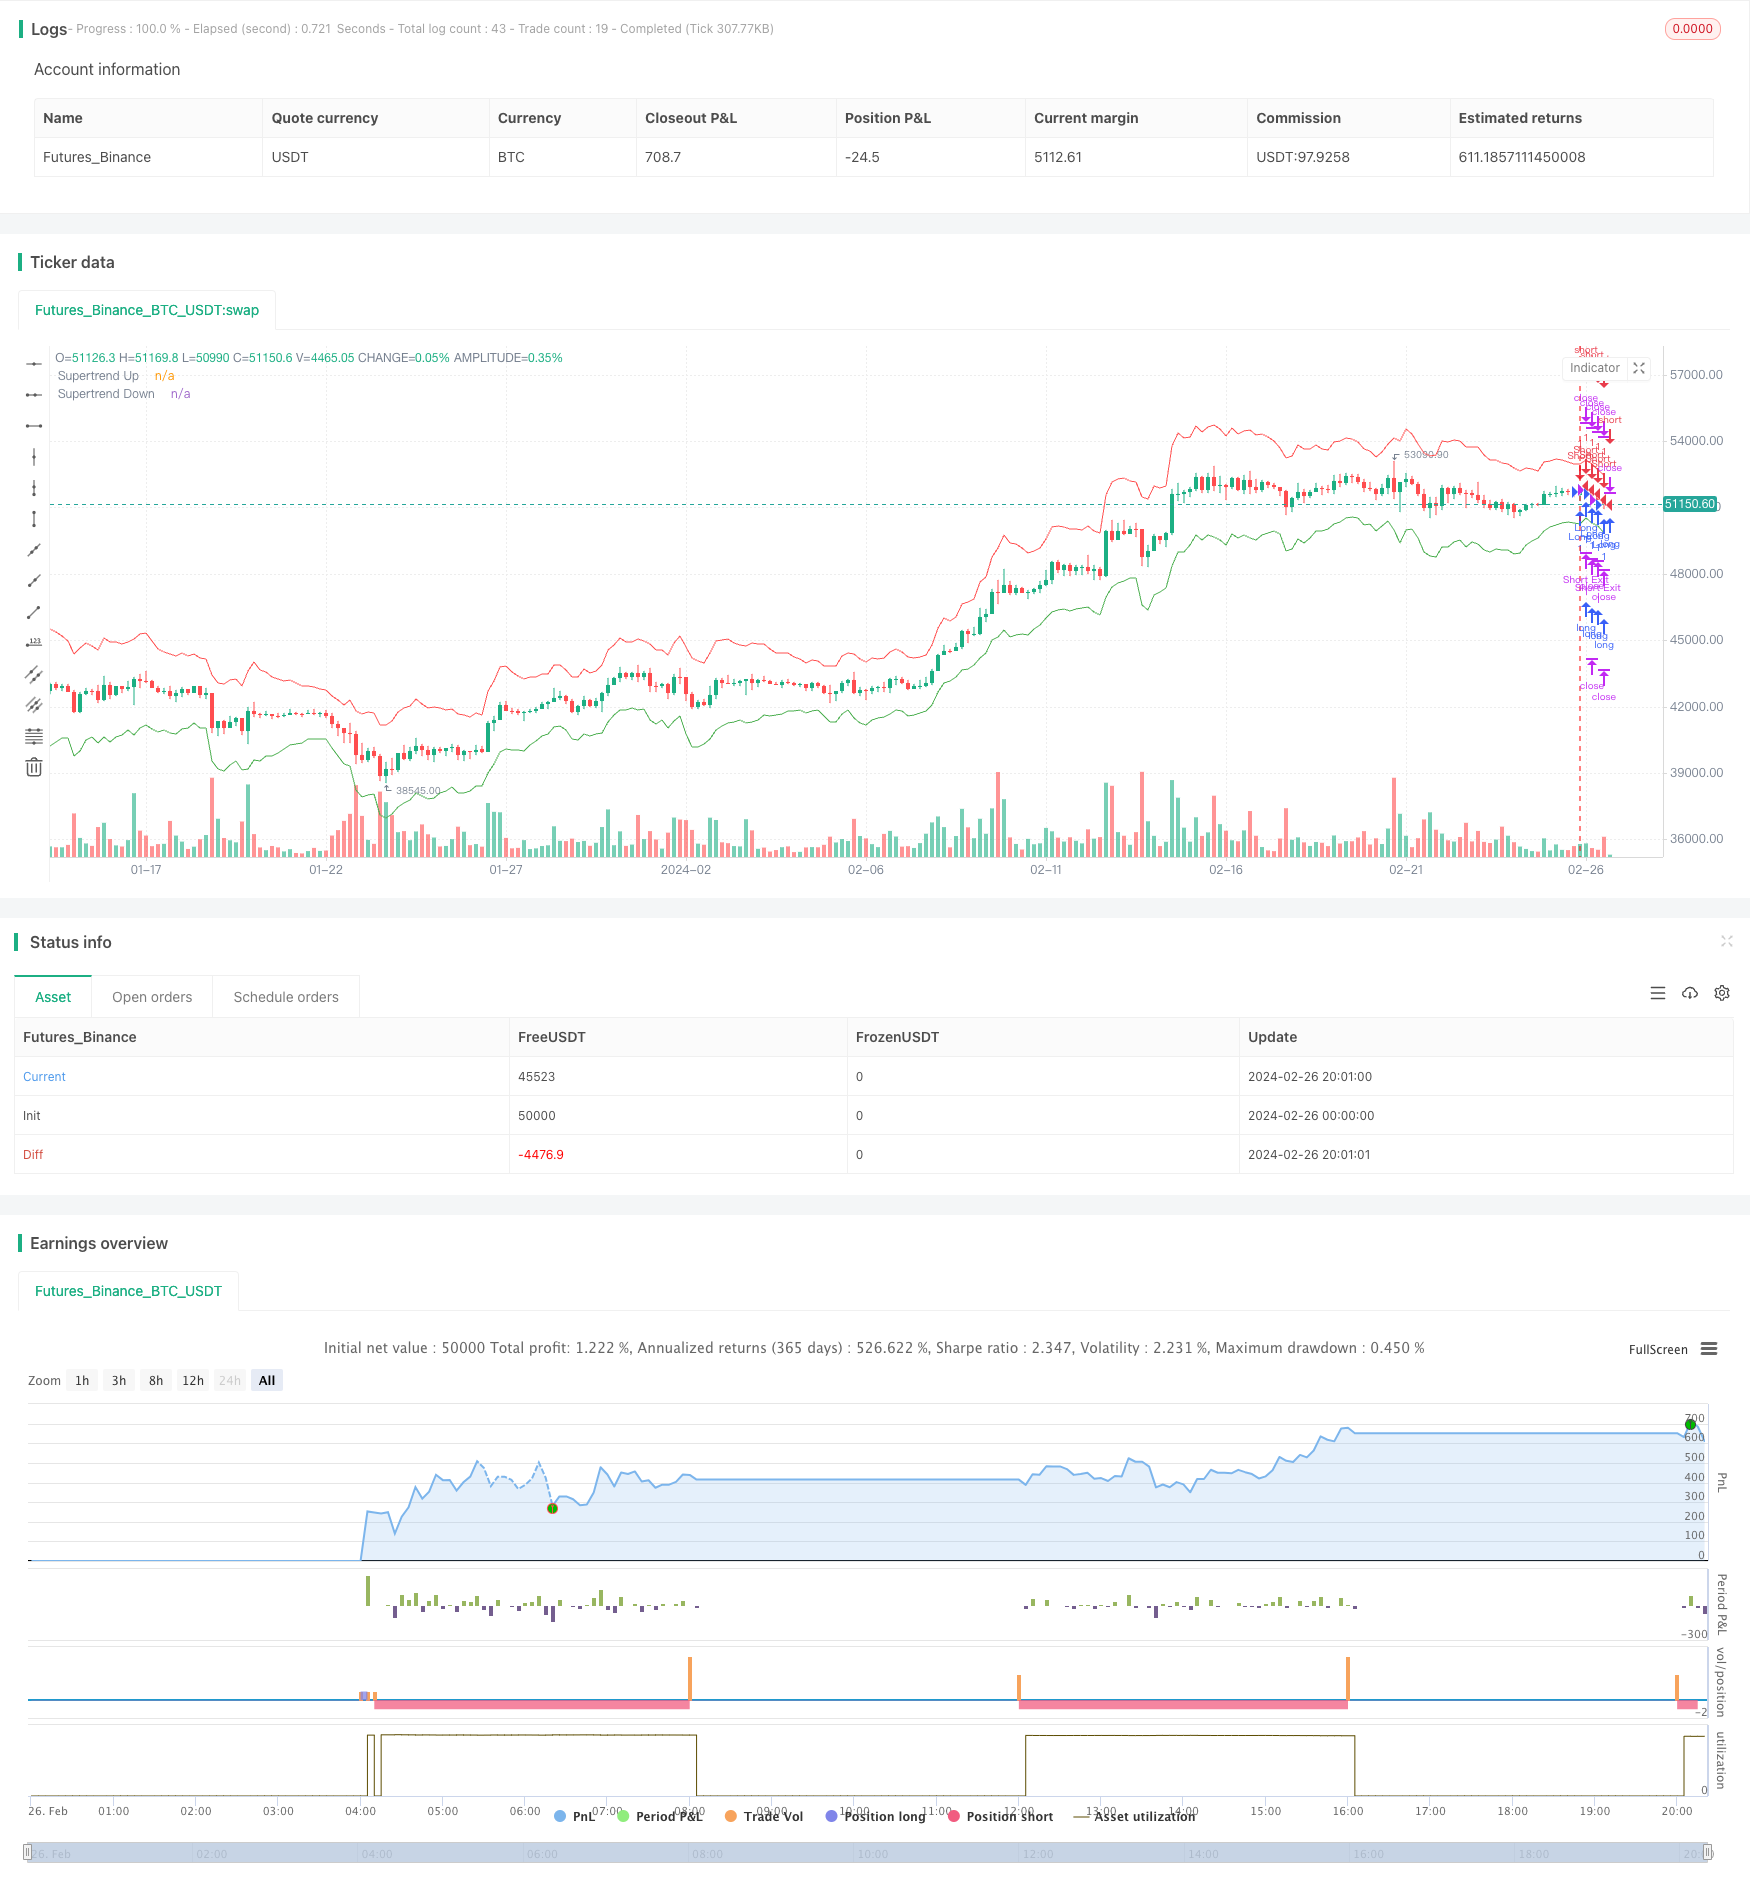
スーパートレンド ブレイクアウト戦略
作者: リン・ハーンチャオチャン, 日付: 2024-02-28 18:12:47タグ:

概要
この戦略は,価格がスーパートレンド指標によって形成された上昇傾向/下落傾向チャネルを突破したときの取引信号を生成します.この戦略は優れたトレンドフォロー能力を持っています.
戦略の論理
この戦略は,まずATR指標を価格変動の指標として計算し,それを上位および下位帯を計算するために最高,最低,閉値の平均と組み合わせます. 上向きのトレンド中に価格が下向きの帯を超えると,購入信号が生成されます. 下向きのトレンド中に価格が上向きの帯を下に突破すると,販売信号が起動します.これは価格のトレンドを追跡する適応的上向き/下向きチャネルを形成します.
市場に入ると,戦略は目標利益とストップ損失を設定する.価格が利益目標に達すると利益を得るためにポジションを閉じて,引き下げがストップ損失レベルに達すると停止する.
利点分析
この戦略の最大の利点は,優れたトレンドフォロー能力である.適応チャネルはトレンド変化を迅速に把握することができる.ATRを使用すると,勢いとともに取引の確実性も得られる.また,利益目標とストップ損失メカニズムは明確なリスク/報酬制御を提供します.
リスク分析
主要なリスクは,価格が常に帯を貫通しているため,レンジ・バインド市場では過剰なウィプソーを生む可能性があります.また,ストップ・ロスの設定は最終結果にも直接影響します.
このようなリスクを軽減するために,ATR期またはチャネル倍数などのパラメータは,真のトレンドにより適するように最適化することができる.また,ウィップソウを避けるために,入口信号に他のフィルターも追加することができる.
増進 の 機会
この戦略は,いくつかの側面で強化できます.
-
ATR パラメータを最適化して実際の変動動態をより良く反映する.
-
チャンネル幅の最適化のために異なる倍数をテストします.
-
記入物へのフィルターとして他の指標を追加します.例えば,MACDにより良いタイミングのために.
-
利潤目標とストップ・ロスのレベルを最適化して リスク調整されたリターンを最大化します
-
全体の品質を評価するために シャープ比率や利益因子などの他の目標を考慮してください
概要
この戦略は,適応チャネルブレイクアウトモデルを利用して,大きなトレンドフォロー能力を達成する.また,明確なリスク制御メカニズムを持っています.さらなるパラメータチューニングと論理強化により,さまざまな市場条件や資産クラスでさらにうまく機能する可能性があります.
/*backtest
start: 2024-02-26 00:00:00
end: 2024-02-26 20:20:00
period: 4h
basePeriod: 15m
exchanges: [{"eid":"Futures_Binance","currency":"BTC_USDT"}]
*/

//@version=5
strategy("Supertrend Strategy", overlay=true)

// Input parameters
atr_length = input.int(10, title="ATR Length")
multiplier = input.float(3.0, title="Multiplier")

target_points = input.int(100, title="Target Points")
stop_loss_points = input.int(50, title="Stop Loss Points")

// Calculate ATR and Supertrend
atr = ta.atr(atr_length)
upper_band = hlc3 + (multiplier * atr)
lower_band = hlc3 - (multiplier * atr)
is_uptrend = close > lower_band
is_downtrend = close < upper_band
trend_changed = (is_uptrend[1] and is_downtrend) or (is_downtrend[1] and is_uptrend)

// Strategy logic
long_condition = is_uptrend and trend_changed
short_condition = is_downtrend and trend_changed

// Plot Supertrend
plot(is_uptrend ? lower_band : na, color=color.green, title="Supertrend Up", style=plot.style_linebr)
plot(is_downtrend ? upper_band : na, color=color.red, title="Supertrend Down", style=plot.style_linebr)

// Strategy entry and exit
if long_condition
    strategy.entry("Long", strategy.long)
if short_condition
    strategy.entry("Short", strategy.short)

// Calculate target and stop loss levels
long_target = strategy.position_avg_price + target_points
long_stop_loss = strategy.position_avg_price - stop_loss_points
short_target = strategy.position_avg_price - target_points
short_stop_loss = strategy.position_avg_price + stop_loss_points

// Strategy exit
strategy.exit("Long Exit", "Long", limit=long_target, stop=long_stop_loss)
strategy.exit("Short Exit", "Short", limit=short_target, stop=short_stop_loss)
- 双 EMA クロスオーバー トレンド トラッキング 戦略
- 双動平均値とMACD組み合わせの取引戦略
- ダイナミック・グロング・トレンド・戦略
- マルチタイムフレーム移動平均回帰取引戦略
- 動向平均波動性の二重追跡戦略
- 短期取引戦略 ボリンジャー帯に基づいて
- MOST と KAMA をベースにしたトレンドライディング戦略
- 戦略をフォローするダブルタイムフレームトレンド
- Bitlinc MARSI トレーディング戦略
- ボリンジャー帯の追跡戦略
- 二重EMA戦略分析
- 突破口のコールバック・トレーディング戦略
- 移動平均のクロスオーバートレンド戦略
- 価格チャネルロボットホワイトボックス戦略
- 単純な移動平均値トレンド 定量戦略
- ATR ストップ ロス 購入 戦略
- バイノミアルモメンタムブレイク逆転戦略
- ギャップを切り開く戦略
- ATR トレイリングストップ戦略とフィボナッチリトレースメント目標
- ボリンジャー・バンドス ブレイクトレンド・トレード戦略