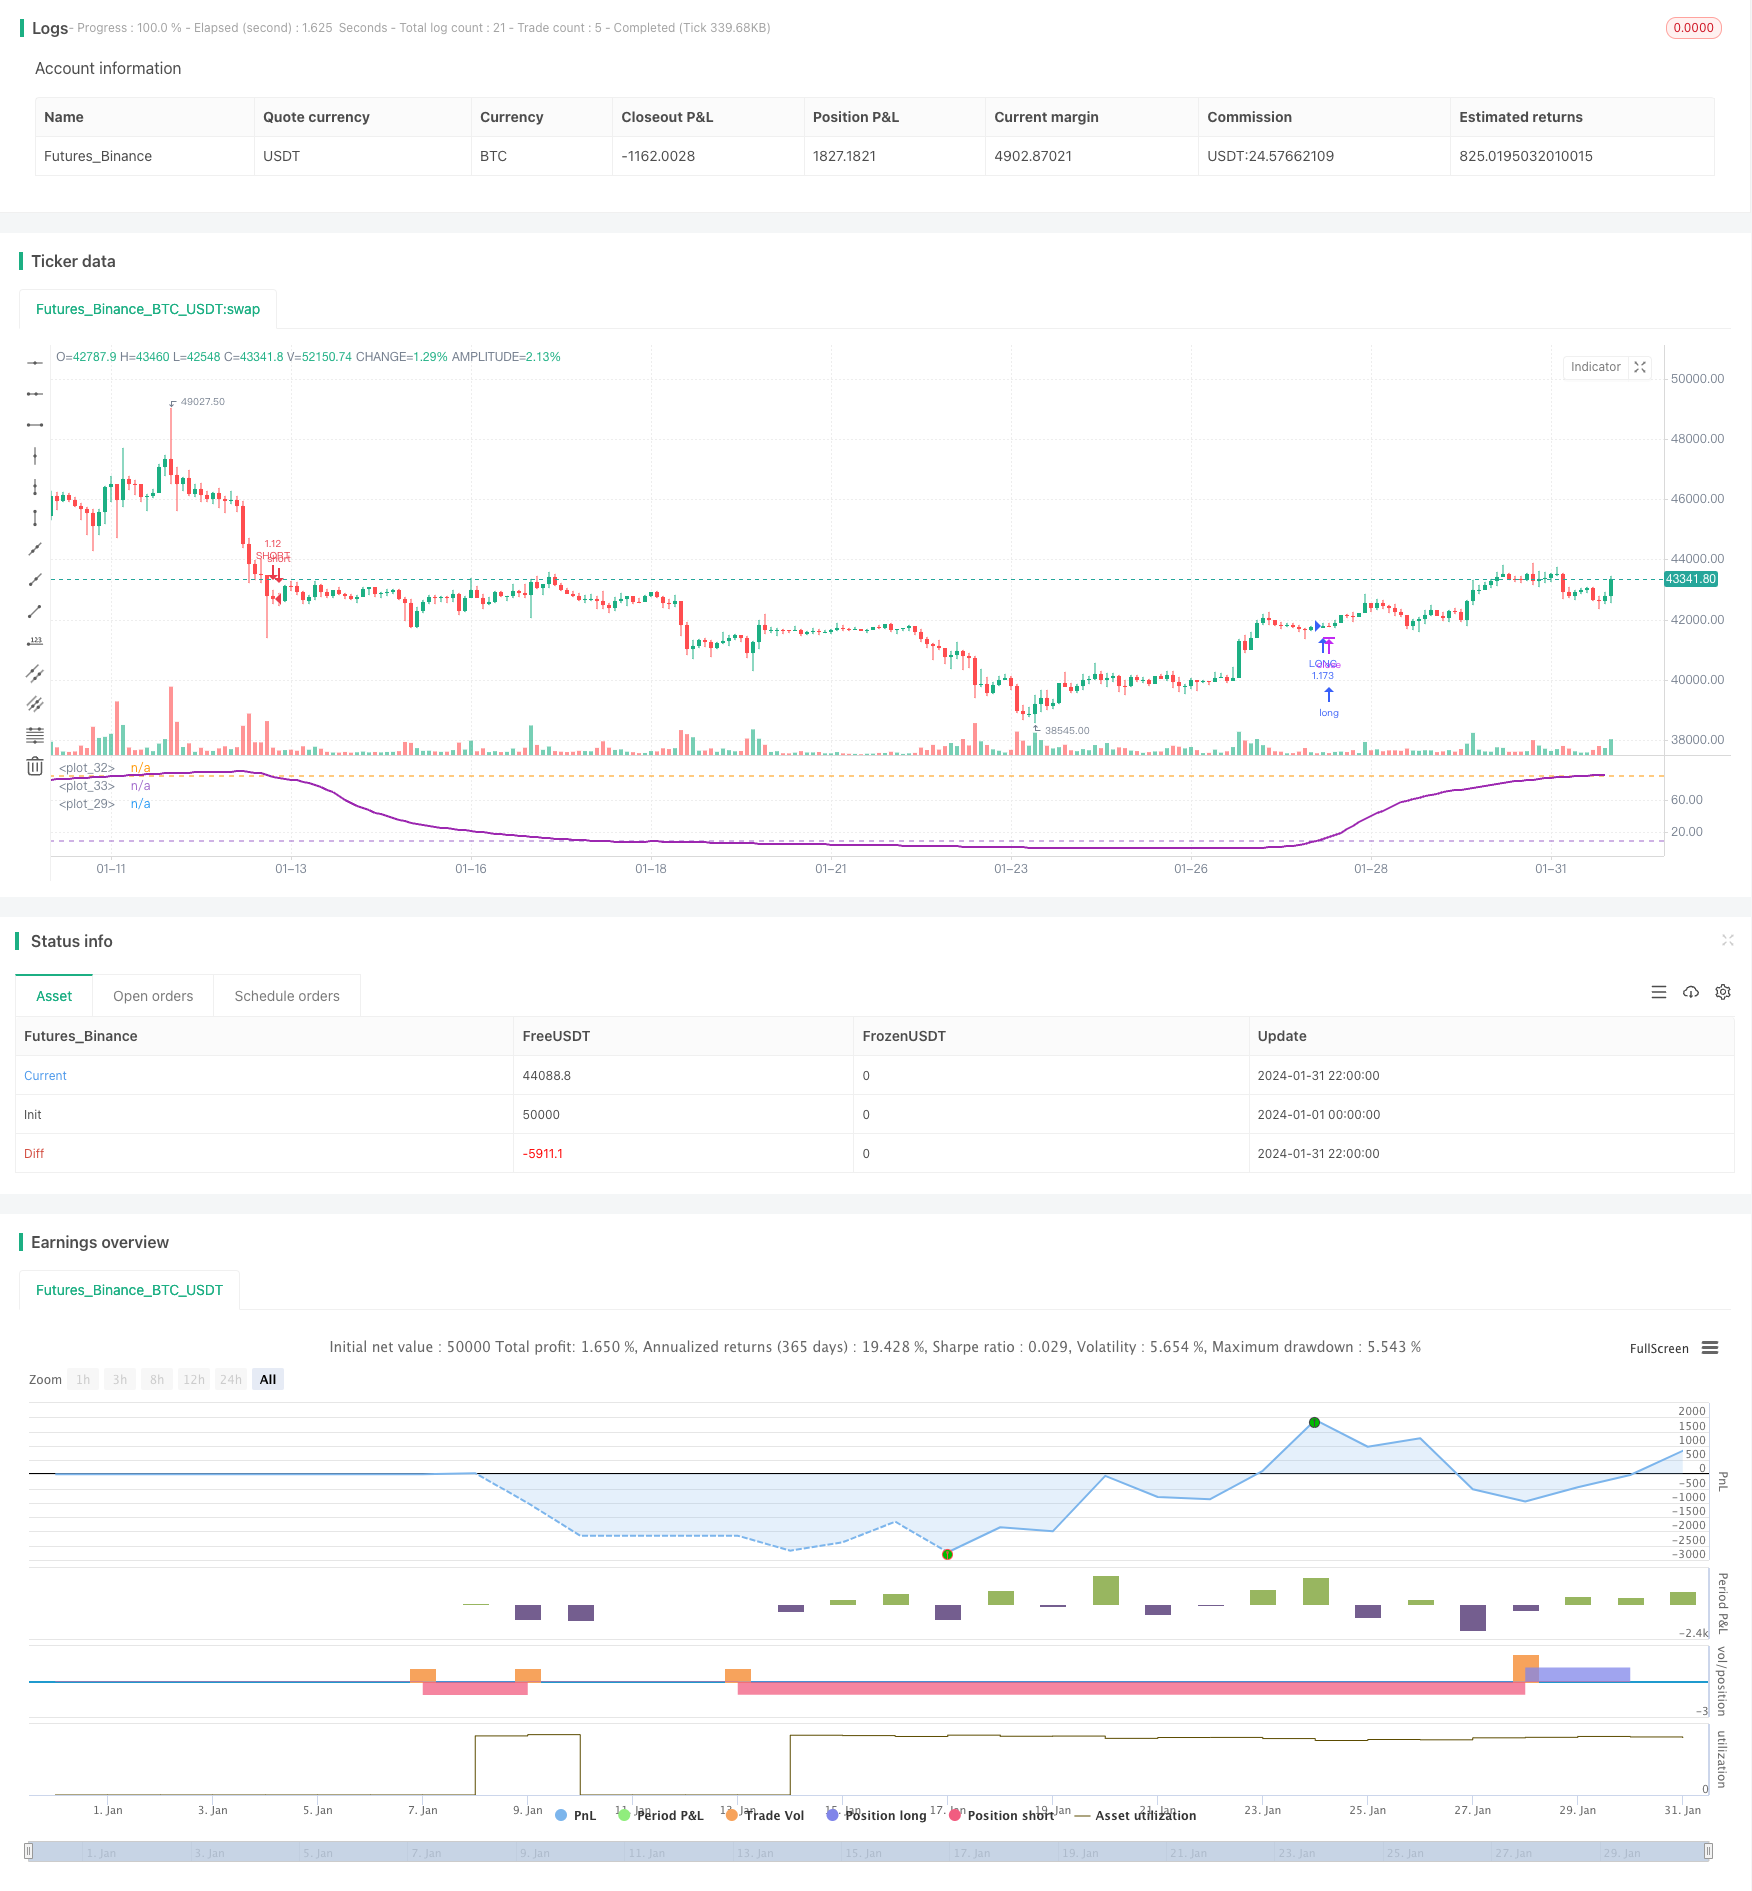
概述
本策略是一个基于年内调整的RSI震荡交易策略,通过追踪RSI指标在设定的上下轨之间的震荡特征,在RSI指标触碰上下轨时发出交易信号。
策略原理
- 设置MA均线长度、RSI参数、上下轨、止盈止损参数、交易周期范围
- 计算RSI指标值,RSI=(上涨平均值)/(上涨平均值+下跌平均值)*100
- 绘制RSI指标和上下轨
- RSI指标上穿下轨为做多信号,下穿上轨为做空信号
- 开仓建立OCO挂单
- 按照设置的止盈止损逻辑进行止损和止盈
策略优势分析
- 通过设置年度内的交易周期,可以避免一些不合适的外部环境。
- RSI指标可以有效反映超买超卖情况,通过设定合理区间进行震荡交易,可以过滤掉部分噪音。
- OCO挂单结合止盈止损设定,可以实现高效的风险控制。
策略风险分析
- RSI临界判断准确性无法保证,可能存在一定的误判风险。
- 年内交易周期设置不当可能错过更好的交易机会或进入不适当交易环境。
- 止损点设定过大可能造成较大亏损,止盈点设定过小可能造成利润太小。
可以通过调整RSI参数、交易周期时间范围、止盈止损比例等方法进行优化。
策略优化方向
- 测试不同市场不同周期下RSI参数的最优值
- 分析整体行情周期规律,设定最佳的年内交易时间段
- 通过回测确定合理的止盈止损比例
- 优化交易品种选择和加大持仓规模
- 结合其他更优交易技巧或指标进行优化
总结
本策略通过RSI指标在年内指定周期的震荡特征进行趋势跟踪交易,有效控制了交易风险。通过参数优化和规则优化,可以获得更高的策略效果。
策略源码
/*backtest
start: 2024-01-01 00:00:00
end: 2024-01-31 23:59:59
period: 2h
basePeriod: 15m
exchanges: [{"eid":"Futures_Binance","currency":"BTC_USDT"}]
*/

//@version=3
strategy(title = "Bitlinc MARSI Study AST",shorttitle="Bitlinc MARSI Study AST",default_qty_type = strategy.percent_of_equity, default_qty_value = 100,commission_type=strategy.commission.percent,commission_value=0.1,initial_capital=1000,currency="USD",pyramiding=0, calc_on_order_fills=false)

// === General Inputs ===
lengthofma = input(62, minval=1, title="Length of MA")
len = input(31, minval=1, title="Length")
upperband = input(89, minval=1, title='Upper Band for RSI')
lowerband = input(10, minval=1, title="Lower Band for RSI")
takeprofit =input(1.25, title="Take Profit Percent")
stoploss =input(.04, title ="Stop Loss Percent")
monthfrom =input(8, title = "Month Start")
monthuntil =input(12, title = "Month End")
dayfrom=input(1, title= "Day Start")
dayuntil=input(31, title= "Day End")

// === Innput Backtest Range ===
//FromMonth = input(defval = 9, title = "From Month", minval = 1, maxval = 12)
//FromDay   = input(defval = 1, title = "From Day", minval = 1, maxval = 31)
//FromYear  = input(defval = 2018, title = "From Year", minval = 2017)
//ToMonth   = input(defval = 1, title = "To Month", minval = 1, maxval = 12)
//ToDay     = input(defval = 1, title = "To Day", minval = 1, maxval = 31)
//ToYear    = input(defval = 9999, title = "To Year", minval = 2017)

// === Create RSI ===
src=sma(close,lengthofma)
up = rma(max(change(src), 0), len)
down = rma(-min(change(src), 0), len)
rsi = down == 0 ? 100 : up == 0 ? 0 : 100 - (100 / (1 + up / down))
plot(rsi,linewidth = 2, color=purple)

// === Plot Bands ===
band1 = hline(upperband)
band0 = hline(lowerband)
fill(band1, band0, color=blue, transp=95)

// === Entry and Exit Methods ===
longCond =  crossover(rsi,lowerband)
shortCond =  crossunder(rsi,upperband)

// === Long Entry Logic ===
if (  longCond )
    strategy.entry("LONG", strategy.long, stop=close, oca_name="TREND", comment="LONG")
else
    strategy.cancel(id="LONG")

// === Short Entry Logic ===
if ( shortCond   )
    strategy.entry("SHORT", strategy.short,stop=close, oca_name="TREND",  comment="SHORT")
else
    strategy.cancel(id="SHORT")

// === Take Profit and Stop Loss Logic ===
//strategy.exit("Take Profit LONG", "LONG", profit = close * takeprofit / syminfo.mintick, loss = close * stoploss / syminfo.mintick)
//strategy.exit("Take Profit SHORT", "SHORT", profit = close * takeprofit / syminfo.mintick, loss = close * stoploss / syminfo.mintick)
strategy.exit("LONG TAKE PROFIT", "LONG", profit = close * takeprofit / syminfo.mintick)
strategy.exit("SHORT STOP LOSS", "SHORT", profit = close * takeprofit / syminfo.mintick)
strategy.exit("LONG STOP LOSS", "LONG", loss = close * stoploss / syminfo.mintick)
strategy.exit("SHORT STOP LOSS", "SHORT", loss = close * stoploss / syminfo.mintick)