1
フォロー
1627
フォロワー
概要
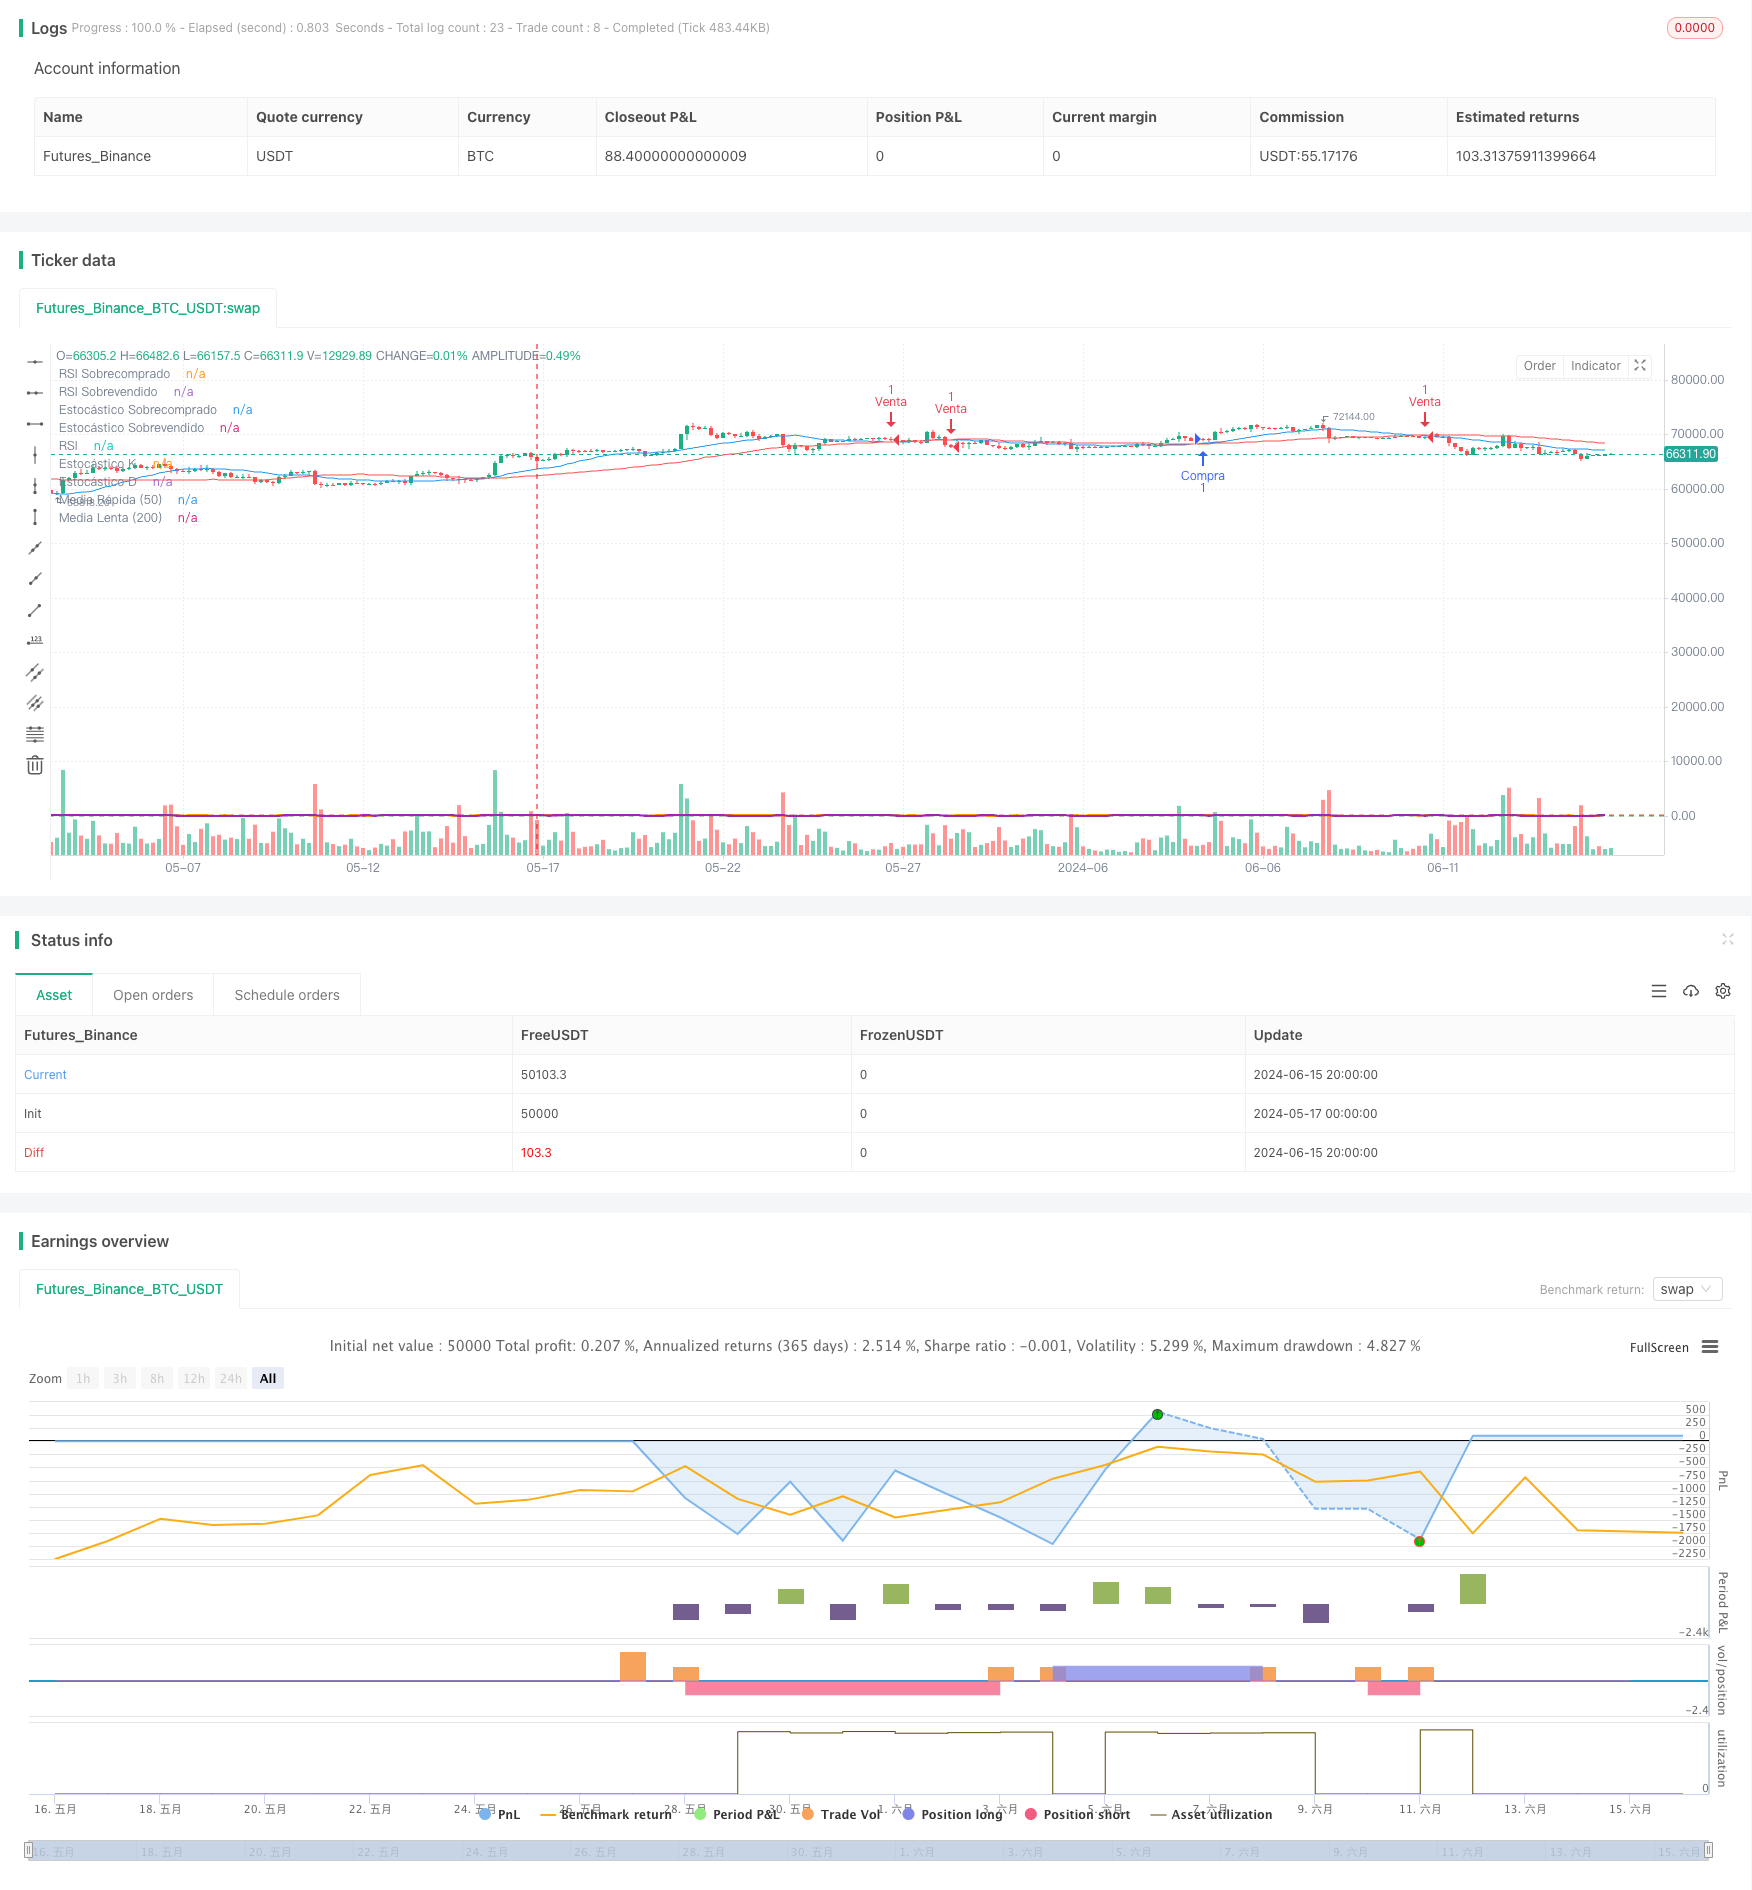
この戦略は,双均線交差,RSIとランダムな指標を組み合わせ,複数の技術指標の共同確認によって,ショートライン取引で高い勝率の取引機会を探します. この戦略は,20日と50日の2つの移動平均の交差を主要取引信号として使用し,RSIとランダムな指標を補助判断として組み合わせ,取引信号を二度確認します. さらに,この戦略は,ATRを停止と停止の基礎として採用し,固定リスクと利益の比較を頭部管理し,リスクを制御しながら安定した利益を得ることを目指します.
戦略原則
- 20日と50日の2つの移動平均を計算すると,短期平均線が長期平均線を穿越すると多行シグナルが生じ,逆に空行シグナルが生じます.
- RSI指標を補助判断として導入し,RSI指標が超買いまたは超売り範囲に達していない場合にのみポジションを考慮する.
- ランダムな指標を補助判断として導入し,ランダムな指標K線が超買または超売の区間に達していない場合にのみ,ポジションを考慮する.
- ATRを使用して,ストップとストップの位置を計算し,1:2のリスクと利益比でストップとストップの価格を設定します.
- オーダーした時は,ストップ・ロスは最低価格減算ATR,ストップ・ロスは最高価格加算2倍ATR;空白した時は,ストップ・ロスは最高価格加算ATR,ストップ・ロスは最低価格減算2倍ATR。
戦略的優位性
- 双均線交差は,RSIとランダムな指標と組み合わせた簡単なトレンド判断指標で,偽信号を効果的にフィルターします.
- RSIとランダムな指標は,市場が過買過売状態にあるかどうかを判断し,極端な状況で入場を避けるのに役立ちます.
- 固定リスク/報酬比のポジション管理方式は,全体的なリスクをコントロールした前提で,比較的安定した収益を得ることができます.
- パラメータは調整可能で,異なる市場環境と取引スタイルに適用されます.
戦略リスク
- トレンド型戦略は,波動的な市場では,偽の信号を多く生み出し,頻繁に取引し,資金の損失を招きます.
- 固定比率のストップ損失は,単一の損失を過大にし,資金曲線を弱める可能性があります.
- ポジション管理と資金管理の考慮が欠如しているため,極端な状況に対応するのは困難です.
戦略最適化の方向性
- 信号の正確性と信頼性を向上させるため,より効果的な技術指標を導入します.
- ストップ・ロスト・ストップの設定方法を最適化し,よりダイナミックで知的な方法で戦略の収益レベルを向上させる.
- ポジション管理では,ATRなどの変動率指標を組み合わせて,ポジションの動的調整を行うことができます.
- 資金管理において,リスク予算,ケリー公式などの方法を導入し,資金の利用効率を向上させる.
要約する
この戦略は,双均線,RSI,およびランダムな指標に基づいたショートライン取引戦略であり,複数の技術指標の共同承認によって,トレンドの機会を把握しながら,取引リスクを制御します. 戦略の論理は明確で,パラメータは簡単に最適化され,ショートライン取引を行う投資家の使用に適しています. しかし,この戦略には,トレンドの把握能力の制限,ポジションと資金のダイナミック管理の欠如などの欠陥があります.
ストラテジーソースコード
/*backtest
start: 2024-05-17 00:00:00
end: 2024-06-16 00:00:00
period: 4h
basePeriod: 15m
exchanges: [{"eid":"Futures_Binance","currency":"BTC_USDT"}]
*/

//@version=5
strategy("Cruce de Medias con Filtros de RSI y Estocástico", overlay=true)

// Definir parámetros de las medias móviles
fast_length = input(20, title="Periodo de Media Rápida")
slow_length = input(50, title="Periodo de Media Lenta")

// Calcular medias móviles
fast_ma = ta.sma(close, fast_length)
slow_ma = ta.sma(close, slow_length)

// Añadir filtro RSI
rsi_length = input(7, title="Periodo del RSI")
rsi = ta.rsi(close, rsi_length)
rsi_overbought = input(70, title="RSI Sobrecomprado")
rsi_oversold = input(30, title="RSI Sobrevendido")

// Añadir filtro Estocástico
k_period = input(7, title="K Periodo del Estocástico")
d_period = input(3, title="D Periodo del Estocástico")
smooth_k = input(3, title="Suavización del Estocástico")
stoch_k = ta.sma(ta.stoch(close, high, low, k_period), smooth_k)
stoch_d = ta.sma(stoch_k, d_period)
stoch_overbought = input(80, title="Estocástico Sobrecomprado")
stoch_oversold = input(20, title="Estocástico Sobrevendido")

// Definir niveles de stop-loss y take-profit con ratio 2:1
risk = input(1, title="Riesgo en ATR")
reward_ratio = input(2, title="Ratio Riesgo/Beneficio")
atr_length = input(14, title="Periodo del ATR")
atr = ta.atr(atr_length)
stop_loss = risk * atr
take_profit = reward_ratio * stop_loss

// Señal de compra
long_condition = ta.crossover(fast_ma, slow_ma) and rsi < rsi_overbought and stoch_k < stoch_overbought
if (long_condition)
    strategy.entry("Compra", strategy.long)

// Señal de venta
short_condition = ta.crossunder(fast_ma, slow_ma) and rsi > rsi_oversold and stoch_k > stoch_oversold
if (short_condition)
    strategy.entry("Venta", strategy.short)

// Configurar Stop-Loss y Take-Profit para posiciones largas
if (strategy.position_size > 0)
    strategy.exit("Take Profit/Stop Loss", from_entry="Compra", stop=low - stop_loss, limit=high + take_profit)

// Configurar Stop-Loss y Take-Profit para posiciones cortas
if (strategy.position_size < 0)
    strategy.exit("Take Profit/Stop Loss", from_entry="Venta", stop=high + stop_loss, limit=low - take_profit)

// Plotear las medias móviles en el gráfico
plot(fast_ma, title="Media Rápida (50)", color=color.blue)
plot(slow_ma, title="Media Lenta (200)", color=color.red)

// Plotear RSI y Estocástico en subgráficos
hline(rsi_overbought, "RSI Sobrecomprado", color=color.red)
hline(rsi_oversold, "RSI Sobrevendido", color=color.green)
plot(rsi, title="RSI", color=color.orange, linewidth=2)
hline(stoch_overbought, "Estocástico Sobrecomprado", color=color.red)
hline(stoch_oversold, "Estocástico Sobrevendido", color=color.green)
plot(stoch_k, title="Estocástico K", color=color.purple, linewidth=2)
plot(stoch_d, title="Estocástico D", color=color.purple, linewidth=1, style=plot.style_stepline)