1
フォロー
1179
フォロワー
概要
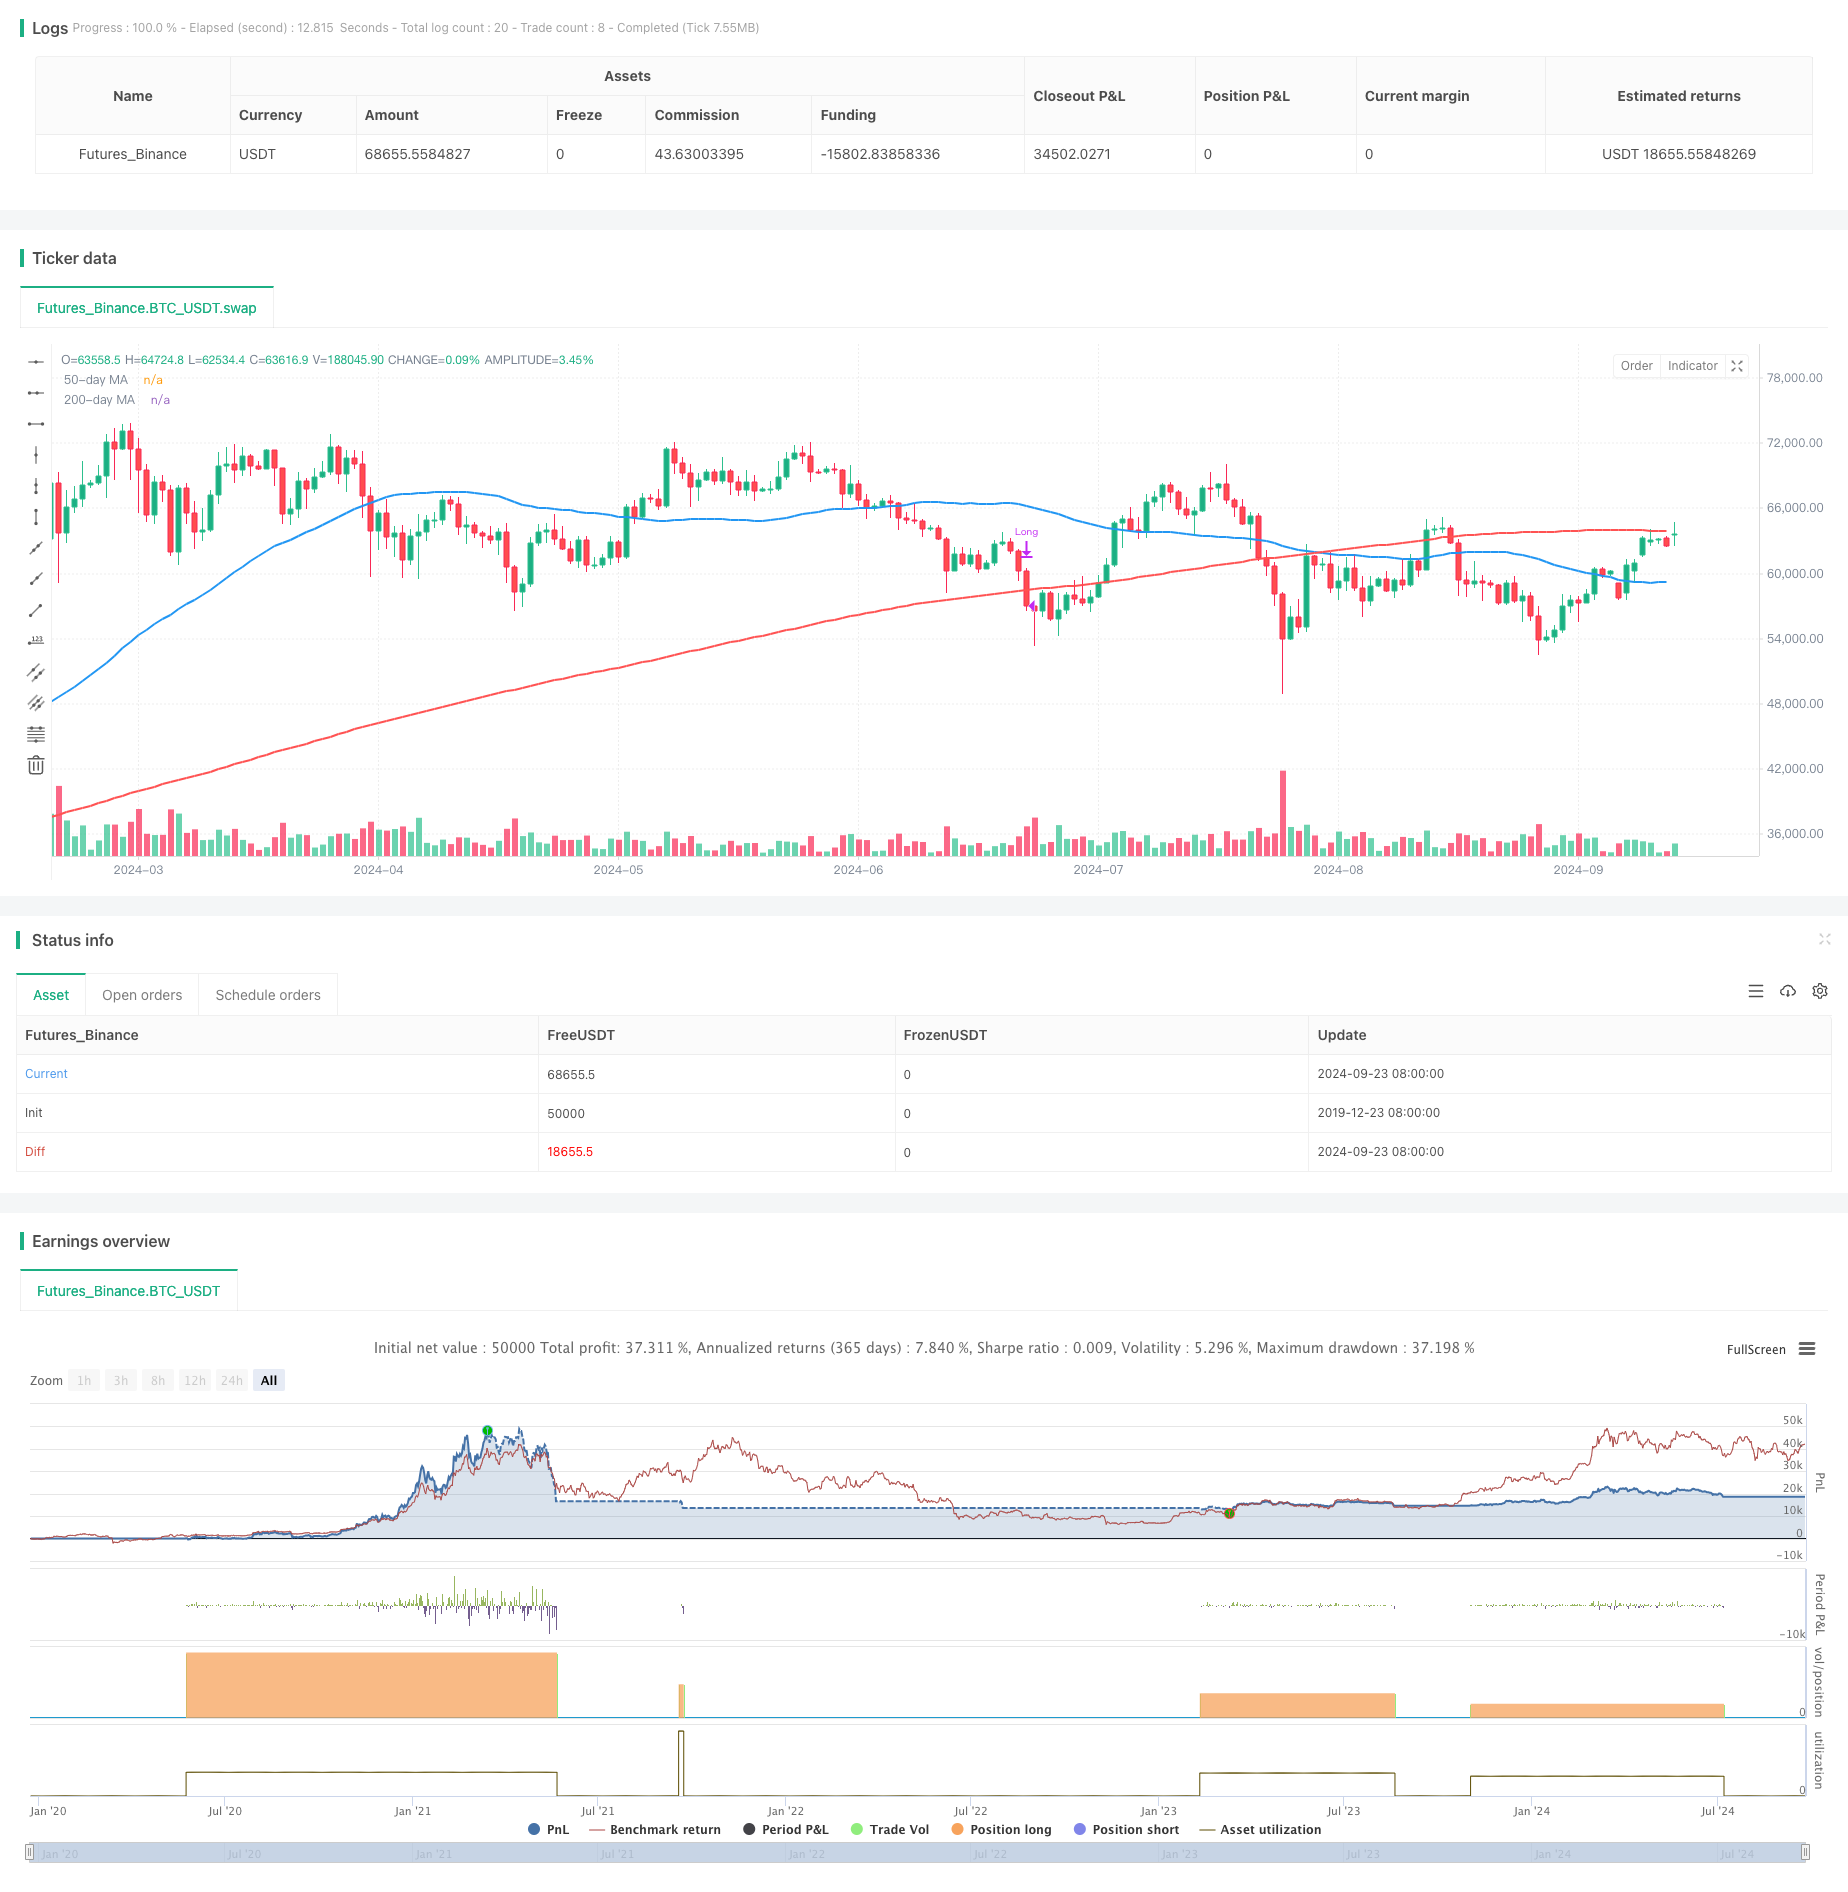
これは,自己適応リスク管理とダイナミックポジション調整を組み合わせた双均線金交差に基づく取引戦略である.この戦略は50日および200日単調移動平均 ((SMA)) を使用してトレンドを識別し,50日均線で200日均線を横切るときに買取シグナルを生成する.同時に,この戦略は,総口座価値の2.5%をベースにしたリスク管理方法を採用し,各取引のポジションの大きさを動的に計算し,相対的に200日均線に対するパーセンテージ・ストップを使用して利益を保護する.
戦略原則
- 入場シグナル:50日平均線で200日平均線を穿ったとき ((金交差),買入シグナルを発動する。
- リスク管理:取引ごとに,口座総額の2.5%を超えないリスク.
- ポジション計算:リスク額とストップダスト距離に基づいて動的に計算される取引毎のポジションの大きさ.
- ストップ・ロスの設定:ストップ・ロスの価格を200日平均線の下1.5%に設定する.
- 出口条件:価格が200日平均線を下回ると平仓を終了する.
戦略的優位性
- トレンドトラッキング: 金のクロスを使って,強な上昇傾向を捉え,利益の機会を向上させる.
- リスク管理: リスクの管理により,各取引のリスクを効果的に制御する.
- ダイナミックポジション:市場の変動に応じてポジションのサイズを自動的に調整し,リスクと利益の間のバランスを取ります.
- 柔軟なストップ:相対的なストップを使用し,市場の波動に自動的に調整し,利益を保護すると同時に価格に十分な波動スペースを与えます.
- 明確な出場: 明確な出場条件を設定し,主観的な判断がもたらす躊躇を避ける.
戦略リスク
- 偽の突破: 揺れ動いている市場では,偽の信号が頻繁に発生し,小額の損失が連続して発生する可能性があります.
- 落後性:移動平均は本質的に落後的な指標であり,トレンドの初期に大幅な上昇を逃している可能性があります.
- 大幅な跳躍:下向きに大幅な跳躍が発生した場合,実際のストップダストは,既定の2.5%のリスク制限を超えることがあります.
- 過剰取引:横軸市場では,均線が頻繁に交差し,不必要な取引コストを増加させる可能性があります.
- 単一の技術指標: 移動平均のみに頼ると,他の重要な市場情報を無視する可能性があります.
戦略最適化の方向性
- フィルタリングメカニズムを導入する:取引量,変動率などの指標を追加し,より信頼性の高い取引シグナルをフィルタリングすることを検討する.
- 入場時間を最適化:他の技術指標 (RSI,MACDなど) と組み合わせてトレンドを確認し,偽突破を減らす.
- 動的調整パラメータ:異なる市場周期に応じて平均線周期を自動的に調整し,戦略の適応性を向上させる.
- ストップメカニズムの追加: 動的なストップ条件を設定し,強気な状況でより多くの利益をロックします.
- 分散リスク:この戦略を複数の関連のない市場で同時に適用することを検討し,体系的リスクを低減する.
要約する
この二均線金交差に基づく自適化リスク管理戦略は,古典的な技術分析方法と現代的なリスク管理技術を組み合わせることで,トレーダーに比較的安定した取引システムを提供している.それは中長期のトレンドを捕捉するだけでなく,リスクを効果的に制御することができ,安定した収益を追求する投資家に適しています.しかし,この戦略を使用するトレーダーは,市場の変化を注意深く観察し,実際の取引のパフォーマンスに基づいてパラメータを常に最適化する必要があります.
ストラテジーソースコード
/*backtest
start: 2019-12-23 08:00:00
end: 2024-09-24 08:00:00
period: 1d
basePeriod: 1d
exchanges: [{"eid":"Futures_Binance","currency":"BTC_USDT"}]
*/

//@version=5
strategy("Golden Cross with 1.5% Stop-Loss & MA Exit", overlay=true)

// Define the 50-day and 200-day moving averages
ma50 = ta.sma(close, 50)
ma200 = ta.sma(close, 200)

// Entry condition: 50-day MA crosses above 200-day MA (Golden Cross)
goldenCross = ta.crossover(ma50, ma200)

// Exit condition: price drops below the 200-day MA
exitCondition = close < ma200

// Set the stop-loss to 1.5% below the 200-day moving average
stopLoss = ma200 * 0.985  // 1.5% below the 200-day MA

// Risk management (1.5% of total equity)
riskPercent = 0.025  // 1.5% risk
equity = strategy.equity
riskAmount = equity * riskPercent

// Calculate the distance between the entry price (close) and the stop-loss
stopDistance = close - stopLoss

// Calculate position size based on the risk amount and stop-loss distance
if (goldenCross and stopDistance > 0)
    positionSize = riskAmount / stopDistance
    strategy.entry("Long", strategy.long, qty=positionSize)

// Exit the trade when the price crosses below the 200-day moving average
if (exitCondition)
    strategy.close("Long")

// Plot the moving averages on the chart for visualization
plot(ma50, color=color.blue, linewidth=2, title="50-day MA")
plot(ma200, color=color.red, linewidth=2, title="200-day MA")