概要
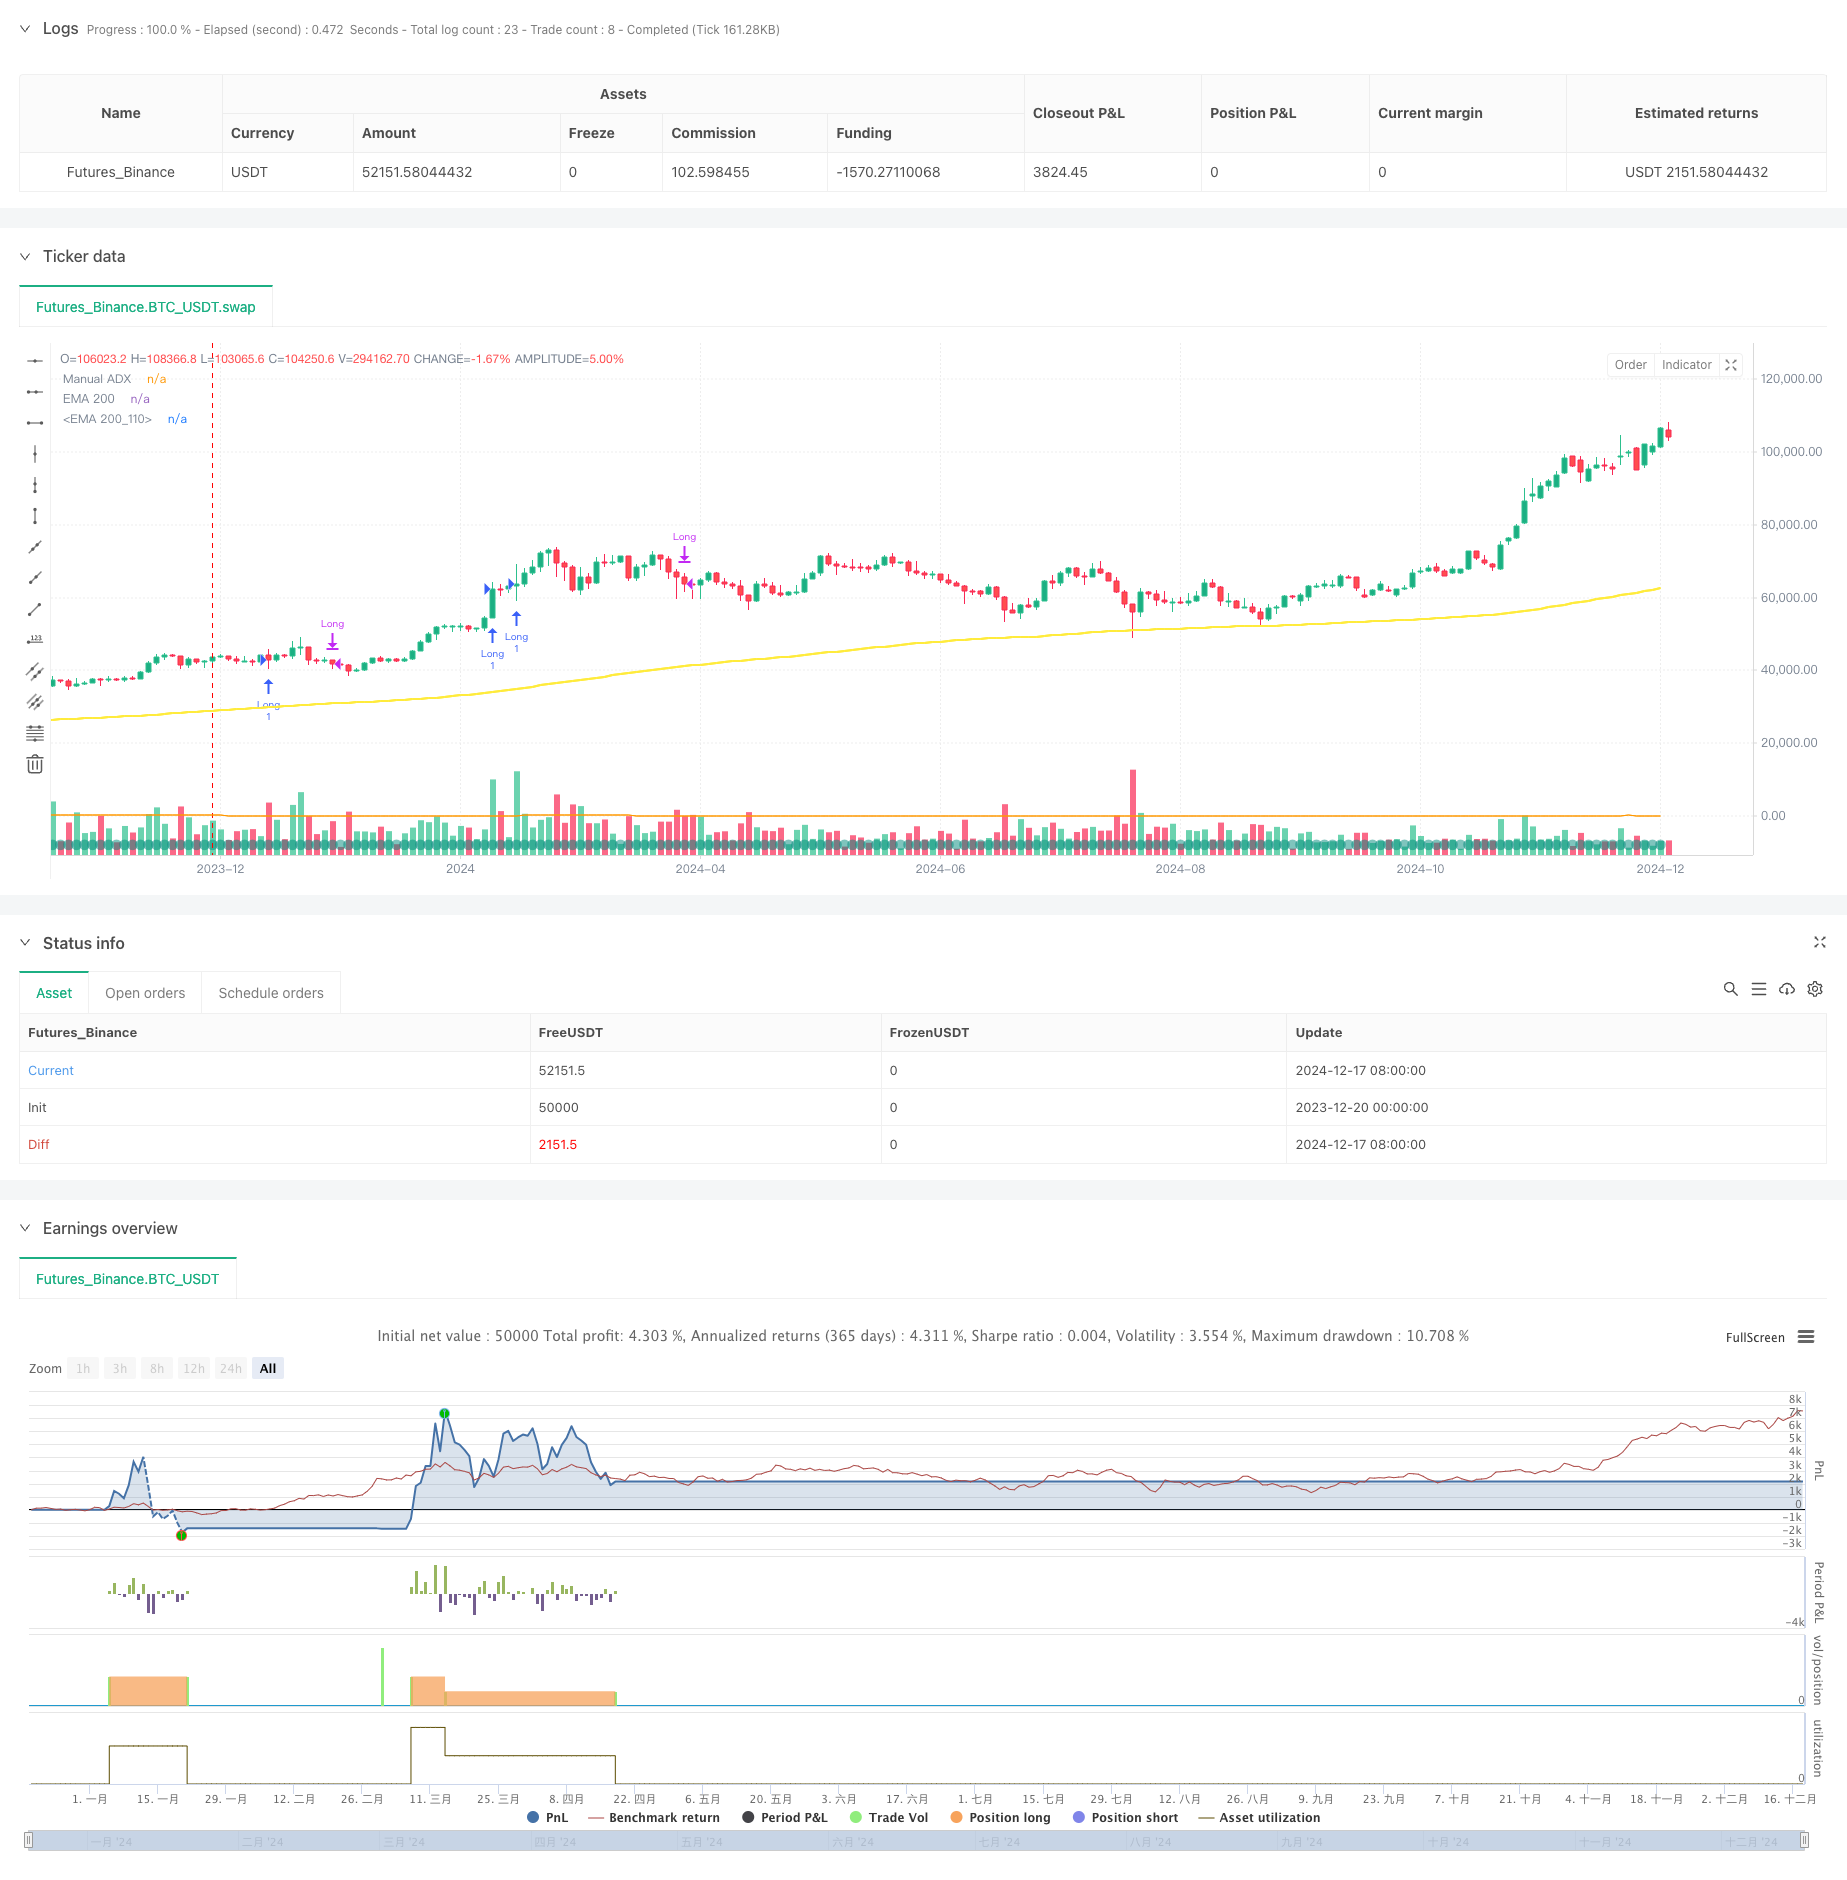
この戦略は,トレンド追跡と振動取引を組み合わせた混合戦略システムであり,複数の技術指標のフィルタリングと厳格な資金管理により安定した取引を実現します.戦略は,ステップストップ方式で利益をロックし,最大撤退制御を設定し,収益を保証しながらもリスクを制御します.システムは,RSI動量指標とADXトレンド強度指標を主要な取引シグナルトリガー条件として使用し,取引量,ATR,EMAなどの複数のフィルターと組み合わせて,取引の有効性を保証します.
戦略原則
戦略の中核となるロジックには、次の重要な要素が含まれます。
- 入場条件は,取引量100万以上で,ADXは25以上で,トレンドがはっきりしていることを示し,RSIは60以上で,強い動きを示し,ATRは2以上で,十分な波動空間を確保し,価格は200日平均線の上方で上昇傾向を維持する.
- 分段停止設計:最初のストップは15%で,平仓は50%のポジション;第二のストップは30%で,残りのポジションを平らにする.この設計は,早期に利益の一部をロックし,大きなトレンドを逃さない.
- ストップ・コントロール: ストップ・ローンの15%を設定し,RSIが50以下または価格が200の平均線を下回ったときに平仓に出る.
- 撤収管理:戦略の純資産をリアルタイムで追跡し,撤収が30%を超えるとシステム的な風力制御を起動し,すべての保有物を空白する.
戦略的優位性
- 複数のテクニカル指標を相互検証して取引シグナルの信頼性を向上させる
- スピードストップは短期的な利益と大きなトレンドを考慮して設計されています.
- リスク管理システム (個人株のストップ・ローズとシステム上のリスク管理を含む)
- 取引条件が厳格で,偽の信号を効果的にフィルターします.
- 市場状況に応じてパラメータを調整するための明確な戦略論理
戦略リスク
- 複数の指標をフィルターすることで,一部の取引機会を逃す可能性があります.
- 不安定な市場ではストップロスが頻繁に発動される可能性がある
- 固定パーセンテージのストップとストップの設定は,すべての市場環境に適さない可能性があります.
- 戦略は技術指標に依存し,基本的には突発的な事態に反応することができない.
- 取引量要件を満たすために,より大きな資金が必要
戦略最適化の方向性
- 市場変動の動向に合わせて適応的な止損停止メカニズムを導入する
- 市場環境判断モジュールを追加し,異なる市場条件で異なるパラメータ設定を使用
- ADX計算方法を最適化し,自適化サイクルを使用することを考慮する
- 取引コストを考慮し,ポジション管理システムを最適化
- 機械学習に基づくシグナルフィルタリングの開発
要約する
この戦略は,複数の技術指標と厳格な資金管理により,安定した取引を実現する総合的な取引システムである.戦略の核心的な優位性は,その完善したリスク制御システムと段階的な停止機構にあるが,同時に,実際のアプリケーションで市場状況に適したパラメータ設定の調整にも注意する必要がある.戦略のさらなる最適化スペースは,主にパラメータのダイナミックな自己適応とシグナルフィルタリング機構の改善にある.
ストラテジーソースコード
/*backtest
start: 2023-12-20 00:00:00
end: 2024-12-18 08:00:00
period: 2d
basePeriod: 2d
exchanges: [{"eid":"Futures_Binance","currency":"BTC_USDT"}]
*/

//@version=5
strategy(title="Swing Strategy (<30% DD)", shorttitle="SwingStratDD", overlay=true)

//-----------------------------------------------------
// Example Indicators and Logic
//-----------------------------------------------------
emaLen   = input.int(200, "EMA Length", minval=1)
emaValue = ta.ema(close, emaLen)

plot(emaValue, color=color.yellow, linewidth=2, title="EMA 200")


//-----------------------------------------------------
// User Inputs
//-----------------------------------------------------
adxLen           = input.int(14,  "ADX Length",      minval=1)
rsiLen           = input.int(14,  "RSI Length",      minval=1)
atrLen           = input.int(14,  "ATR Length",      minval=1)

rsiBuyThresh     = input.float(60, "RSI Buy Threshold",     minval=1, maxval=100)
adxThresh        = input.float(25, "ADX Threshold (Trend)", minval=1, maxval=100)
minVolume        = input.float(1e6,"Minimum Volume",         minval=1)
minATR           = input.float(2,  "Minimum ATR(14)",        minval=0.1, step=0.1)

stopLossPerc     = input.float(15, "Stop-Loss %",            minval=0.1, step=0.1)
// We’ll do two partial take-profit levels to aim for consistent cashflow:
takeProfit1Perc  = input.float(15, "Take-Profit1 %",         minval=0.1, step=0.1)
takeProfit2Perc  = input.float(30, "Take-Profit2 %",         minval=0.1, step=0.1)

ddLimit          = input.float(30, "Max Drawdown %",         minval=0.1, step=0.1)

//-----------------------------------------------------
// Indicators
//-----------------------------------------------------

rsiValue = ta.rsi(close, rsiLen)
atrValue = ta.atr(atrLen)

//--- Fully Manual ADX Calculation ---
upMove      = high - high[1]
downMove    = low[1] - low
plusDM      = (upMove > downMove and upMove > 0) ? upMove : 0.0
minusDM     = (downMove > upMove and downMove > 0) ? downMove : 0.0
smPlusDM    = ta.rma(plusDM, adxLen)
smMinusDM   = ta.rma(minusDM, adxLen)
smTR        = ta.rma(ta.tr, adxLen)
plusDI      = (smPlusDM / smTR) * 100
minusDI     = (smMinusDM / smTR) * 100
dx          = math.abs(plusDI - minusDI) / (plusDI + minusDI) * 100
adxValue    = ta.rma(dx, adxLen)

//-----------------------------------------------------
// Screener-Like Conditions (Technical Only)
//-----------------------------------------------------
volumeCondition   = volume > minVolume
adxCondition      = adxValue > adxThresh
rsiCondition      = rsiValue > rsiBuyThresh
atrCondition      = atrValue > minATR
aboveEmaCondition = close > emaValue

longCondition = volumeCondition and adxCondition and rsiCondition and atrCondition and aboveEmaCondition

//-----------------------------------------------------
// Strategy Entry / Exit Logic
//-----------------------------------------------------
var bool inTrade = false

// Entry
if longCondition and not inTrade
    strategy.entry("Long", strategy.long)

// Basic Exit Condition: RSI < 50 or Price < EMA
exitCondition = (rsiValue < 50) or (close < emaValue)
if inTrade and exitCondition
    strategy.close("Long")

// Update inTrade status
inTrade := strategy.position_size > 0

//-----------------------------------------------------
// Multi-Level Stop-Loss & Partial Profits
//-----------------------------------------------------
if inTrade
    float entryPrice = strategy.position_avg_price

    // Stop-Loss
    float stopPrice     = entryPrice * (1 - stopLossPerc / 100)

    // Two partial take-profit levels
    float tp1Price      = entryPrice * (1 + takeProfit1Perc / 100)
    float tp2Price      = entryPrice * (1 + takeProfit2Perc / 100)

    // Example approach: exit half at TP1, half at TP2
    strategy.exit("TP1/SL",     from_entry="Long", stop=stopPrice,    limit=tp1Price, qty_percent=50)
    strategy.exit("TP2",        from_entry="Long", limit=tp2Price,    qty_percent=50)

//-----------------------------------------------------
// Dynamic Drawdown Handling
//-----------------------------------------------------
var float peakEquity = strategy.equity
peakEquity := math.max(peakEquity, strategy.equity)

currentDrawdownPerc = (peakEquity - strategy.equity) / peakEquity * 100
if currentDrawdownPerc > ddLimit
    strategy.close_all("Max Drawdown Exceeded")

//-----------------------------------------------------
// Plotting
//-----------------------------------------------------
plot(emaValue, title="EMA 200", color=color.yellow, linewidth=2)
plotchar(rsiValue, title="RSI", char='●', location=location.bottom, color=color.new(color.teal, 50))
plot(adxValue, title="Manual ADX", color=color.orange)